What is Apgar score
The Apgar score is a standardized system used by doctors and midwives to assess your newborn baby’s health or condition at birth. The Apgar score is used to check a newborn baby born at 1 minute and 5 minutes after their birth. The Apgar score system was used to estimate the probability of survival of the infant 1 and to appraise the need for resuscitation 2. The Apgar score helps medical staff decide if your baby needs medical or emergency care.
The Apgar score system offers a standardized, effective, and convenient assessment for newborn infants. It has gained widespread application by obstetricians all over the world for more than half a century.
The Apgar score checks five characteristics of your baby. These are:
- Skin color (0, 1 or 2)
- Heart rate (0, 1 or 2)
- Reflexes and responsiveness (0, 1 or 2)
- Muscle tone (0, 1 or 2)
- Breathing rate (0, 1 or 2)
Each characteristic is rated from 0, 1, or 2, with 2 being the best score and the sum of scores of the five components is the total score. The total gives an Apgar score out of 10 for your baby. The higher the score, the better the baby is doing after birth. A score of 7, 8, or 9 is normal and is a sign that the newborn is in good health. A score of 10 is very unusual, since almost all newborns lose 1 point for blue hands and feet, which is normal for after birth.
Any score lower than 7 is a sign that the baby needs medical attention. The lower the score, the more help the baby needs to adjust outside the mother’s womb.
Most of the time a low Apgar score is caused by:
- Difficult birth
- C-section
- Fluid in the baby’s airway
A baby with a low Apgar score may need:
- Oxygen and clearing out the airway to help with breathing
- Physical stimulation to get the heart beating at a healthy rate
Most of the time, a low score at 1 minute is near-normal by 5 minutes.
A lower Apgar score does not mean a child will have serious or long-term health problems. The Apgar score is not designed to predict the future health of the child.
Chart 1. Apgar score chart
The Apgar score guides midwives, doctors and nurses as to whether a baby needs immediate treatment or monitoring.
It is named after Dr Virginia Apgar, who developed the score in 1952, she was a Professor of Anesthesiology at Columbia University in the USA, she died in 1974 2. In 1952, Virginia Apgar proposed a score system as a rapid means of evaluating the clinical status of the newborn and the need for prompt intervention to establish breathing 2. Until her system became commonly used, doctors sometimes missed internal problems at birth such as circulatory or breathing difficulties, were missed by doctors because it was usually assumed that a newborn baby was healthy unless there was an obvious sign of something being wrong.
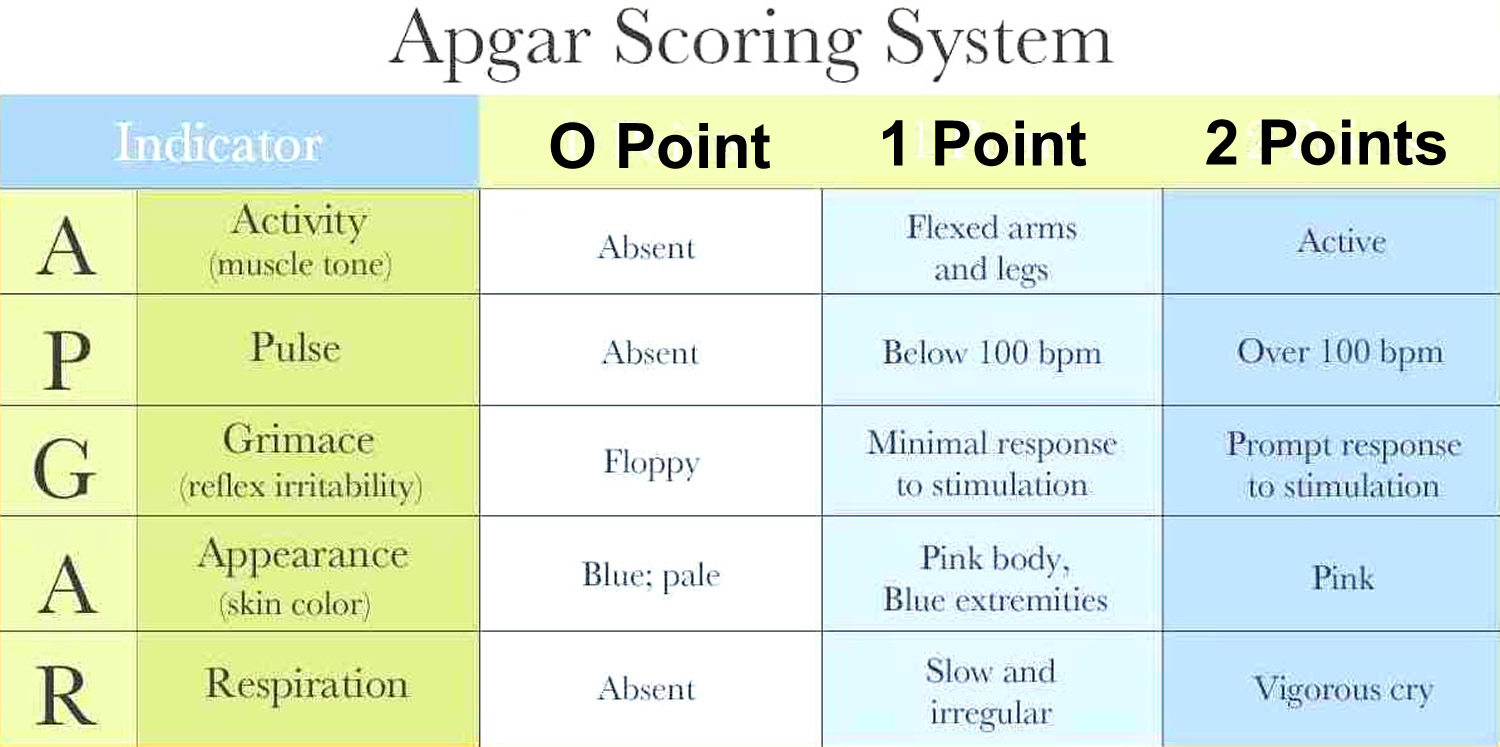
Apgar score table
The Apgar score was designed to assess a baby’s health quickly: the checks are conducted at one minute and 5 minutes after birth.
The Apgar score is based on 5 elements, which are sometimes named after the letters in Apgar’s name: Appearance, which relates to the pinkness or blueness of the baby’s skin tone; Pulse, which relates to its heart rate; Grimace, which tests the baby’s reflexes and response when the sole of its foot is stimulated; Activity, which checks the baby’s muscle tone; and Respiration, which assesses the rate of the baby’s breathing. Each element is given a score of 0, 1 or 2 to provide a total score of 10.
Table 1. The Apgar newborn scoring system
| Appearance A | Blue or pale skin tone = 0. Pink body but blue fingers and toes = 1. Completely pink = 2. |
| Pulse P | No heart rate detected = 0. Slow heart rate (below 100 beats per minute) = 1. Fast heart rate (more than 100 beats per minute) = 2. |
| Grimace G | No response when the sole of the foot is stimulated = 0. Baby grimaces when the foot is stimulated = 1. Baby cries when the foot is stimulated = 2. |
| Activity A | Baby is limp = 0. Baby shows some muscle flexing in its feet and hands = 1. Baby is active and can flex the muscles in its feet and hands = 2. |
| Respiration R | There are no signs of the baby’s breathing = 0. Baby has only a weak cry and can’t seem to get enough air into its lungs = 1. Baby is breathing well and can cry strongly = 2. |
A score of 7 or more is considered normal. However, if the baby has a low score at one minute and a normal score at 5 minutes, this, too, is considered normal, particularly if the birth took a long time, or if the mother was given pethidine during labor, which can affect the baby’s breathing.
A low Apgar score gives doctors a warning signal that they should check the baby for hidden health problems, such as breathing difficulties or internal bleeding, and allows them to give the baby crucial medical attention when it is most needed. Apgar checks may be continued every 5 minutes for up to 20 minutes in babies who receive a low score at 5 minutes.
Apgar score interpretation
The relationship between five-minute Apgar scores and infant survival indicates that the Apgar score is not only useful for neonatal period and term infants as it was 50 years ago, but the Apgar score is also meaningful for post-neonatal period and preterm infants 3. This study 3 found that the Apgar score showed its predictive value for infant death of both very preterm, preterm and term infants in post-neonatal period. In fact, this long-term predictive value was similarly found in twins. Hence, Apgar score could still be a good and convenient predictor of infant death.
It is worth noting that the value of Apgar score, in predicting the infant death in either the neonatal or post-neonatal period, was influenced by race/ethnicity 3. At the same level of Apgar score, the mortality of Black newborns was substantially lower than White newborns in neonatal period, while the mortality of Black infants was consistently higher in post-neonatal period 3. This observed “cross-over” phenomenon in the unadjusted analysis was confirmed in both preterm and term gestation after adjusting for socioeconomic status, approximated by maternal education, marital status and time when prenatal care started. These findings are consistent with previous literature in that there is a substantial health disparity between races probably due to socioeconomic status. On one hand, Black neonatal infants with lower socioeconomic status may ironically have the advantage of fetal organ maturity over White neonatal infants especially in preterm period. It was hypothesized that corticotropin-releasing hormone level may be higher in Blacks due to chronic stress or distress during pregnancy 4. Corticotropin-releasing hormone triggers the release of fetal cortisol from the adrenals, which is a crucial stimulus of organ development 5. Consequently, some organs such as fetal lung, were promoted to become mature sooner. On the other hand, Black post-neonatal infants with lower socioeconomic status may be at a higher risk of low socioeconomic status-related morbidity and mortality than White postnatal infants, such as infection, respiratory illness, impaired growth, inappropriate nutrition and poor social environment 6.
What do the Apgar scores mean?
- Normal – a total score of 7 or higher suggests that the condition of baby is good to excellent.
- A score of 6 or less at 1 minute and a score of 7 or more at 5 minutes is also normal.
- A score below 7 in the second test at 5 minutes is considered low.
If your baby’s score was low in the first Apgar test and hasn’t improved in the second test at 5 minutes, or there are other concerns, the doctors and nurses will closely monitor your baby and continue any necessary medical care.
What if my baby scores low on the Apgar test?
A low Apgar score warns doctors to check your baby for problems such as breathing difficulties. This helps make sure your baby is given medical attention when it is needed.
The Apgar score is just one piece of information doctors and nurses have. It is a guide, but only a guide. It does not mean there are going to be any problems later in life. It does not predict your baby’s long-term development.
Among births with a very low Apgar score at five minutes (1–3), the neonatal and post-neonatal mortality rates remained high until term (≥ 37 weeks). On the other hand, among births with a high Apgar score (≥7), neonatal and post-neonatal mortality rate decreased progressively with gestational age. Non-Hispanic White had a consistently higher neonatal mortality than non-Hispanic Black in both preterm and term births. However, for post-neonatal mortality, Black had significantly higher rate than White. The pattern of changes in neonatal and post-neonatal mortality by Apgar score in twin births is essentially the same as that in singleton births.
Apgar Score and Neonatal and Post-neonatal Mortality
Table 2 presents the distribution of Apgar score among preterm, term and post-term births and neonatal and post-neonatal mortality rates. Preterm births had about 10 to 20-time higher incidence of low Apgar score at 5 minutes (<7) than term and post-term births, though the vast majority of preterm births had a score greater than 7. Both neonatal and post-neonatal mortality rates decreased with increasing Apgar score.
Table 2. Distribution of Apgar score at 5 minutes in preterm, term & post-term births and corresponding neonatal & post-neonatal mortality rates.
| Apgar Score | Number of Birth | Distribution of Apgar Score in | Neonatal Mortality Rate (/1,000) | Post-neonatal Mortality Rate (/1,000) | ||
| Preterm Birth(24–36 weeks) (%) | Term Birth(37–41 weeks) (%) | Post-term Birth(42–44 weeks) (%) | ||||
| 1 | 13,737 | 0.43 | 0.02 | 0.03 | 581.86 | 26.64 |
| 2 | 12,104 | 0.293 | 0.03 | 0.04 | 334.68 | 34.37 |
| 3 | 18,532 | 0.38 | 0.05 | 0.07 | 192.42 | 35.51 |
| 4 | 29,320 | 0.57 | 0.07 | 0.12 | 121.28 | 30.56 |
| 5 | 55,968 | 1.00 | 0.15 | 0.21 | 74.58 | 23.48 |
| 6 | 129,788 | 2.31 | 0.35 | 0.48 | 43.47 | 19.72 |
| 7 | 341,768 | 5.20 | 1.01 | 1.28 | 18.91 | 12.11 |
| 8 | 1,680,329 | 16.00 | 5.84 | 6.62 | 4.39 | 4.91 |
| 9 | 20,760,364 | 69.60 | 84.29 | 82.76 | 0.59 | 1.82 |
| 10 | 1,968,967 | 4.23 | 8.20 | 8.40 | 0.37 | 1.59 |
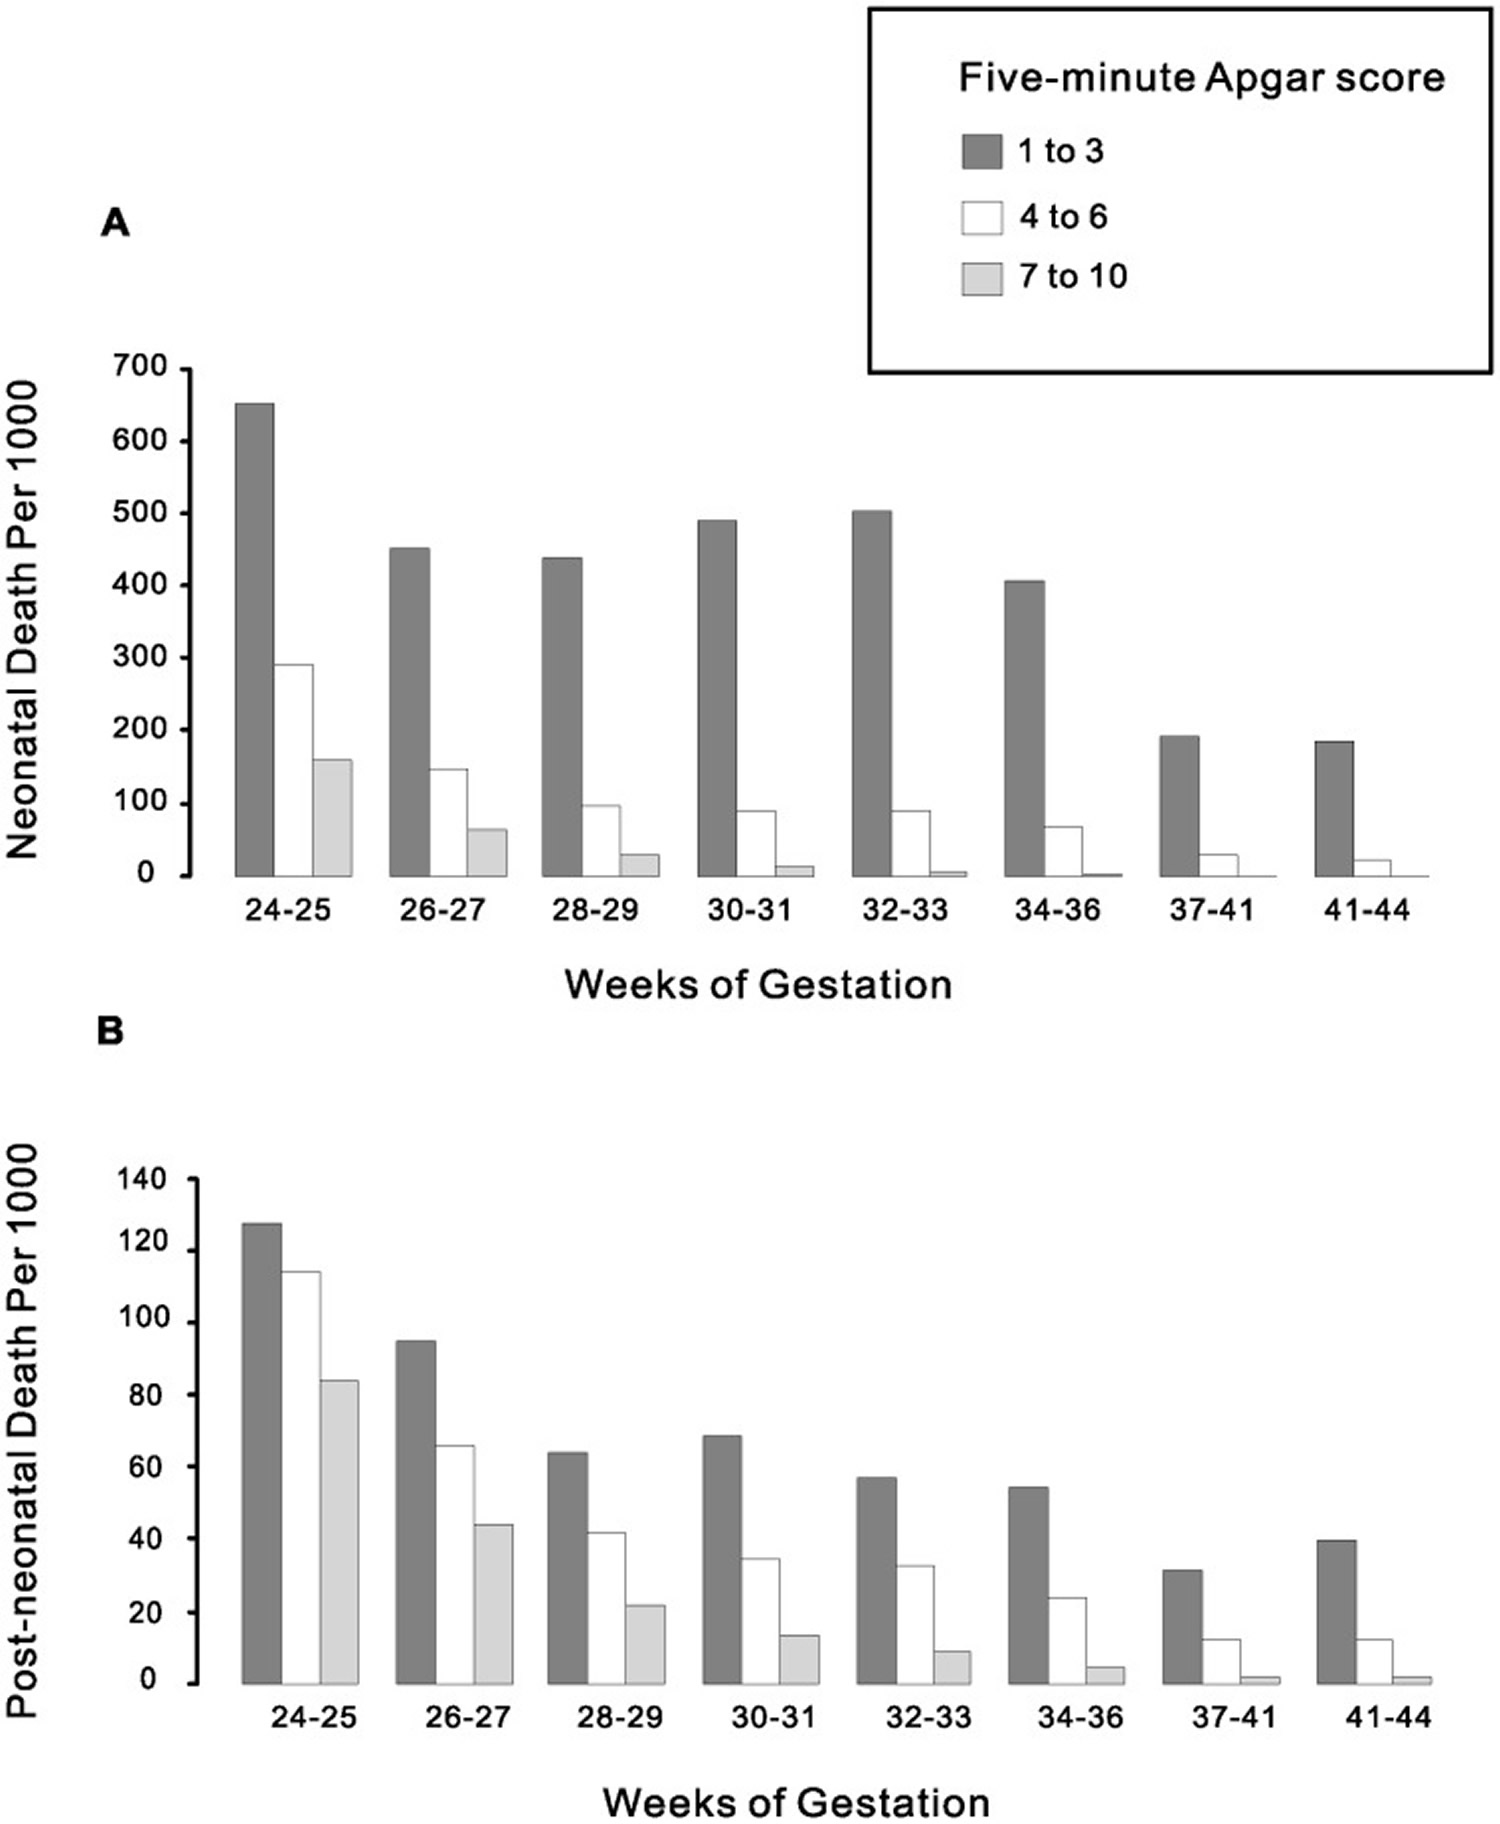
Neonatal and post-neonatal mortality chart by Apgar score and gestational age
Chart 2 presents the neonatal and post-neonatal mortality chart by Apgar score and gestational age. Among births with a very low Apgar score (1–3), the neonatal mortality rate remained high until term (≥37 weeks). On the other hand, among births with a high Apgar score (≥7), neonatal mortality rate decreased progressively with gestational age (Chart 1A). This pattern was also observed for post-neonatal mortality (Chart 2B), indicating that low Apgar score is not closely related to immaturity. The differences in mortality rate by Apgar scores were all statistically significant.
Chart 2. Neonatal and post-neonatal mortality chart by Apgar score and gestational age
Apgar Score and Infant Mortality in Different Race/ethnic Groups
Figure 1 below depicts the survival curve among different Apgar scores in non-Hispanic White and Black separated by preterm (1A) and term (1B) births. For both preterm and term infants, the general trend of relationship was similar. At low Apgar score (1–3), Black had a significantly higher survival rate than White from birth to 1 year. But at higher Apgar scores, Black had a higher survival rate than White in neonatal period but a lower rate in post-neonatal period. This “cross-over” phenomenon was more obvious when we present it in a different way.
Figure 1. Survival curves in preterm (A) and term (B) births for White and Black infants by five-minute Apgar score from birth to 1 year.
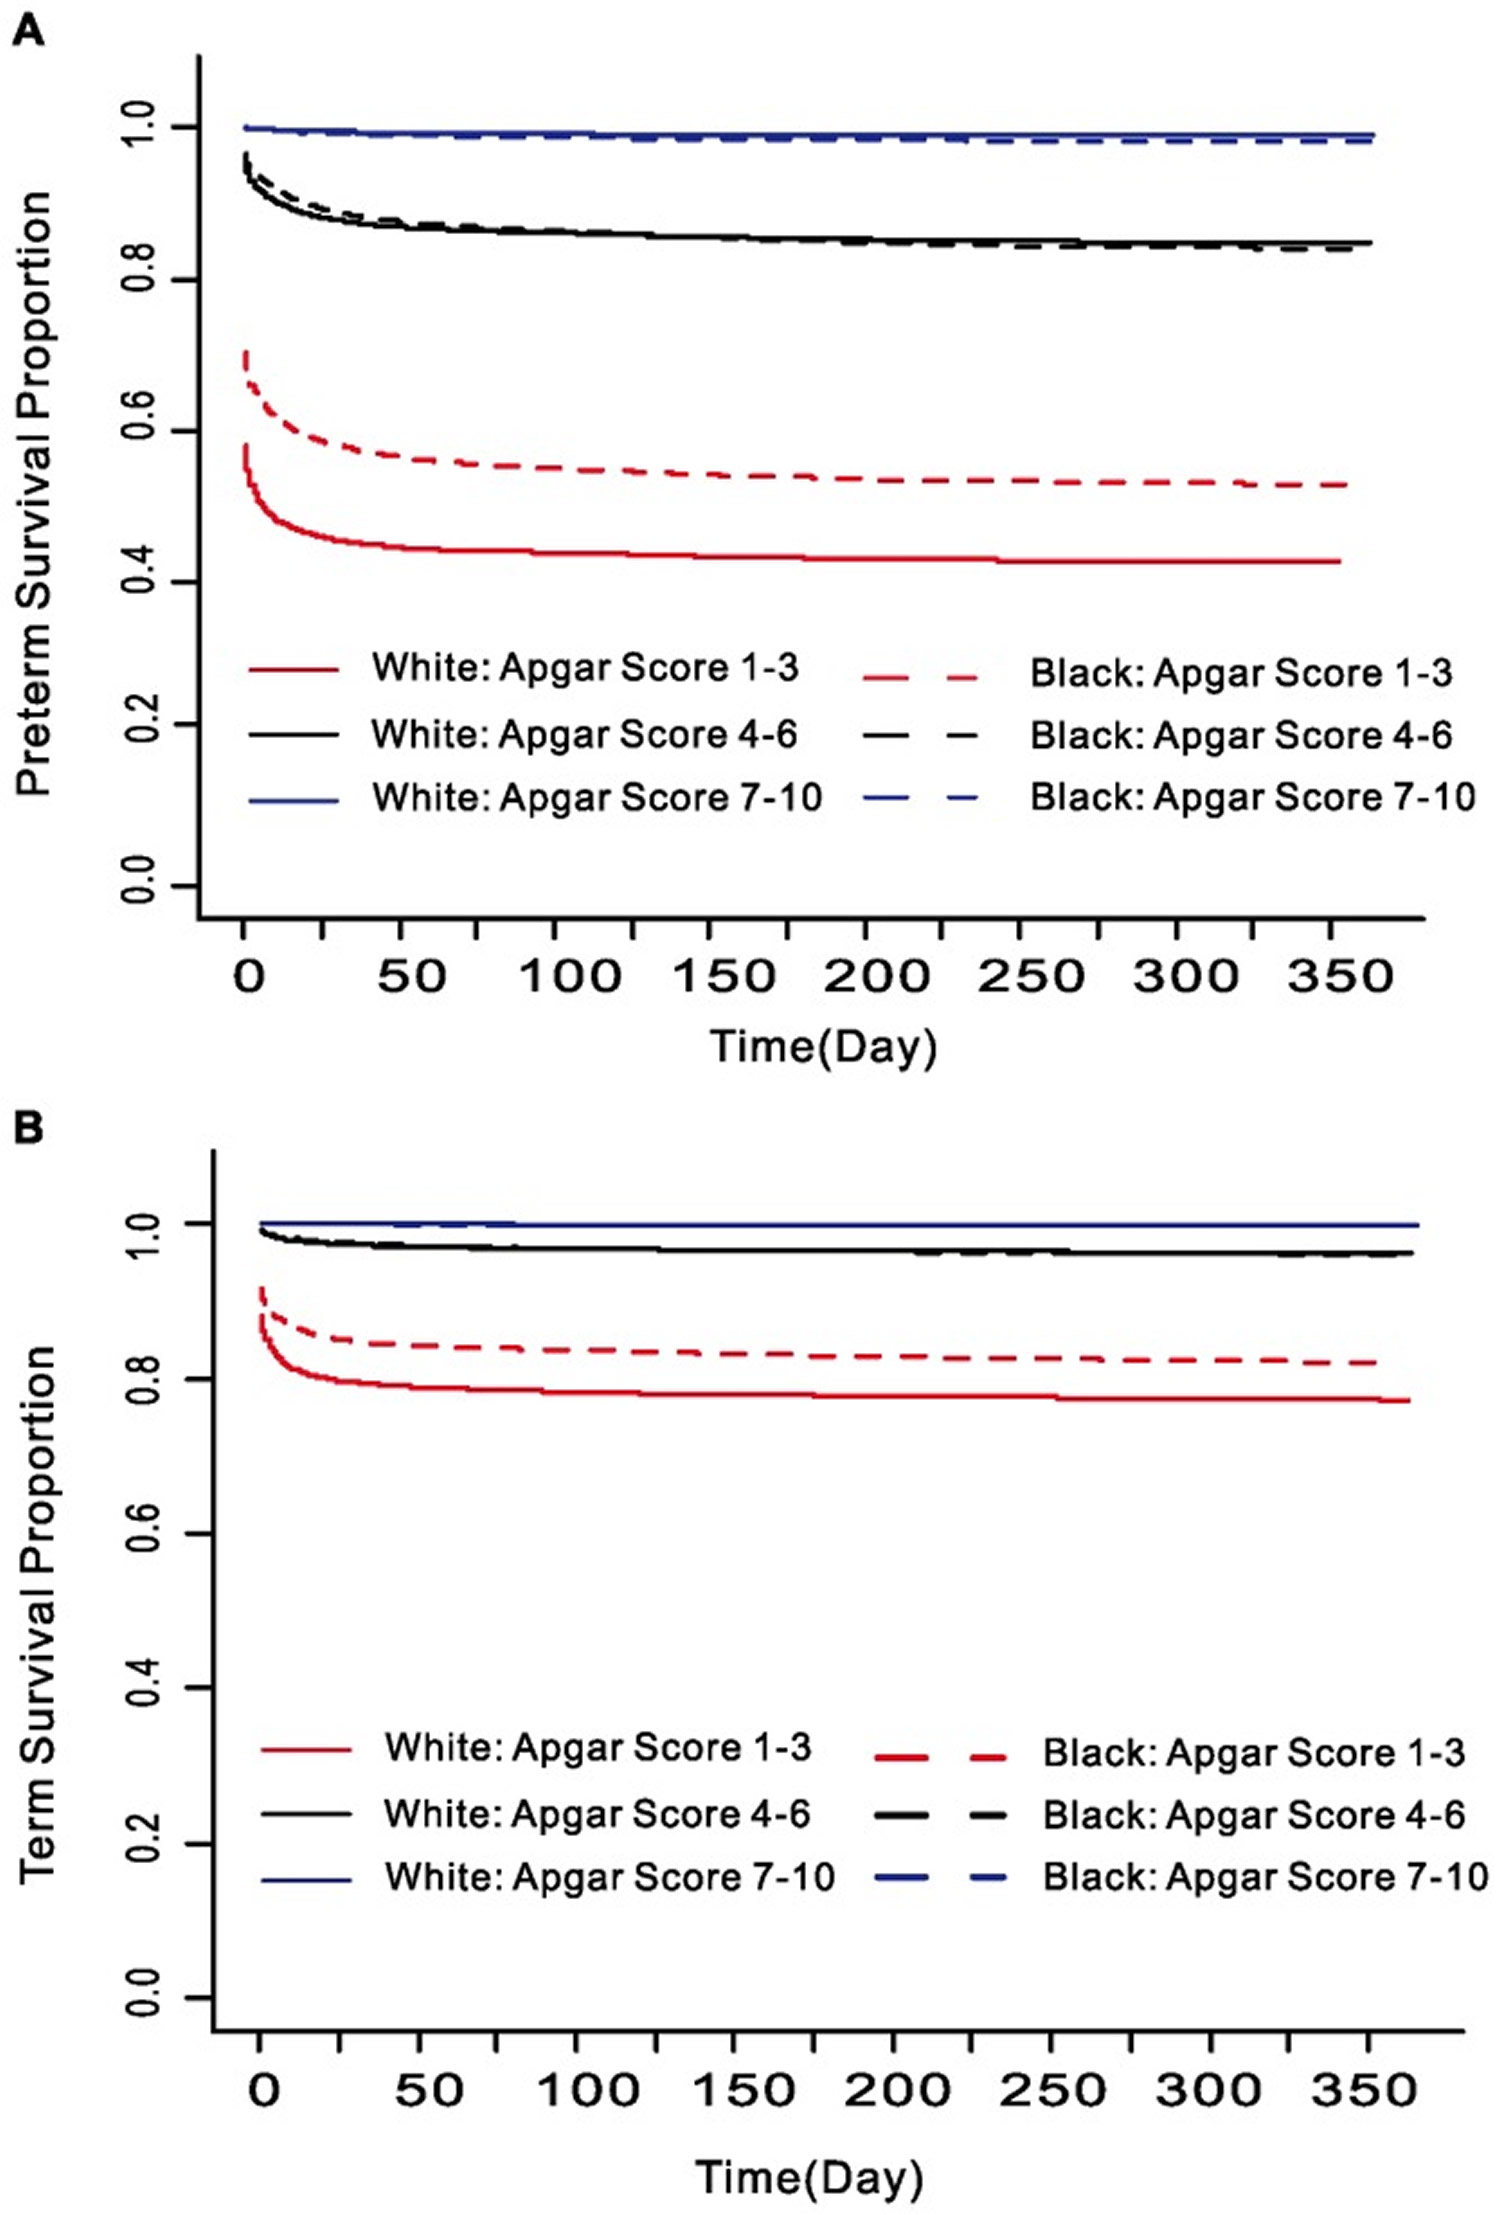
Figure 2 below illustrates how Apgar score performed in non-Hispanic White, non-Hispanic Black and Hispanics separated by preterm (A, B, C) vs term (D, E, F) and by death within 1 day (A, D), 2 to 27 days (B, E) and after 28 days (C, F) postnatal. For both preterm and term births, mortality rate within 1 day dropped precipitously with increasing Apgar score. After Apgar score reached 4 or above, further decrease in mortality rate slowed significantly. This was not the case in neonatal and post-neonatal mortality. The decrease did not slow until the Apgar score reached 7 or higher, suggesting that Apgar score is still a good predictor for neonatal (after 1 day) and post-neonatal death. Furthermore, non-Hispanic White had a consistently higher neonatal mortality than non-Hispanic Black in both preterm and term births. However, for post-neonatal mortality, Black had significantly higher rate than White.
Figure 2. Mortality rates for White, Black and Hispanic infants by five-minute Apgar score at gestational age of 24–36 weeks (A–C) and 37–41 weeks (D–F). (A and D: Time of Infant Death ≤1 Day, B and E: Time of Infant Death between 2 and 27 Days, C and F: Time of Infant Death ≥28 Days).
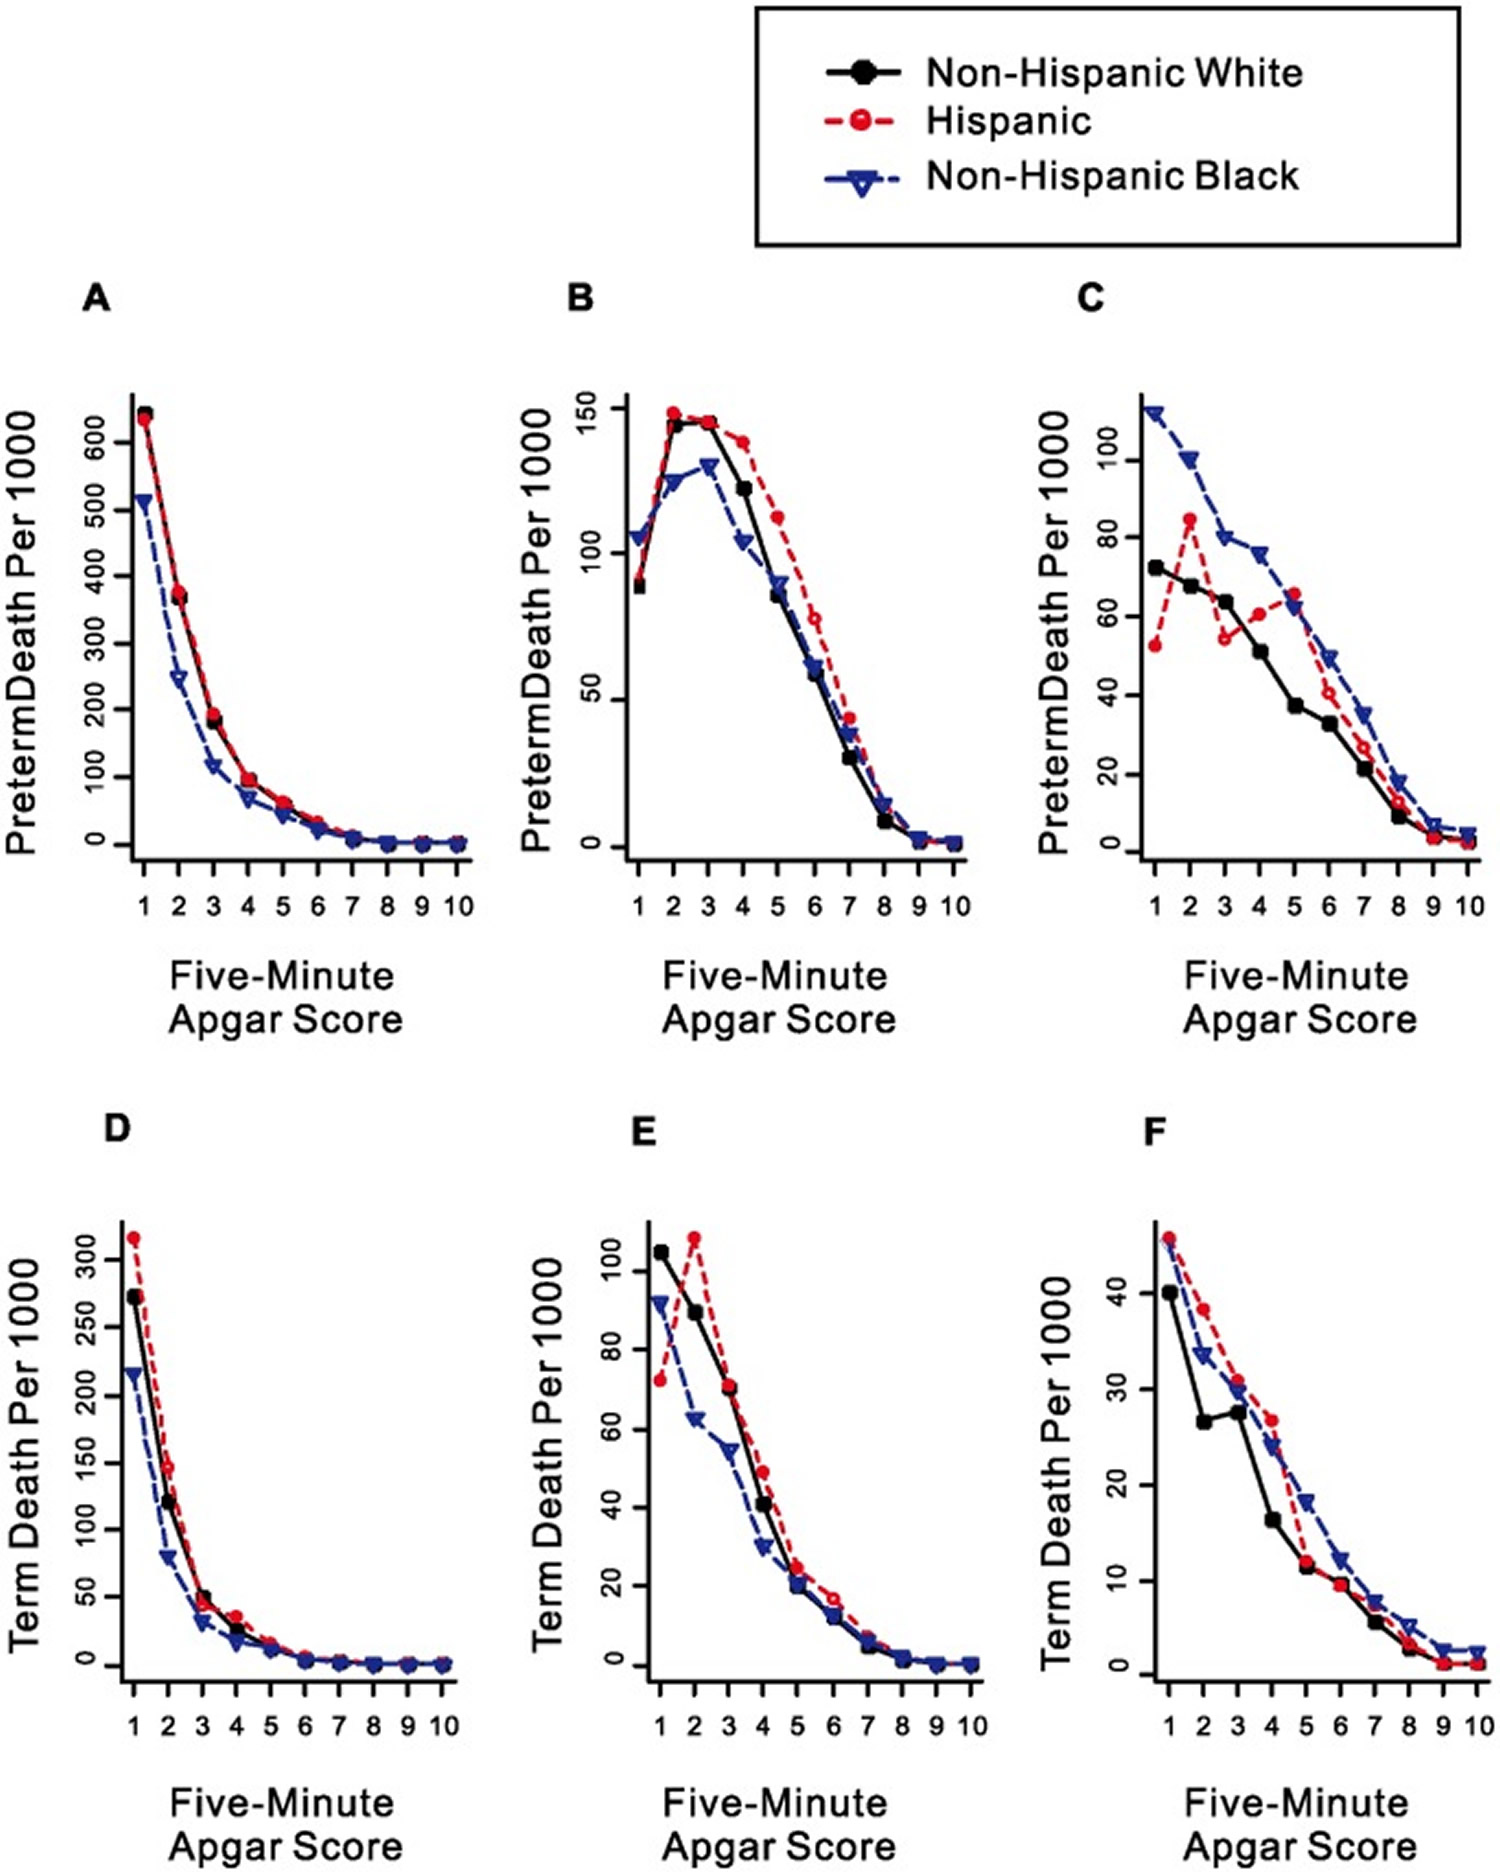
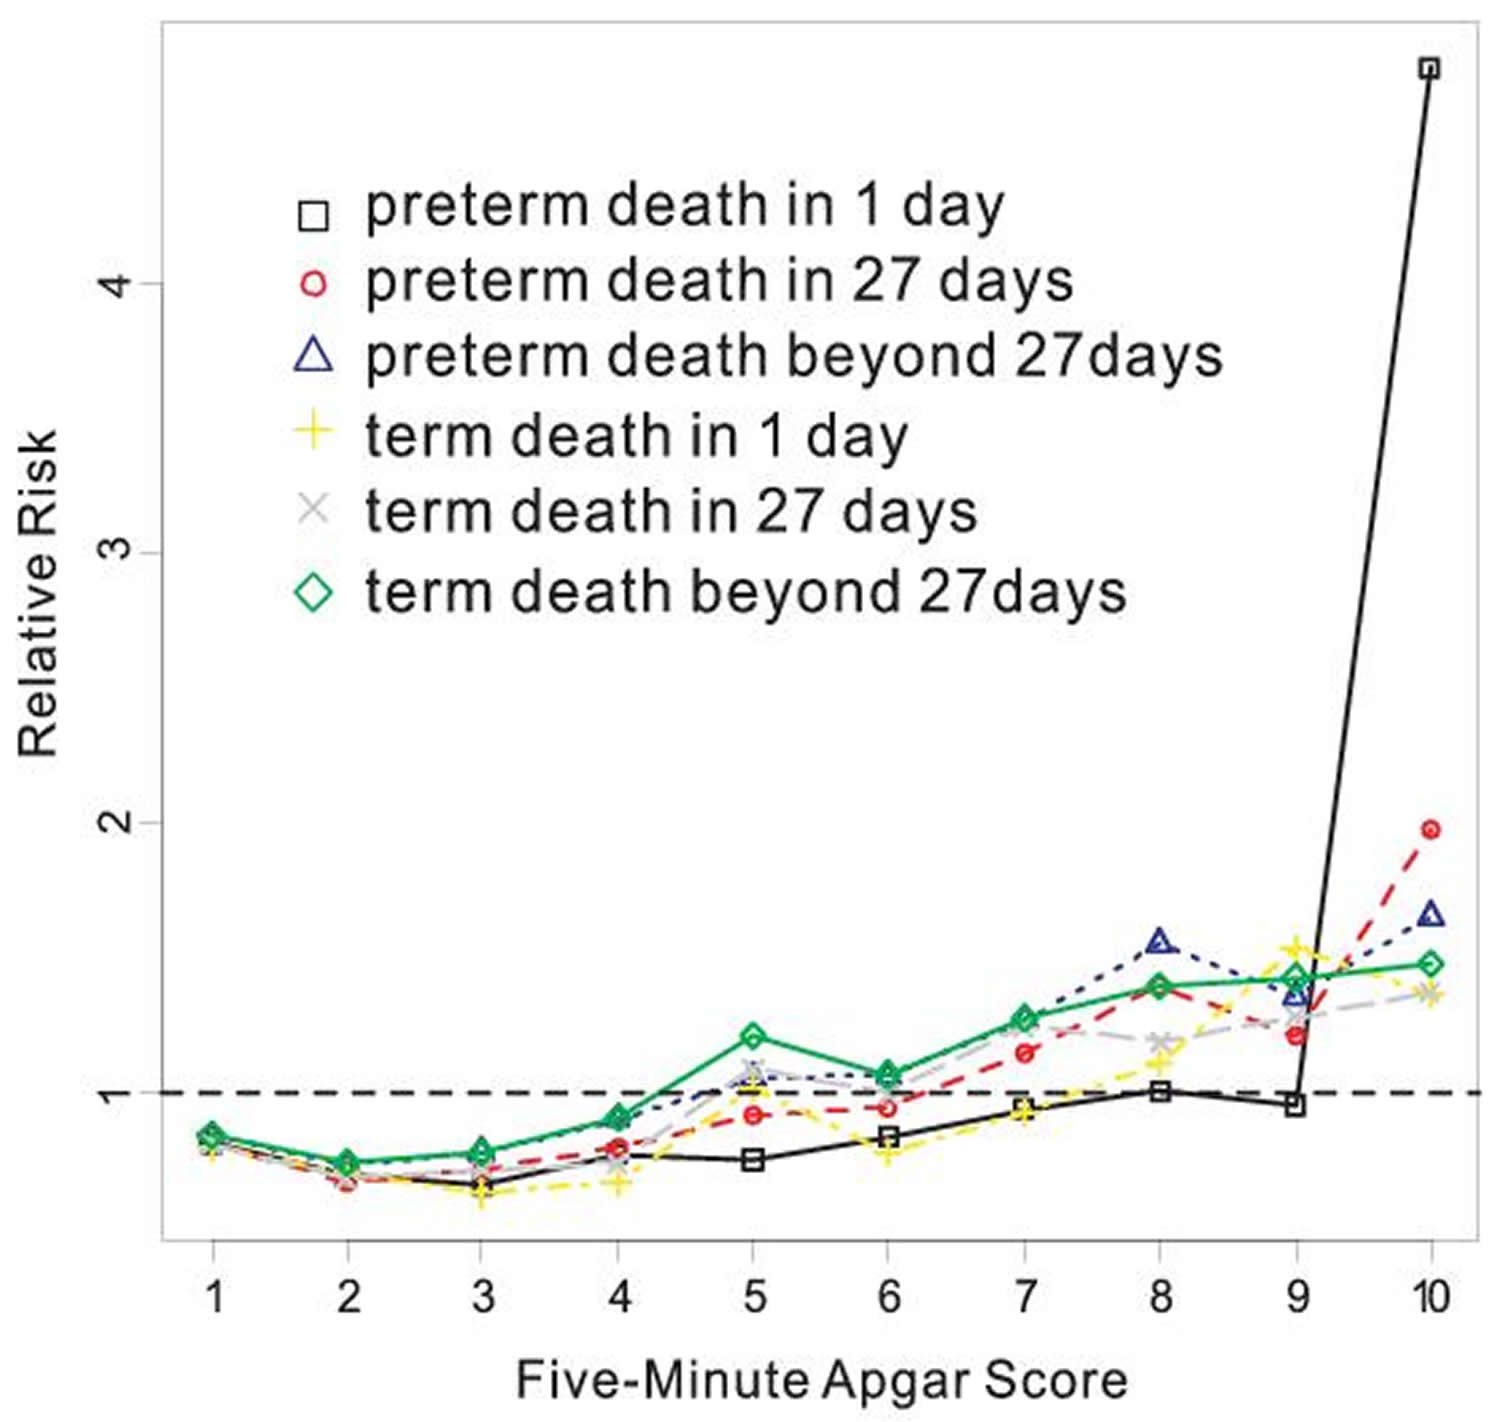
Figure 3. Relative risks of infant death for non-Hispanic Black vs non-Hispanic White by Apgar score at five minutes after adjusting for maternal education, marital status, time when prenatal care started, and maternal smoking during pregnancy.
 [Source 3]
Apgar Score and Twins/Singleton Births Mortality
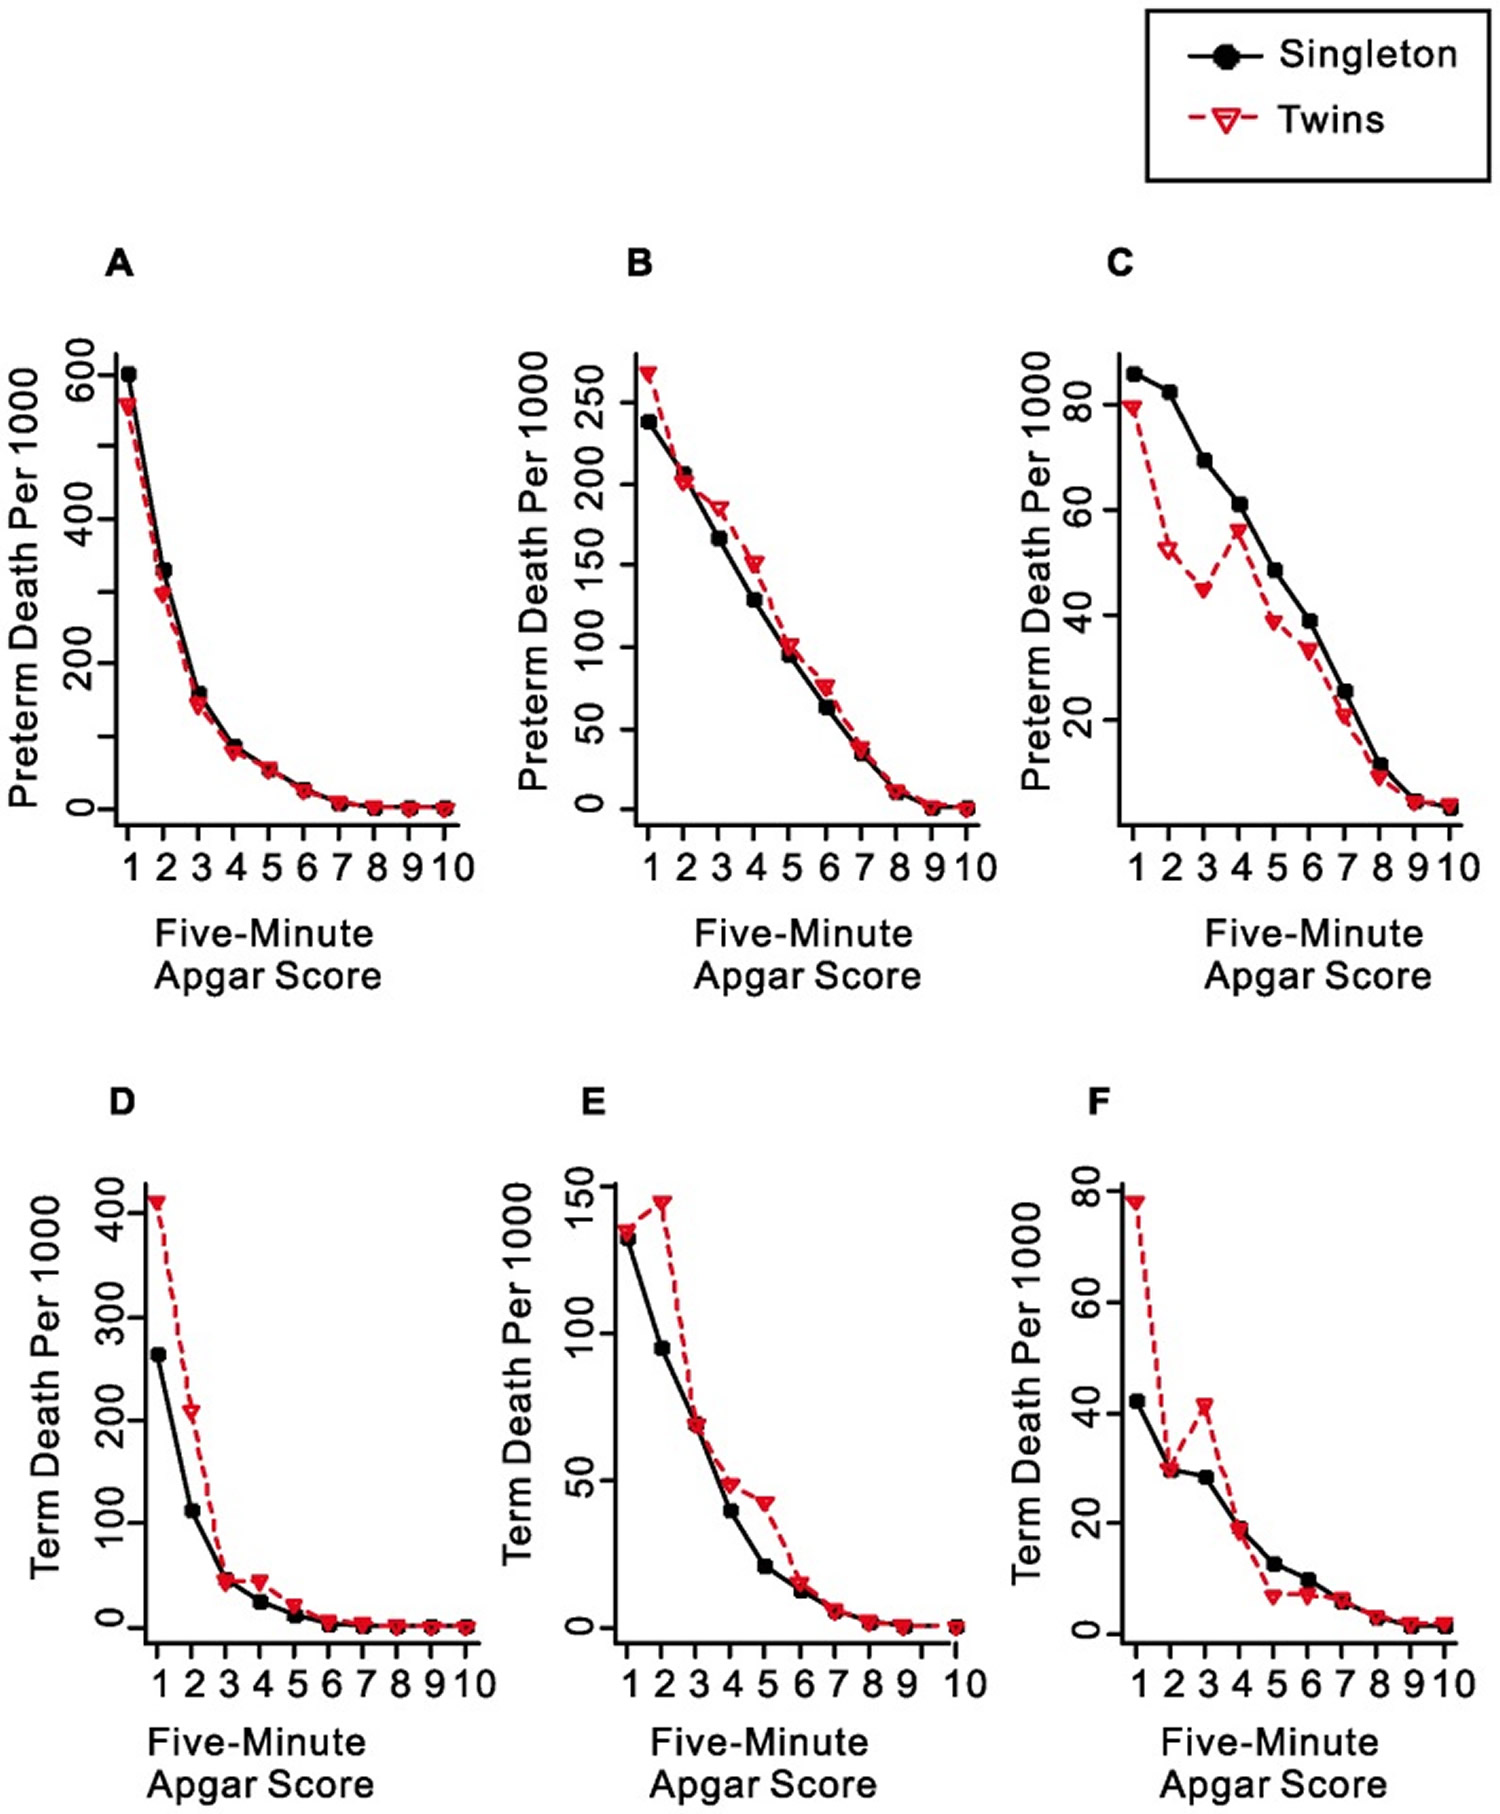
The Apgar score is also as useful in twins as in singleton births. Figure 4 shows that the pattern of change in neonatal and post-neonatal mortality by Apgar score is essentially the same as that in singleton births, indicating that the Apgar score system is equally valid when it is applied to twins.
Figure 4. Mortality rates for singleton births and twins by five-minute Apgar score at gestational age of 24–36 weeks (A–C) and 37–41 weeks (D–F). (A and D: Time of Infant Death≤1 Day, B and E: Time of Infant Death between 2 and 27 Days, C and F: Time of Infant Death ≥28 Days).
- Apgar V (1953) A proposal for a new method of evaluation of the newborn infant. Curr Res Anesth Analg 32: 260–267. https://www.ncbi.nlm.nih.gov/pubmed/13083014
- Apgar V, Holaday DA, James LS, Weisbrot IM, Berrien C (1958) Evaluation of the newborn infant; second report. J Am Med Assoc 168: 1985–1988. https://www.ncbi.nlm.nih.gov/pubmed/13598635
- Li F, Wu T, Lei X, Zhang H, Mao M, Zhang J. The Apgar Score and Infant Mortality. Gong Y, ed. PLoS ONE. 2013;8(7):e69072. doi:10.1371/journal.pone.0069072. https://www.ncbi.nlm.nih.gov/pmc/articles/PMC3726736/
- Mancuso RA, Schetter CD, Rini CM, Roesch SC, Hobel CJ (2004) Maternal prenatal anxiety and corticotropin-releasing hormone associated with timing of delivery. Psychosom Med 66: 762–769. https://www.ncbi.nlm.nih.gov/pubmed/15385704
- Pike IL (2005) Maternal stress and fetal responses: evolutionary perspectives on preterm delivery. Am J Hum Biol 17: 55–65. https://www.ncbi.nlm.nih.gov/pubmed/15611979
- Raikkonen K, Pesonen AK, Kajantie E, Heinonen K, Forsen T, et al. (2007) Length of gestation and depressive symptoms at age 60 years. Br J Psychiatry 190: 469–474. https://www.ncbi.nlm.nih.gov/pubmed/17541105
