
Best Diet for Building Muscle
There are several major diet types interspersed with a multitude of subtypes. This creates a maze of conflicting principles that may be difficult for the general public, athletes and bodybuilders to navigate. Compounding the confusion is the continued propagation of fad diets across a range of media outlets, replete with un-scientific practices. Therefore, it is important to examine the scientific evidence in a systematic way in order to devise recommendations to guide athletes, and bodybuilders regarding all of the above. The purpose of this article is to provide clarity on the effects of various diets on body composition.
A general definition of “diet” is the sum of energy and nutrients obtained from foods and beverages consumed regularly by individuals. Thus, the following dietary archetypes will be assessed: very-low- and low-calorie diets (VLCD and LCD), low-fat diets (LFD), low-carbohydrate diets (LCD), ketogenic diets (KD), high-protein diets (HPD), and intermittent fasting (IF). Diets with qualitative themes or commercial brands will inevitably fall under the umbrella of the classifications above. Therefore, their parent categories rather than ‘named’ or ‘branded’ diets (e.g., Atkins, Ornish, Zone, Paleo, etc.) will receive the majority of scrutiny.
Diets primarily focused on fat loss are driven by a sustained caloric deficit. The higher the baseline body fat level, the more aggressively the caloric deficit may be imposed 1. However, a slower rates of weight loss can better preserve lean mass in leaner subjects. Diets focused primarily on fat mass loss (and weight loss beyond initial reductions in body water) operate under the fundamental mechanism of a sustained caloric deficit. This net hypocaloric balance can either be imposed linearly/daily, or non-linearly over the course of the week. The higher the baseline fat mass level, the more aggressively the caloric deficit may be imposed 2. As you get leaner, slower rates of weight loss can better preserve lean mass, as in Garthe et al.’s example of a weekly reduction of 0.7% of body weight outperforming 1.4% 3. Helms et al. 4 similarly suggested a weekly rate of 0.5–1.0% of body weight for bodybuilders in contest preparation.
Diets primarily focused on fat loss are driven by a sustained caloric deficit. The higher your baseline body fat level, the more aggressively your caloric deficit may be imposed. Slower rates of weight loss can better preserve lean mass (LM) in leaner subjects. Diets focused primarily on accruing lean mass are driven by a sustained caloric surplus to facilitate anabolic processes and support increasing resistance-training demands. The composition and magnitude of the surplus, as well as training status of the bodybuilders can influence the nature of the gains. A wide range of dietary approaches (low-fat to low-carbohydrate/ketogenic, and all points between) can be similarly effective for improving body composition. Increasing your dietary protein to levels significantly beyond current recommendations for athletic populations may result in improved body composition. Higher protein intakes (2.3–3.1 g/kg lean mass) may be required to maximize muscle retention in lean, resistance-trained subjects under hypocaloric conditions. Emerging research on very high protein intakes (>3 g/kg) has demonstrated that the known thermic, satiating, and lean mass-preserving effects of dietary protein might be amplified in resistance-training subjects. The collective body of intermittent caloric restriction research demonstrates no significant advantage over daily caloric restriction for improving body composition. The long-term success of a diet depends upon compliance and suppression or circumvention of mitigating factors such as adaptive thermogenesis. There is a very little of research on women and older populations, as well as a wide range of untapped permutations of feeding frequency and macronutrient distribution at various energetic balances combined with training. Behavioral and lifestyle modification strategies are still poorly researched areas of weight management.
Body composition assessment methods
Body composition assessment is an attempt to simplify a process that is inherently complex. The available measurement methods range from simple to complex with all methods having limitations and some degree of measurement error. As such, there are several methods that attempt to accurately estimate lean mass (LM) and fat mass (FM), and their subcomponents. Before outlining the most common methods used in sports science and medicine, it should be noted that there is a continuum of the components measured or estimated. Over 25 years ago, Wang et al. 5 proposed a five-level model for organizing body composition research 6. Each level has different components, eventually deemed compartments, and have undergone further organization to include two (2C), three (3C) and four (4C) compartments 6:
- Atomic level: hydrogen, oxygen, nitrogen, carbon, sodium, potassium, chloride, phosphorus, calcium, magnesium, sulfur.
- Molecular level: The 4C model includes FM, total body water (TBW), total body protein, and bone mineral content. The 3C model includes FM, TBW, and nonfat solids. An alternate 3C model includes FM, bone mineral, and residual mass. The 2C model includes FM and FFM.
- Cellular level: The 3C model includes cells, extracellular fluids, and extracellular solids. The 4C model includes body cell mass, FM, extracellular fluids, and extracellular solids.
- Tissue-organ level: adipose tissue, skeletal muscle, bone, visceral organs, other tissues.
- Whole body level: head, trunk, and appendages.
Table 1. Representative multicomponent models at the five-body composition levels
| Level | Body composition model | Number of components |
|---|---|---|
| Atomic | BM = H + O + N + C + Na + K + Cl + P + Ca + Mg + S | 11 |
| Molecular | BM = FM + TBW + TBPro + Mo + Ms + CHO | 6 |
| BM = FM + TBW + TBPro + M | 4 | |
| BM = FM + TBW + nonfat solids | 3 | |
| BM = FM + Mo + residual | 3 | |
| BM = FM + FFM | 2 | |
| Cellular | BM = cells + ECF + ECS | 3 |
| BM = FM + BCM + ECF + ECS | 4 | |
| Tissue-organ | BW = AT + SM + bone + visceral organs + other tissues | 5 |
| Whole body | BW = head + trunk + appendages | 3 |
Note: AT, adipose tissue; BCM, body cell mass; BM, body mass; CHO, carbohydrates; ECF, extracellular fluid; ECS, extracellular solids; FFM, fat-free mass; FM, fat mass; M, mineral; Mo, bone mineral; Ms, soft-tissue mineral; SM, skeletal muscle; TBPro, total body protein; TBW, total body water.
The 4C model has the greatest degree of sensitivity to interindividual variability of lean mass composition. The 4C model involves the measurement of body mass or weight, total body volume, total body water (TBW), and bone mineral; Its comprehensiveness and accuracy have rendered its reputation as the “gold standard” to which all other models are compared. However, specialized laboratory equipment is required minimizing the availability of the 4C method to many clinicians and researchers. The 2C model estimates fat mass and lean mass, and operates under the assumption that water, protein, and mineral content of lean mass are constant. Thus, the 2C model is the most commonly used approach for adults. Due to their relatively low cost, non-invasiveness, and ease of operation, 2C model-based methods are common in clinical practice and sports/fitness settings. Examples of methods based on the 2C model include hydrodensitometry (underwater weighing), air displacement plethysmography (ADP or BOD POD®), skinfold thickness, and bioelectrical impedance analysis (BIA). Dual energy X-ray absorptiometry (DXA) is based on a 3C model that measures bone mineral content, lean mass (LM), and fat mass (FM), but it is still subject to confounding from inter-assessment differences in hydration, glycogen, and muscle creatine levels, which can be significant in athletic populations with distinct exercise and recovery cycles 8, 9.
The various methods are often classified in the literature as either laboratory methods (e.g., DXA, ADP) or field methods (e.g., skinfolds, ultrasound, BIA, BIS) depending on their respective use in research and clinical settings as well as their portability. An excellent review by Wagner and Hayward 10 concludes the following: “There is no single method which is ‘best;’ rather, the clinician or researcher must weigh the practical considerations of their assessment needs with the limitations of the methods.” Table 2 outlines the characteristics of selected body composition assessment methods.
Table 2. Body composition measurement methods
| Method | Components measured/estimated | Strengths | Limitations |
|---|---|---|---|
| Skinfold thickness | Subcutaneous fat thickness in specific sites of the body | Reliable method for assessing regional fatness. Useful for monitoring fat changes in children due to their small body size, and their fat stores are primarily subcutaneous, even in obese children (though increasing degrees of obesity lower the viability of this method). | Most skinfold calipers have an upper limit of 45–60 mm, limiting their use to moderately overweight or thin subjects. Measurement reliability depends on the skill and experience level of the technician, which varies, and type/brand of caliper used. The best use of this method is the monitoring of raw values, rather than assuming an accurate representation of body composition. |
| Bioelectrical impedance analysis (BIA) and bioelectrical impedance spectroscopy (BIS) | Total body water (TBW), which is converted to FFM via the assumption that 73% of the body’s FFM is water | Economical, safe, quick, minimal participant participation and technician expertise. Capable of determining body composition of groups and monitoring changes within individuals over time. BIS or multi-frequency BIA, is capable of delineating TBW into intracellular water (ICW) and extracellular water (ECW), which allows for an estimation of body cell mass. | Validity of BIA and BIS is population-specific; it’s influenced by sex, age, height, disease state, and race. BIA/BIS underestimates FFM in normal-weight individuals and overestimates FFM in obese individuals compared to DXA. Validity of single-frequency BIA and multifrequency BIA may be limited to healthy, young, euhydrated adults. |
| Hydrodensitometry (also called hydrostatic weighing or underwater weighing) | Body weight on land and weight in water, body volume, body density, and residual lung volume | Good test-retest reliability, accurate in determining body density, lengthy history and track record of consistent use in sports and clinical settings. | Relies upon subject performance (completely exhaled, submerged). Errors in measurement of residual lung volume can confound the assessment of body composition. The density of FFM is an assumed constant but can vary with age, sex, race, and training status. |
| Air displacement plethysmography (ADP) | Total body volume, and total body fat (FFM and FM) | High reliability for body fat percentage, body density, and residual lung volume in adults. Non-invasive, quick, no radiation exposure or subject performance demands. Same-day test-retest reliability has been reported to be slightly better than hydrodensitometry | Tends to over-estimate fat mass compared to DXA and the 4C model. Disease states can reduce accuracy. Inconsistency of clothing and facial/body hair and exercise prior to testing can alter repeatability. Expensive apparatus. |
| Dual energy X-ray absorptiometry (DXA) | Total and regional body fat, LM, bone mineral density | High accuracy and reproducibility for all age groups. Non-invasive, quick, no subject performance needed. Measurements are not confounded by disease states or growth disorders. Gold standard for diagnosing osteopenia and osteoporosis. | Small amount of radiation exposure. Fat mass estimates are confounded by trunk thickness (error increases alongside degree of trunk thickness). Compared to 4C, DXA may be unreliable for longitudinal studies of subjects who undergo major changes in glycogen or hydration status between measurements. Expensive apparatus. |
| Ultrasound | Tissue layer thickness (skin, adipose, muscle) | Highly repeatable, readily available, widely used, portable, quick. Noninvasive and no ionizing radiation. Accurate and precise estimates of fat thickness in multiple sites of the body, capable of measuring the thickness of muscle and bone. | Requires a skilled, experienced technician. Measurement procedures and techniques are not yet standardized. Inherent confounders such as fascia can complicate the interpretation of results. Higher cost than field methods. |
| Magnetic resonance imaging (MRI) and computed tomography | Total and regional fat (including subcutaneous and visceral), skeletal muscle, organs and other internal tissues, lipid content in muscle and liver | High accuracy and reproducibility. MRI does not involve exposure to radiation. | Expensive, lengthy procedure. Limited to accommodating normal to moderately overweight individuals, but not very large body sizes do not fit in the field of view. High radiation exposure with computed tomography. |
| Near-infrared interactance (NIR) | Fat, protein, and water – based on assumptions of optical density | Good test-retest and day-to-day reliability. Quick, non-invasive. | Large standard errors of estimation (SEE > 3.5% BF). Percent body fat is systematically underestimated, and this error increases alongside larger body frames. |
Muscle Building Diets Review
Low-Calorie Diets
Low-calorie diets (LCD) and very-low-calorie diets (VLCD) are characterized by their provision of 800–1200 kcal/day and 400–800 kcal/day, respectively 11. Note that Low-calorie diets (LCD) have also been given a more liberal definition of providing 800–1800 kcal 12. Very-low-calorie diets (VLCD) are typically in liquid form and commercially prepared. The aim of the diet is to induce rapid weight loss (1.0–2.5 kg/week) while preserving as much lean mass as possible. Very-low-calorie diets (VLCD) are designed to replace all regular food consumption, and therefore should not be confused with meal replacement products intended to replace one or two meals per day. As such, very-low-calorie diets (VLCD) are fortified with the full spectrum of essential micronutrients. The macronutrient content of very-low-calorie diets (VLCD) is approximately protein 70–100 g/day, fat 15 g/day and carbohydrate 30–80 g/day. A protein-sparing modified fast can be considered the higher-protein variant of a VLCD, with protein intakes of approximately 1.2–1.5 g/kg/d 13. However, even at protein intakes as low as 50 g/day, the proportion of lean mass loss from VLCD has been reported to be 25% of total weight loss, with 75% as fat loss 14.
Resistance training has shown an impressive ability to augment the preservation of muscle and even increase it during VLCD – at least in untrained/obese subjects. A 12-week trial by Bryner et al. 15 found that resistance training while consuming 800 kcal resulted in the preservation of lean mass in untrained obese subjects. There was actually a slight gain, but it did not reach statistical significance. Resting metabolic rate (RMR) significantly increased in the training group, but it decreased in the control group. Donnelly et al. 16 reported a significant increase in cross-sectional area of both slow- and fast-twitch muscle fibers in untrained obese subjects after 12 weeks on an 800 kcal diet with resistance training. While these results cannot necessarily be extrapolated to lean, trained subjects, they are nevertheless intriguing.
In obese populations, aggressive caloric restriction is a potentially powerful intervention since a greater initial weight loss is associated with greater long-term success in weight loss maintenance 2. However, a meta-analysis by Tsai and Wadden 12 found that VLCD did not result in greater long-term (1 year or more) weight loss than LCD. Eight to 12 week VLCD are common in clinical practice before transitioning to less severe caloric restriction; however, there is an ongoing debate regarding the duration that can be safely sustained for VLCD. Multiple deaths have been reported due to low-quality protein intake, excessive loss of lean mass, and inadequate medical supervision 17. Adverse effects of VLCD include cold intolerance, fatigue, headache, dizziness, muscle cramps, and constipation. Hair loss was reported to be the most common complaint of extended VLCD use 12. It should be noted that VLCD use has limited relevance to healthy and athletic populations.
Low-Fat diets
Low-fat diets (LFD) have been defined as providing 20–35% fat 18. This is based on the Acceptable Macronutrient Distribution Ranges (AMDR) for adults, set by the Food and Nutrition Board of the Institute of Medicine 19. The AMDR set protein at 10–35%, carbohydrate at 45–65%, and fat at 20–35% of total energy. Although the classification of low-fat diets (LFD) is based on the AMDR, it might be more accurate to call them high-carbohydrate diets, given the dominance of this macronutrient in the ranges. As such, the definition of low-fat diets (LFD) is inherently subjective.
Scientists and physicians have promoted decreased fat intake since the 1950s 20. The 1977 publication of the Dietary Goals for the United States, and the 1980 publication of the inaugural Dietary Guidelines for Americans (DGA) reinforced a reduction in total fat intake with the aim of improving public health 21. Although the AMDR were published in 2005, their staying power is apparent since the recently updated Dietary Guidelines for Americans adheres to these ranges 22, as do major health organizations such as the American Heart Association, American Diabetes Association and Academy of Nutrition and Dietetics.
A recent systematic review by Hooper et al. 23 analyzed 32 randomized controlled trials (RCTs) containing ~54,000 subjects, with a minimum duration of 6 months. Reducing the proportion of dietary fat compared to usual intake modestly but consistently reduced body weight, body fat, and waist circumference. Excluded from the analysis were RCTs where subjects in either the control or experimental groups had the intention to reduce weight. The implication of these findings is that reducing the proportion of dietary fat can cause a de facto reduction of total energy intake, thereby reducing body fat over time.
The premise of dietary fat reduction for weight loss is to target the most energy-dense macronutrient to impose hypocaloric conditions. Tightly controlled experiments have covertly manipulated the fat content of diets similar in appearance and palatability, and the higher energy density of the higher-fat diets resulted in greater weight gain and/or less weight loss 24, 25. However, over the long-term, diets with lower energy density have not consistently yielded greater weight loss than energy restriction alone 26, 27. Reasons for the disparity between short- and long-term effects of energy density reduction include speculation that learned compensation is occurring. In addition, postprandial factors may increase sensory-specific satiety that over time can reduce the initial palatability of energy-dense foods 28.
Very-low-fat diets (VLFD) have been defined as providing 10–20% fat 18. Diets fitting this profile have a limited amount of research. The body of controlled intervention data on VLFD mainly consists of trials examining the health effects of vegetarian and vegan diets that aggressively minimize fat intake. These diets have shown consistently positive effects on weight loss 29, but this literature lacks body composition data. Among the few studies that did, the A TO Z Weight Loss Study by Gardner et al. 30, did not show any significant between-group differences in body fat reduction among the diets (Atkins, Zone, LEARN, and Ornish). However, despite the Ornish group’s assigned fat intake of ≤10% of total calories, actual intake progressed from 21.1 to 29.8% by the end of the 12-month trial. Similar results were seen by de Souza et al. 31 in the POUNDS LOST trial. Four groups were assigned high-protein (25%) and average-protein (15%) versions of high-fat (40%) and low-fat (20%) diets. No significant between-group differences were seen in the loss of total abdominal, subcutaneous, or visceral fat at either six months or two years. A mean loss of 2.1 kg lean mass and 4.2 kg fat mass occurred in both groups at 6 months. No lean mass-retentive advantage was seen in the higher-protein diets, but this could have been due to both protein intake levels being sub-optimal (1.1 and 0.7 g/kg). As seen in previous low fat diet research, the targeted restriction to 20% fat was apparently difficult to attain since actual intakes ranged 26–28%.
Low-Carbohydrate diets
Similar to low fat diets, low-carbohydrate diets (LCD) are a broad category lacking an objective definition. There is no universal agreement on what quantitatively characterizes an low-carbohydrate diets (LCD). The Dietary Guidelines for Americans lists 45–65% of total energy as the appropriate carbohydrate intake for adults 32. Therefore, diets with intakes below 45% fall short of the ‘official’ guidelines and can be viewed as LCD. However, other published definitions of low-carbohydrate diets (LCD) disregard the limits set in the Dietary Guidelines for Americans. Low-carbohydrate diets (LCD) have been defined as having an upper limit of 40% of total energy from carbohydrate 33, 34. In absolute rather than proportional terms, LCD have been defined as having less than 200 g of carbohydrate 33. Some investigators have taken issue with this liberal definition of LCD, preferring to delineate non-ketogenic LCD as containing 50–150 g, and ketogenic diet as having a maximum of 50 g 35.
Meta-analyses comparing the effects of low fat diets with low-carbohydrate diets have yielded mixed results across a wide range of parameters. Liberal operational definitions of low-carbohydrate diets (e.g., ≤45%) have led to a lack of significant differences in body weight and waist circumference 36, while lower carbohydrate classification thresholds (<20%) have favored low-carbohydrate diets for weight loss and other cardiovascular risk factors 37. Recently, Hashimoto et al. 38 conducted the first-ever meta-analysis on the effect of low-carbohydrate diets on fat mass (FM) and body weight. The analysis, limited to trials involving overweight/obese subjects, had a total of 1416 subjects, stratifying the diets as “mild low-carbohydrate diets” (~40% carbohydrate) or “very low-carbohydrate diets” (~50 g carbohydrate or 10% of total energy). Eight randomised clinical trials (RCTs) included a very low-carbohydrate diets treatment, and 7 RCTs included a mild low-carbohydrate diets treatment. With all groups considered, fat mass decrease was significantly greater in the low-carbohydrate diets than the control diets. However, sub-analysis showed that fat mass decrease in very low-carbohydrate diets was greater than the controls, while the difference in fat mass decrease between mild low-carbohydrate diets and controls was not significant. A separate sub-analysis of short- versus long-term effects found that both types of low-carbohydrate diets yielded significantly greater fat loss than controls in trials less than, as well as longer than 12 months. A further sub-analysis of found that BIA failed to detect significant between-group differences in fat mass reduction, while DXA showed significantly greater decreases in low-carbohydrate diets than controls. It should be noted that despite reaching statistical significance, mean differences in fat mass reduction between low-carbohydrate diets and control groups were small (range = 0.57–1.46 kg). Practical relevance is questionable given the obese nature of the subjects. The authors speculated that the advantage of the low-carbohydrate diets over the control diets could have been due to their higher protein content.
Ketogenic diets
Despite being a subtype of low-carbohydrate diets, the ketogenic diet (KD) deserves a separate discussion. Whereas non-ketogenic low-carbohydrate diets is subjectively defined, ketogenic diet (KD) is objectively defined by its ability to elevate circulating ketone bodies measurably – a state called ketosis, also known as physiological or nutritional ketosis. Aside from completely fasting, this condition is attained by restricting carbohydrate to a maximum of ~50 g or ~10% of total energy 35, while keeping protein moderate (1.2–1.5 g/kg/day) 39, with the remaining predominance of energy intake from fat (~60–80% or more, depending on degree protein and carbohydrate displacement). Ketosis is a relatively benign state not to be confused with ketoacidosis, which is a pathological state seen in type 1 diabetics, where a dangerous overproduction of ketones occurs in the absence of exogenous insulin. The primary ketone produced hepatically is acetoacetate, and the primary circulating ketone is β-hydroxybutyrate 40. Under normal, non-dieting conditions, circulating ketone levels are low (<3 mmol/l). Depending on the degree of restriction of carbohydrate or total energy, ketogenic diet (KD) can raise circulating ketone levels to a range of ~0.5–3 mmol/l, with physiological ketosis levels reaching a maximum of 7–8 mmol/l 39.
The proposed fat loss advantage of carbohydrate reduction beyond a mere reduction in total energy is based largely on insulin-mediated inhibition of lipolysis and presumably enhanced fat oxidation. However, a single-arm study by Hall et al. 41 examined the effect of 4 weeks on a low fat diet (300 g carbohydrate) followed by 4 weeks on a ketogenic diet (KD) (31 g carbohydrate). Blood ketone levels plateaued at ~1.5 mmol/l within two weeks into the ketogenic diet (KD). A transient increase in energy expenditure (~100 kcal/day) lasting a little over a week occurred upon switching to the ketogenic diet (KD). This was accompanied by a transient increase in nitrogen loss, potentially suggesting a stress response including the ramping up of gluconeogenesis. Although insulin levels dropped rapidly and substantially during the ketogenic diet (KD) (consisting of 80% fat, 5% carbohydrate), an actual slowing of body fat loss was seen during the first half of the ketogenic diet (KD) phase.
It has been postulated that the production and utilization of ketone bodies impart a unique metabolic state that, in theory, should outperform non-ketogenic conditions for the goal of fat loss 35. However, this claim is largely based on research involving higher protein intakes in the low-carbohydrate diets/ketogenic diet groups. Even small differences in protein can result in significant advantages to the higher intake. A meta-analysis by Clifton et al. 42 found that a 5% or greater protein intake difference between diets at 12 months was associated with a threefold greater effect size for fat loss. Soenen et al. 43 systematically demonstrated that the higher protein content of low-carbohydrate diets, rather than their lower carbohydrate content, was the crucial factor in promoting greater weight loss during controlled hypocaloric conditions. This is not too surprising, considering that protein is known to be the most satiating macronutrient 44. A prime example of protein’s satiating effect is a study by Weigle et al. 45 showing that in ad libitum conditions, increasing protein intake from 15 to 30% of total energy resulted in a spontaneous drop in energy intake by 441 kcal/day. This led to a body weight decrease of 4.9 kg in 12 weeks.
With scant exception 46, all controlled interventions to date that matched protein and energy intake between ketogenic diet (KD) and non-ketogenic diet conditions have failed to show a fat loss advantage of the ketogenic diet (KD) 47, 48, 49. A recent review by Hall 50 states, “There has never been an inpatient controlled feeding study testing the effects of isocaloric diets with equal protein that has reported significantly increased energy expenditure or greater loss of body fat with lower carbohydrate diets.” In light of this and the previously discussed research, the ‘special effects’ of low-carbohydrate diets and ketogenic diets are not due to their alleged metabolic advantage, but their higher protein content. Perhaps the strongest evidence against the alleged metabolic advantage of carbohydrate restriction is a recent pair of meta-analyses by Hall and Guo 49, which included only isocaloric, protein-matched controlled feeding studies where all food intake was provided to the subjects (as opposed to self-selected and self-reported intake). A total of 32 studies were included in the analysis. Carbohydrate ranged from 1 to 83% and dietary fat ranged from 4 to 84% of total energy. No thermic or fat loss advantage was seen in the lower-carbohydrate conditions. In fact, the opposite was revealed. Both energy expenditure (EE) and fat loss were slightly greater in the higher-CHO/lower-fat conditions (EE by 26 kcal/day, fat loss by 16 g/d); however, the authors conceded that these differences were too small to be considered practically meaningful 49.
If there is any advantage to ketogenic diet (KD) over non-KD for fat loss, it is potentially in the realm of appetite regulation. Under non-calorically restricted conditions, ketogenic diet (KD) has consistently resulted in body fat and/or body weight reduction 51, 52. This occurs via spontaneous energy intake reduction, which could be due to increased satiety through a suppression of ghrelin production 53. Moreover, ketogenic diet has demonstrated hunger-suppressive effects independent of protein content. In a 4-week crossover design, Johnstone et al. 54 found that a ketogenic diet consumed ad libitum (without purposeful caloric restriction) resulted in an energy intake reduction of 294 kcal/day. The latter results were seen despite a relatively high protein intake (30% of energy) matched between ketogenic diet (4% CHO) and non-KD (35% CHO) conditions. In further support of this idea, a meta-analysis by Gibson et al. 55 found that ketogenic diet suppresses appetite more than VLCD. However, it remains unclear whether the appetite suppression is due to ketosis or other factors such as an increased protein or fat intake, or restriction of carbohydrate.
An area of growing interest is the effect of ketogenic diet on athletic performance. Since training capacity has the potential to affect body composition, the effect of ketogenic diet on exercise performance warrants discussion. Carbohydrate restriction combined with high fat intake to become fat-adapted (or ketoadapted) is a tactic that attempts to improve performance by increasing the body’s reliance on fat as fuel, thereby sparing/decreasing glycogen use, which ostensibly could improve athletic performance. However, in contrast to the proposed benefits of fat-adaptation on performance, Havemann et al. 56 found that 7 days of a high-fat diet (68%) followed by 1 day of high-carbohydrate diet (90%) expectedly increased fat oxidation, but decreased 1-km sprint power output in well-trained cyclists. Stellingwerff et al. 57 compared substrate utilization, glycogenolysis, and enzymatic activity from either 5 days of a high-fat diet (67%) or high-carbohydrate (70%) followed by one day of high-carbohydrate with no training, followed by experimental trials on the seventh day. The high-fat diet increased fat oxidation, but also lowered pyruvate dehydrogenase activity and decreased glycogenolysis. These results provide a mechanistic explanation for the impairment in high-intensity work output as a result of high-fat, carbohydrate-restricted diets 58, 59, 60. Recently, an performance impairment effect from ketoadaptation has been observed at lower intensities as well. Burke et al. 61 reported that after 3 weeks on a ketogenic diet at a slight energy deficit, elite race walkers showed increased fat oxidation and aerobic capacity. However, this was accompanied by a reduction in exercise economy (increased oxygen demand for a given speed). The linear and non-linear high-carbohydrate diets in the comparison both caused significant performance improvements, while no significant improvement was seen in the ketogenic diet (there was a nonsignificant performance decrease). It is notable that Paoli et al. 62 found no decrease in bodyweight-based strength performance in elite artistic gymnasts during 30 days of ketogenic diet. Furthermore, the ketogenic diet resulted in significant loss of fat mass (1.9 kg) and non-significant gain of lean mass (0.3 kg). However, unlike Burke et al.’s study, which equated protein between groups (~2.2 g/kg), Paoli et al.’s protein intakes were skewed in favor of the ketogenic diet (2.9 vs. 1.2 g/kg). Wilson et al. 46 recently reported similar increases in strength and power in a protein and calorie-matched comparison of a ketogenic diet and a Western diet model, suggesting that ketogenic diet might have less ergolytic potential for strength training than it does for endurance training.
High-Protein diets
A common thread among high-protein diets (HPD) is that they have their various and subjective definitions. High-protein diets have been more generally defined as intakes reaching 63 or exceeding 25% of total energy 18. High-protein diets have also been identified as ranging from 1.2–1.6 g/kg 44. Classic work by Lemon et al. showed that protein consumed at double the Recommended Dietary Allowance (RDA) (1.6 g/kg) repeatedly outperformed the Recommended Dietary Allowance (0.8 g/kg) for preserving lean mass and reducing fat mass 64, 65. However, Pasiakos et al. 66 found that triple the Recommended Dietary Allowance (RDA) (2.4 g/kg) did not preserve lean mass to a significantly greater extent than double the Recommended Dietary Allowance (RDA). More recently, Longland et al. 67 found that in dieting conditions involving high-intensity interval sprints and resistance training, protein intake at 2.4 g/kg caused lean mass gains (1.2 kg) and fat loss (4.8 kg), while 1.2 g/kg resulted in preservation of lean mass (0.1 kg), and less fat loss (3.5 kg). A unique methodological strength in Longland et al.’s design was the use of the 4C model to assess body composition. Subjects were also provided all food and beverage intake, which added an extra layer of control and strengthened the findings. Augmenting this body of literature is Arciero et al.’s work on “protein-pacing” (4–6 meals/day, >30% protein per meal resulting in >1.4 g/kg/d), which has demonstrated this method’s superiority over conventional, lower-protein/lower-frequency diets for improving body composition in hypocaloric conditions 68, 69.
Of the macronutrients, protein has the highest thermic effect and is the most metabolically expensive. Given this, it is not surprising that higher protein intakes have been seen to preserve resting energy expenditure while dieting. Also, protein is the most satiating macronutrient, followed by carbohydrate, and fat being the least 70. A succession of recent meta-analyses 71, 72, 73 supports the benefit of higher protein intakes for reducing body weight, fat mass, and waist circumference, and preserving lean mass in an energy deficit. A systematic review by Helms et al. 74 suggested that protein intakes of 2.3–3.1 g/kg lean mass was appropriate for lean, resistance trained athletes in hypocaloric conditions. This is one of the rare pieces of literature that report protein requirements on the basis of lean mass rather than total body weight.
Antonio et al. 75 recently began a series of investigations of which can be considered super-high-protein diets. First in the series, the addition of dietary protein amounting to 4.4 g/kg for eight weeks in resistance-trained subjects did not significantly change body composition compared to control conditions of maintenance intake with habitual protein at 1.8 g/kg. Remarkably, the additional protein amounted to an ~800 kcal/day increase, and did not result in additional weight gain. A subsequent 8-week investigation involved resistance-trained subjects on a formally administered, periodized resistance training protocol 76. The high-protein group (HP) consumed 3.4 g/kg, while the normal-protein group (NP) consumed 2.3 g/kg. High-protein group (HP) and normal-protein group (NP) showed significant gains in lean mass (1.5 kg in both groups). A significantly greater fat mass decrease occurred in HP compared to NP (1.6 and 0.3 kg, respectively). This is intriguing, since high-protein group (HP) reported a significant increase caloric intake compared to baseline (374 kcal), while NP’s caloric increase was not statistically significant (103 kcal). A subsequent 8-week crossover trial 77 in resistance-trained subjects compared protein intakes of 3.3 versus 2.6 g/kg/d. A lack of significant differences in body composition and strength performance were seen despite a significantly higher caloric intake in HP vs. NP (an increase of 450 vs. 81 kcal above baseline). Antonio et al.’s most recent investigation 75 was a 1-year crossover trial using resistance-trained subjects, comparing protein intakes of 3.3 vs. 2.5 g/kg. In agreement with previous findings, there were no differences in body composition (importantly, no significant increase in fat mass), despite a significantly higher caloric intake in HP vs. NP (an increase of 450 vs. 81 kcal above baseline). This study also addressed health concerns about long-term high protein intakes (3–4 times the RDA) by demonstrating no adverse effects on a comprehensive list of measured clinical markers, including a complete metabolic panel and blood lipid profile 75.
An in-patient, metabolic ward study by Bray et al. 63 compared 8 weeks of hypercaloric conditions with protein at 5 (low protein), 15 (normal protein), and 25% of total energy (high protein). All three groups gained total body weight, but low protein lost 0.7 kg lean mass. Moreover, the normal protein and high protein groups gained 2.87 and 3.98 kg lean mass, respectively. All three groups gained body fat (3.51 kg) with no significant difference between groups. These results are seemingly at odds with Antonio et al.’s observations75. However, aside from the tighter control and surveillance inherent with metabolic ward conditions, Bray et al.’s subjects were untrained and remained sedentary throughout the study. Antonio et al.’s well-trained subjects were undergoing intensive resistance training and could have had an advantage regarding fuel oxidation and preferential nutrient partitioning toward lean body mass.
Speculation over the fate of the extra protein consumed in the Antonio et al. studies 75 may include a higher thermic effect of feeding, increased non-exercise activity thermogenesis (NEAT), increased thermic effect of exercise (ExEE), increased fecal energy excretion, reduced intake of the other macronutrients via increased satiety and suppressed hepatic lipogenesis. It should be noted as well that there might have been a misreporting of energy intake. Antonio et al.’s findings collectively suggest that the known thermic, satiating, and lean mass-preserving effects of dietary protein might be amplified in trained subjects undergoing progressive resistance exercise.
Intermittent Fasting
Intermittent fasting (IF) can be divided into three subclasses: alternate-day fasting (ADF), whole-day fasting (WDF), and time-restricted feeding (TRF) 78. The most extensively studied Intermittent fasting (IF) variant is alternate-day fasting (ADF), which typically involves a 24-hour fasting period alternated with a 24-hour feeding period. Complete compensatory intake on the feeding days (to offset the fasting days’ deficit) does not occur, and thus total weight loss and fat loss occurs on alternate-day fasting (ADF). Lean mass retention has been a surprisingly positive effect of alternate-day fasting (ADF) 79. However, lean mass loss in alternate-day fasting (ADF) conditions has also been observed by other investigators 80. The latter effect might be attributable to more severe energy deficits. The more lean mass-friendly is an energy-restricted period (~25% of maintenance requirements, typically in the form of a single meal at lunchtime) alternated with a 24-hour ad libitum (as desired) feeding period. Recently, Catenacci et al. 79 reported that alternate-day fasting (ADF) with zero caloric intake on the fasting days alternated with as desired feeding days showed similar results to daily caloric restriction on body composition, and slightly outperformed daily caloric restriction after 6-months of unsupervised weight loss maintenance. On the note of alternating fasting and feeding periods of the same length, alternate-week energy restriction (1 week on ~1300 kcal/day, one week on the usual diet) has only a single study to date, but is worth mentioning since it was as effective as continuous energy restriction for reducing body weight and waist girth at 8 weeks and 1 year 81.
Whole-day fasting (WDF) involves one to two 24-hour fasting periods throughout the week of otherwise maintenance intake to achieve an energy deficit. Of note, not all whole-day fasting (WDF) studies involve zero energy intake during the ‘fasting’ days. Although whole-day fasting (WDF) has been consistently effective for weight loss, Harvie et al. 82 saw no difference in body weight or body fat reduction between the whole-day fasting (2 ‘fasting’ days of ~647 kcal) group and controls when the weekly energy deficit was equated over a 6-month period. A subsequent study by Harvie et al. 83 compared daily energy restriction with two separate all whole-day fasting diets: one with two structured energy-restricted ‘fasting’ days per week, and one whose 2 ‘fasting’ days consisted of ad libitum protein and unsaturated fat. Both all whole-day fasting diets caused greater 3-month fat loss than daily energy restriction (3.7 vs. 2.0 kg). An important detail here is that at 3 months, 70% of the fasting days were completed in the all whole-day fasting groups while the daily energy restriction group achieved their targeted caloric deficit only 39% of the trial.
Time-restricted feeding (TRF) typically involves a fasting period of 16–20 hours and a feeding period of 4–8 hours daily. The most widely studied form of time-restricted feeding (TRF) is Ramadan fasting, which involves approximately 1 month of complete fasting (both food and fluid) from sunrise to sunset. Unsurprisingly, significant weight loss occurs, and this includes a reduction in lean mass as well as fat mass 84. Aside from Ramadan fasting studies, dedicated time-restricted feeding (TRF) research has been scarce until recently. An 8-week trial by Tinsley et al. 85 examined the effect of a 20-hour fasting/4-hour feeding protocol (20/4) done 4 days per week on recreationally active, but untrained subjects. No limitations were placed on the amounts and types of food consumed in the 4-hour eating window. A standardized resistance training program was administered 3 days per week. The time-restricted feeding (TRF) group lost body weight, due to a significantly lower energy intake (667 kcal less on fasting compared to non-fasting days). Cross sectional area of the biceps brachii and rectus femoris increased similarly in both the time-restricted feeding (TRF) and normal diet (ND) group. No significant changes in body composition (via DXA) were seen between groups. Despite a lack of statistical significance, there were notable effect size differences in lean soft tissue (ND gained 2.3 kg, while time-restricted feeding lost 0.2 kg). Although both groups increased strength without significant between-group differences, effect sizes were greater in the time-restricted feeding (TRF) group for bench press endurance, hip sled endurance, and maximal hip sled strength. This finding should be viewed cautiously given the potential for greater and more variable neurological gains in untrained subjects.
A subsequent study by Moro et al. 86 found that in resistance-trained subjects on a standardized training protocol, a 16-hour fasting/8-hour feeding cycle (16/8) resulted in significantly greater fat mass loss in time-restricted feeding vs. normal diet control group (ND) (1.62 vs. 0.31 kg), with no significant changes in lean mass in either group. Time-restricted feeding (TRF)’s meals were consumed at 1 pm, 4 pm, and 8 pm. ND’s meals were consumed at 8 am, 1 pm, and 8 pm. Macronutrient intake between the time-restricted feeding and ND groups was matched, unlike the aforementioned Tinsley et al. study 85 whereby protein intake was disparate and sub-optimal (1.0 g/kg in the time-restricted feeding group and 1.4 g/kg in the ND control group). Subjects in the present study’s time-restricted feedingand ND group consumed 1.93 and 1.89 g/kg, respectively. The mechanisms underlying these results are not clear. The authors speculated that increased adiponectin levels in the time-restricted feeding group could have stimulated mitochondrial biogenesis via interacting with PPAR-gamma, in addition to adiponectin acting centrally to increase energy expenditure. However, the time-restricted feeding group also experienced unfavorable changes such as decreased testosterone and triiodothyronine levels.
Seimon et al. 87 recently published the largest systematic review of IF research to date, comparing the effects of intermittent energy restriction (IER) to continuous energy restriction (CER) on body weight, body composition, and other clinical parameters. Their review included 40 studies in total, 12 of which directly compared an intermittent energy restriction with a continuous energy restriction condition. They found that overall, the two diet types resulted in “apparently equivalent outcomes” in terms of body weight reduction and body composition change. Interestingly, intermittent energy restriction was found to be superior at suppressing hunger. The authors speculated that this might be attributable to ketone production in the fasting phases. However, this effect was immaterial since on the whole, Intermittent Fasting (IF) failed to result in superior improvements in body composition or greater weight loss compared to continuous energy restriction.
Table 3. Diet categories
| Diet | Composition | Strengths | Limitations |
|---|---|---|---|
| Low-calorie diets (LCD) | LCD: 800–1200 kcal/day VLCD: 400–800 kcal/day | Rapid weight loss (1.0–2.5 kg/week, diets involve premade products that eliminate or minimize the need for cooking and planning. | VLCD have a higher risk for more severe side-effects, but do not necessary outperform LCD in the long-term |
| Low-fat diets (LFD) | LFD: 25–30% fat VLFD: 10–20% fat | LFD have the support of the major health organizations due to their large evidence basis in the literature on health effects. Flexible macronutrient range. Does not indiscriminately vilify foods based on carbohydrate content. | Upper limits of fat allowance may falsely convey the message that dietary fat is inherently antagonistic to body fat reduction. VLFD have a scarce evidence basis in terms of comparative effects on body composition, and extremes can challenge adherence. |
| Low-carbohydrate diets | 50–150 g carbohydrate, or up to 40% of kcals from carbohydrate | Defaults to higher protein intake. Large amount of flexibility in macronutrient proportion, and by extension, flexibility in food choices. Does not indiscriminately prohibit foods based on fat content. | Upper limits of carbohydrate allowance may falsely convey the message that carbohydrate is inherently antagonistic to body fat reduction. |
| Ketogenic diets (KD) | Maximum of ~50 g carbohydrate Maximum of ~10% carbohydrate | Defaults to higher protein intake. Suppresses appetite/controls hunger, causes spontaneous reductions in kcal intake under non-calorically restricted conditions. Simplifies the diet planning and decision-making process. | Excludes/minimizes high-carbohydrate foods which can be nutrient dense and disease-preventive. Can compromise high-intensity training output. Has not shown superior effects on body composition compared to non-KD when protein and kcals are matched. Dietary extremes can challenge long-term adherence. |
| High-protein diets (HPD) | HPD: ≥ 25% of total kcals, or 1.2–1.6 g/kg (or more) Super HPD: > 3 g/kg | HPD have a substantial evidence basis for improving body composition compared to RDA levels (0.8 g/kg), especially when combined with training. Super-HPD have an emerging evidence basis for use in trained subjects seeking to maximize intake with minimal-to-positive impacts on body composition. | May cause spontaneous reductions in total energy intake that can antagonize the goal of weight gain. Potentially an economical challenge, depending on the sources. High protein intakes could potentially displace intake of other macronutrients, leading to sub-optimal intakes (especially carbohydrate) for athletic performance goals. |
| Intermittent fasting (IF) | Alternate-day fasting (ADF): alternating 24-h fast, 24-h feed. Whole-day fasting (WDF): 1–2 complete days of fasting per week. Time-restricted feeding (TRF): 16–20-h fast, 4–8-h feed, daily. | ADF, WDF, and TRF have a relatively strong evidence basis for performing equally and sometimes outperforming daily caloric restriction for improving body composition. ADF and WDF have ad libitum feeding cycles and thus do not involve precise tracking of intake. TRF combined with training has an emerging evidence basis for the fat loss while maintaining strength. | Questions remain about whether IF could outperform daily linear or evenly distributed intakes for the goal of maximizing muscle strength and hypertrophy. IF warrants caution and careful planning in programs that require optimal athletic performance. |
Caloric Intake
In its simplest form, Calories In vs Calories Out (CICO) is an acronym for the idea that weight loss or gain is determined by a caloric deficit or surplus, regardless of diet composition. Both voluntary and involuntary factors govern the “calories out” side of the equation, beginning with the varying metabolic cost of processing the macronutrients. As reported by Jéquier, the thermic effect of protein (expressed as a percentage of energy content) is 25–30%, carbohydrate is 6–8%, and fat is 2–3% 89. However, Halton and Hu 90 reported greater variability, with the thermic effect of protein being 20–35%, carbohydrate at 5–15%, and fat being subject to debate since some investigators found a lower thermic effect than carbohydrate while others found no difference.
The thermic effect of food (TEF), also called diet-induced thermogenesis, is one of several components of energy expenditure (EE). The thermic effect of food (TEF) represents approximately 8–15% of total daily energy expenditure (TEE) 91. The largest component of total daily energy expenditure (TEE), at least among individuals not involved in extremely high volumes of exercise, is resting energy expenditure (REE), which is often mentioned interchangeably with resting metabolic rate (RMR) or basal metabolic rate (BMR). Basal metabolic rate is the energetic cost of the biological processes required for survival at rest. As a matter of technical trivia, basal metabolic rate (BMR) is measured in an overnight fasted state, lying supine at complete rest, in the postabsorptive state (the condition in which the gastrointestinal tract is empty of nutrients and body stores must supply required energy). Resting energy expenditure (REE) or resting metabolic rate (RMR) represents fasted-state energy expenditure at rest at any time of the day, and can range 3–10% higher than BMR due to the residual influence of thermic effect of food (TEF) and physical activity 92.
Basal metabolic rate typically amounts to 60–70% of total daily energy expenditure (TEE). The other main component of total daily energy expenditure (TEE) is non-resting energy expenditure, which is comprised of 3 subcomponents: non-exercise activity thermogenesis (NEAT), exercise activity thermogenesis (ExEE), and finally, thermic effect of food (TEF). Non-exercise activity thermogenesis (NEAT) encompasses the energy expenditure of occupation, leisure, basic activities of daily living, and unconscious/spontaneous activity such as fidgeting. While resting metabolic rate (RMR) and thermic effect of food (TEF) are relatively static, Non-exercise activity thermogenesis (NEAT) and exercise activity thermogenesis (ExEE) vary widely within and across individuals. Exercise activity thermogenesis (ExEE) has been reported to range from 15 to 30% of total daily energy expenditure (TEE) 91, but the role of non-exercise activity thermogenesis (NEAT) is more easily overlooked. Non-exercise activity thermogenesis (NEAT) comprises ~15% of total daily energy expenditure (TEE) in sedentary individuals and perhaps 50% or more in highly active individuals 93. The impact of non-exercise activity thermogenesis (NEAT) can be substantial since it can vary by as much as 2000 kcals between individuals of similar size 94. Table 4 outlines the components of total daily energy expenditure (TEE), with examples of low, moderate, and high total daily energy expenditure (TEE) 93.
Humans have a remarkable ability to maintain a relatively constant body weight through adult life despite wide variations in daily energy intake and expenditure. This indicates a highly sophisticated integration of systems that tirelessly auto-regulate homeostasis. In the case of hypocaloric conditions, the body up-regulates hunger and down-regulates energy expenditure. The integration of physiological factors regulating the body’s defense against weight loss (and also weight gain) is symphonic. The central nervous system ‘communicates’ with the adipose tissue, gastrointestinal tract and other organs in an effort to defend against homeostatic changes. This regulatory system is influenced by nutritional, behavioral, autonomic, and endocrine factors 95.
The degree of processing or refinement of foods can influence their thermic effect. Barr and Wright 96 found a diet-induced thermogenesis of 137 kcal for a ‘whole food’ meal, and 73 kcal for the processed food meal. The ‘whole food’ meal had 5% more protein, and 2.5 g more fiber, but these factors are too small to account for the substantial difference in postprandial energy expenditure. The authors speculated that the greater mechanized preparation of the processed food caused less peristalsis and a greater loss of bioactive compounds, resulting in fewer metabolites, thus requiring less enzyme activity. This would lead to more energetically efficient absorption and metabolism. It is important to note that this was not a comparison of a highly processed food versus a whole food. Both of the meals in the comparison were cheese sandwiches. One just happened to have less mechanical refinement, and slightly more fiber and protein. The results of this study imply that processed foods are more fattening or less effective for weight management. However, the contrary has been demonstrated. Meal replacement products (powders, shakes, and bars) have matched or outperformed the effectiveness of whole food-based diets for weight loss and weight loss maintenance 97.
Table 4. Components of total daily energy expenditure (TEE)
| Component of TEE | Percent of TEE | Example: 1600 kcal TEE | Example: 2600 kcal TEE | Example: 3600 kcal TEE |
|---|---|---|---|---|
| Thermic effect of food (TEF) | 8–15% | 128–240 | 208–390 | 288–540 |
| Exercise activity thermogenesis (ExEE) | 15–30% | 240–480 | 390–780 | 540–1080 |
| Non-exercise activity thermogenesis (NEAT) | 15–50% | 240–800 | 390–1300 | 540–1800 |
| Basal metabolic rate (BMR) | 60–70% | 960–1120 | 1560–1820 | 2160–2520 |
An awareness of tissue-specific metabolism can be helpful in understanding the resting metabolic benefits of improving body composition. It can also serve to clarify the widely misunderstood and often overestimated contribution of muscle to REE. McClave and Snider 98 reported that the greatest contributors to resting metabolic rate (RMR), per unit of mass, are the heart and kidneys, each spending approximately 400 kcal/kg/day. Next in the hierarchy are the brain and the liver, at 240 and 200 kcal/kg/day, respectively. These four organs constitute up to 70–80% of resting energy expenditure (REE). In contrast, muscle and adipose tissue expend 13 and 4.5 kcal/kg/day, respectively. A relatively significant muscular gain of 5 kg would increase resting energy expenditure (REE) by only ~65 kcal/day. However, on a net basis (accounting for the total mass of each tissue in the body), muscle, brain, and liver are the top-3 contributors to overall resting metabolic rate (RMR). Thus, substantial losses in lean mass – including muscle – can meaningfully impact resting metabolic rate (RMR). Finally, it should be noted that tissue-specific energy expenditure can vary according to obese vs. non-obese status, advanced age, and to a lesser degree, sex 99. Table 5 outlines the contribution of organs and tissues to REE in healthy adult humans 98.
Table 5. Energy Expenditure of Different Tissues/Organs
| Organ or tissue | Metabolic rate (kcal/kg/day) | % Overall REE | Weight (kg) | % of Total body weight |
|---|---|---|---|---|
| Adipose | 4.5 | 4 | 15 | 21.4 |
| Other (bone, skin, intestine, glands) | 12 | 16 | 23.2 | 33.1 |
| Muscle | 13 | 22 | 28 | 40.0 |
| Liver | 200 | 21 | 1.8 | 2.6 |
| Brain | 240 | 22 | 1.4 | 2.0 |
| Heart | 400 | 9 | 0.3 | 0.5 |
| Kidneys | 400 | 8 | 0.3 | 0.5 |
In determining an appropriate caloric intake, it should be noted that the tissue lost during the course of an energy deficit is influenced by the size of the energy deficit. While greater deficits yield faster weight loss, the percentage of weight loss coming from lean body mass (LBM) tends to increase as the size of the deficit increases 100, 101, 102. In studies of weight loss rates, weekly losses of 1 kg compared to 0.5 kg over 4 weeks resulted in a 5% decrease in bench press strength and a 30% greater reduction in testosterone levels in strength training women 103. Weekly weight loss rates of 1.4% of bodyweight compared to 0.7% in athletes during caloric restriction lasting four to eleven weeks resulted in reductions of fat mass of 21% in the faster weight loss group and 31% in the slower loss group. In addition, LBM increased on average by 2.1% in the slower loss group while remaining unchanged in the faster loss group. Worthy of note, small amounts of LBM were lost among leaner subjects in the faster loss group 101.
Therefore, weight loss rates that are more gradual may be superior for LBM retention. At a loss rate of 0.5 kg per week (assuming a majority of weight lost is fat mass), a 70 kg athlete at 13% body fat would need to be no more than 6 kg to 7 kg over their contest weight in order to achieve the lowest body fat percentages recorded in competitive bodybuilders following a traditional three month preparation 104, 105. If a competitor is not this lean at the start of the preparation, faster weight loss will be required which may carry a greater risk for LBM loss.
In a study of bodybuilders during the twelve weeks before competition, male competitors reduced their caloric intake significantly during the latter half and subsequently lost the greatest amount of lean body mass (LBM) in the final three weeks 106. Therefore, diets longer than two to four months yielding weight loss of approximately 0.5 to 1% of bodyweight weekly may be superior for LBM retention compared to shorter or more aggressive diets. Ample time should be allotted to lose body fat to avoid an aggressive deficit and the length of preparation should be tailored to the competitor; those leaner dieting for shorter periods than those with higher body fat percentages. It must also be taken into consideration that the leaner the competitor becomes the greater the risk for LBM loss 107, 102. As the availability of adipose tissue declines the likelihood of muscle loss increases, thus it may be best to pursue a more gradual approach to weight loss towards the end of the preparation diet compared to the beginning to avoid LBM loss.
- Diets focused primarily on gaining lean mass are driven by a sustained caloric surplus to facilitate anabolic processes and support increasing resistance-training demands 1. The composition and magnitude of the surplus, as well as training status of the subjects can influence the nature of the gains.
- A wide range of dietary approaches (low-fat to low-carbohydrate/ketogenic diets and all points between) can be similarly effective for improving body composition.
- Bodybuilders typically employ a higher meal frequency in an attempt to optimize fat loss and muscle preservation. However, the majority of chronic experimental studies have failed to show that different meal frequencies have different influences on bodyweight or body composition 108, 109, 110. Despite this limitation, the available research has consistently refuted the popular belief that a grazing pattern (smaller, more frequent meals) raises energy expenditure compared to a gorging pattern (larger, less frequent meals). Disparate feeding patterns ranging from two to seven meals per day have been compared in tightly controlled studies using metabolic chambers, and no significant differences in 24-hour thermogenesis have been detected 111, 112. Along these lines, Stote et al. [113] found that compared to three meals per day, one meal per day caused slightly more weight and fat loss. Curiously, the one meal per day group also showed a slight gain in lean mass, but this could have been due to the inherent error in the use of bioelectrical impedance analysis (BIA) to measure body composition for body composition assessment 113.
- Increasing dietary protein to levels significantly beyond current recommendations for athletic populations may result in improved body composition. The International Society of Sports Nutrition’s original 2007 position stand on protein intake (1.4–2.0 g/kg) 114 has gained further support from subsequent investigations arriving at similar requirements in athletic populations 74, 4, 115, 116, 117, 118.
- Higher protein intakes (2.3–3.1 g/kg lean mass) may be required to maximize muscle retention in lean, resistance-trained subjects under hypocaloric conditions. Emerging research on very high protein intakes (>3 g/kg) has demonstrated that the known thermic, satiating, and lean-mass-preserving effects of dietary protein might be amplified in resistance-training subjects.
- The collective body of intermittent caloric restriction (intermittent fasting) research demonstrates no significant advantage over daily caloric restriction for improving body composition. Time-restricted feeding typically involves a fasting period of 16–20 hours and a feeding period of 4–8 hours daily. Unsurprisingly, significant weight loss occurs, and this includes a reduction in lean mass as well as fat mass 119, 84. An 8-week trial by Tinsley et al. 120 examined the effect of a 20-hour fasting/4-hour feeding protocol (20/4) done 4 days per week on recreationally active, but untrained subjects. No limitations were placed on the amounts and types of food consumed in the 4-hour eating window. A standardized resistance training program was administered 3 days per week. The time-restricted feeding group lost body weight, due to a significantly lower energy intake (667 kcal less on fasting compared to non-fasting days). Cross sectional area of the biceps brachii and rectus femoris increased similarly in both the time-restricted feeding and normal diet group. No significant changes in body composition (via DXA) were seen between groups. Despite a lack of statistical significance, there were notable effect size differences in lean soft tissue (normal diet gained 2.3 kg, while time-restricted feeding lost 0.2 kg). Although both groups increased strength without significant between-group differences, effect sizes were greater in the time-restricted feeding group for bench press endurance, hip sled endurance, and maximal hip sled strength. This finding should be viewed cautiously given the potential for greater and more variable neurological gains in untrained subjects. A subsequent study by Moro et al. 121 found that in resistance-trained subjects on a standardized training protocol, a 16-hour fasting/8-hour feeding cycle (16/8) resulted in significantly greater fat loss in time-restricted feeding vs. normal diet control group (ND) (1.62 vs. 0.31 kg), with no significant changes in lean mass in either group. Time-restricted feeding’s meals were consumed at 1 pm, 4 pm, and 8 pm. Normal diet’s meals were consumed at 8 am, 1 pm, and 8 pm. Macronutrient intake between the time-restricted feeding and normal diet groups was matched, unlike the aforementioned Tinsley et al. study 120 whereby protein intake was disparate and sub-optimal (1.0 g/kg in the time-restricted feeding group and 1.4 g/kg in the normal diet control group). Subjects in the present study’s time-restricted feeding and normal diet group consumed 1.93 and 1.89 g/kg, respectively. The mechanisms underlying these results are not clear. The authors speculated that increased adiponectin levels in the time-restricted feeding group could have stimulated mitochondrial biogenesis via interacting with PPAR-gamma, in addition to adiponectin acting centrally to increase energy expenditure. However, the time-restricted feeding group also experienced unfavorable changes such as decreased testosterone and triiodothyronine levels.
- Seimon et al. 122 recently published the largest systematic review of intermittent fasting research to date, comparing the effects of intermittent energy restriction (IER) to continuous energy restriction (CER) on body weight, body composition, and other clinical parameters. Their review included 40 studies in total, 12 of which directly compared an intermittent energy restriction (IER) with a continuous energy restriction (CER) condition. They found that overall, the two diet types resulted in “apparently equivalent outcomes” in terms of body weight reduction and body composition change. Interestingly, intermittent energy restriction (IER) was found to be superior at suppressing hunger. The authors speculated that this might be attributable to ketone production in the fasting phases. However, this effect was immaterial since on the whole, intermittent fasting failed to result in superior improvements in body composition or greater weight loss compared to continuous energy restriction (CER). Table 1 outlines the characteristics of the major diet archetypes.
- Dehydration: In an attempt to enhance muscle size and definition by reducing extracellular water content, many bodybuilders engage in fluid, electrolyte, and carbohydrate manipulation in the final days and hours before competing 123, 124. The effect of electrolyte manipulation and dehydration on visual appearance has not been studied, however it may be a dangerous practice 125. Furthermore, dehydration could plausibly degrade appearance considering that extracellular water is not only present in the subcutaneous layer. A significant amount is located in the vascular system. Thus, the common practice of “pumping up” to increase muscle size and definition by increasing blood flow to the muscle with light, repetitive weight lifting prior to stepping on stage 126 could be compromised by dehydration or electrolyte imbalance. Furthermore, dehydration reduces total body hydration. A large percentage of muscle tissue mass is water and dehydration results in decreases in muscle water content 127 and therefore muscle size, which may negatively impact the appearance of muscularity. At this time it is unknown whether dehydration or electrolyte manipulation improves physique appearance. What is known is that these practices are dangerous and have the potential to worsen it. It is unclear if carbohydrate loading has an impact on appearance and if so, how significant the effect is. However, the recommended muscle-sparing practice by some researchers to increase the carbohydrate content of the diet in the final weeks of preparation 128 might achieve any proposed theoretical benefits of carbohydrate loading. If carbohydrate loading is utilized, a trial run before competition once the competitor has reached or nearly reached competition leanness should be attempted to develop an individualized strategy. However, a week spent on a trial run consuming increased carbohydrates and calories may slow fat loss, thus ample time in the diet would be required.
- Carbohydrate Loading: In the final days before competing, bodybuilders commonly practice carbohydrate loading similar to endurance athletes in an attempt to raise muscle-glycogen levels and increase muscle size 129, 130, 131, 126. In the only direct study of this practice, no significant quantitative change in muscle girth was found to occur [208]. However, an isocaloric diet was used, with only a change in the percentage of carbohydrate contributing to the diet. If total calories had also been increased, greater levels of glycogen might have been stored which could have changed the outcome of this study. Additionally, unlike the subjects in this study bodybuilders prior to carbohydrate loading have reduced glycogen levels from a long calorically restricted diet and it is possible in this state that carbohydrate loading might effect a visual change. Furthermore, bodybuilding performance is measured subjectively, thus analysis of girth alone may not discern subtle visual changes which impact competitive success. Lastly, some bodybuilders alter the amount of carbohydrate loaded based on the visual outcome, increasing the amount if the desired visual change does not occur 131. Thus, an analysis of a static carbohydrate load may not accurately represent the dynamic nature of actual carbohydrate loading practices.In fact, in an observational study of competitive bodybuilders in the days before competition who loaded carbohydrates, subjects showed a 4.9% increase in biceps thickness the final day before competition compared to six weeks prior 129. Although it is unknown if this was caused by increased muscle glycogen, it is unlikely it was due to muscle mass accrual since the final weeks of preparation are often marked by decreases not increases in lean mass 128. Future studies of this practice should include a qualitative analysis of visual changes and analyze the effects of concurrent increases in percentage of carbohydrates as well as total calories.
- The long-term success of a diet depends upon compliance and suppression or circumvention of mitigating factors such as adaptive thermogenesis. Joosen and Westerterp 132 examined the literature (11 studies) to see if “adaptive thermogenesis” existed in overeating experiments. No evidence beyond the theoretical costs of increased body size and thermic effect of food were found. Nevertheless, there is substantial interindividual variability in the energetic response to overfeeding. They found in overfeeding experiments, weight gain is often less than expected from the energy excess intake. In part this is the result of an obligatory increase in energy expenditure associated with the increased body weight and lean mass 133 and the larger amount of food to be digested and absorbed 134. However, evidence for adaptive thermogenesis as a mechanism to explain interindividual differences in weight gain on the same overeating regimen is still inconsistent and hard to prove 135
- There is a paucity of research on women and older populations, as well as a wide range of untapped permutations of feeding frequency and macronutrient distribution at various energetic balances combined with training. Behavioral and lifestyle modification strategies are still poorly researched areas of weight management.
Role of Protein and Amino Acids in promoting Lean Mass gain with Resistance Exercise
Amino acids are major nutrient regulators of muscle protein turnover. After protein ingestion, hyperaminoacidemia stimulates increased rates of skeletal muscle protein synthesis, suppresses muscle protein breakdown and promotes net muscle protein gain for several hours 136. These acute observations form the basis for strategized protein intake to promote lean mass gain, or prevent lean mass loss over the long term. However, factors such as protein dose, protein source, and timing of intake are important in mediating the anabolic effects of amino acids on skeletal muscle and must be considered within the context of evaluating the reported efficacy of long-term studies investigating protein supplementation as part of a dietary strategy to promote lean mass accretion and/or prevent lean mass loss. Current research suggests that dietary protein supplementation can augment resistance exercise-mediated gains in skeletal muscle mass and strength and can preserve skeletal muscle mass during periods of diet-induced energy restriction 136. Perhaps less appreciated, protein supplementation can augment resistance training-mediated gains in skeletal muscle mass even in individuals habitually consuming ‘adequate’ (i.e., >0.8 g kg/day) protein. Additionally, overfeeding energy with moderate to high-protein intake (15–25 % protein or 1.8–3.0 g kg/day) is associated with lean, but not fat mass accretion, when compared to overfeeding energy with low protein intake (5 % protein or ~0.68 g kg/day) 136. Amino acids represent primary nutrient regulators of skeletal muscle anabolism, capable of enhancing lean mass accretion with resistance exercise and attenuating the loss of lean mass during periods of energy deficit, although factors such as protein dose, protein source, and timing of intake are likely important in mediating these effects.
Adequate Protein Consumption
In a review by Phillips and Van Loon 137, it is suggested that a protein intake of 1.8-2.7 g/kg for athletes training in hypocaloric conditions may be optimal. While this is one of the only recommendations existing that targets athletes during caloric restriction, this recommendation is not given with consideration to bodybuilders performing concurrent endurance and resistance training at very low levels of body fat. The collective agreement among reviewers is that a protein intake of 1.2-2.2 g/kg is sufficient to allow adaptation to training for athletes whom are at or above their energy needs 137, 138. However, bodybuilders during their contest preparation period typically perform resistance and cardiovascular training, restrict calories and achieve very lean conditions 139, 106. Each of these factors increases protein requirements and when compounded may further increase protein needs 140. Therefore, optimal protein intakes for bodybuilders during contest preparation may be significantly higher than existing recommendations. However, the recently published systematic review by Helms et al. 140 on protein intakes in resistance-trained, lean athletes during caloric restriction suggests a range of 2.3-3.1 g/kg of LBM, which may be more appropriate for bodybuilding. Moreover, the authors suggest that the lower the body fat of the individual, the greater the imposed caloric deficit and when the primary goal is to retain LBM, the higher the protein intake (within the range of 2.3-3.1 g/kg of LBM) should be.
Carbohydrate Intake
While it is true that resistance training utilizes glycogen as its main fuel source 141, total caloric expenditure of strength athletes is less than that of mixed sport and endurance athletes. Thus, authors of a recent review recommend that carbohydrate intakes for strength sports, including bodybuilding, be between 4–7 g/kg depending on the phase of training 142. However, in the specific case of a bodybuilder in contest preparation, achieving the necessary caloric deficit while consuming adequate protein and fat would likely not allow consumption at the higher end of this recommendation.
Satiety and fat loss generally improve with lower carbohydrate diets; specifically with higher protein to carbohydrate ratios 143, 144. In terms of performance and health, low carbohydrate diets are not necessarily as detrimental as typically espoused 145. In a recent review, it was recommended for strength athletes training in a calorically restricted state to reduce carbohydrate content while increasing protein to maximize fat oxidation and preserve LBM 137. However, the optimal reduction of carbohydrate and point at which carbohydrate reduction becomes detrimental likely needs to be determined individually.
While it appears low carbohydrate, high protein diets can be effective for weight loss, a practical carbohydrate threshold appears to exist where further reductions negatively impact performance and put one at risk for LBM losses. In support of this notion, researchers studying bodybuilders during the final 11 weeks of contest preparation concluded that had they increased carbohydrate during the final weeks of their diet they may have mitigated metabolic and hormonal adaptations that were associated with reductions in LBM 146.
Therefore, once a competitor has reached or has nearly reached the desired level of leanness, it may be a viable strategy to reduce the caloric deficit by an increase in carbohydrate. For example, if a competitor has reached competition body fat levels (lacking any visible subcutaneous fat) and is losing half a kilogram per week (approximately a 500 kcals caloric deficit), carbohydrate could be increased by 25-50 g, thereby reducing the caloric deficit by 100-200 kcals in an effort to maintain performance and LBM. However, it should be noted that like losses of LBM, decrements in performance may not affect the competitive outcome for a bodybuilder. It is possible that competitors who reach the leanest condition may experience unavoidable drops in performance.
Fat Intake
Body composition and caloric restriction may play greater roles in influencing testosterone levels that fat intake. During starvation, a reduction in testosterone occurs in normal weight, but not obese, males 147. In addition, rate of weight loss may influence testosterone levels. Weekly target weight loss rates of 1 kg resulted in a 30% reduction in testosterone compared to target weight loss rates of 0.5 kg per week in resistance trained women of normal weight 148.
Reductions in the percentage of dietary fat in isocaloric diets from approximately 40% to 20% has resulted in modest, but significant, reductions in testosterone levels 149. However, distinguishing the effects of reducing total dietary fat on hormonal levels from changes in caloric intake and percentages of saturated and unsaturated fatty acids in the diet is difficult 150. However, a drop in testosterone does not equate to a reduction in LBM. In direct studies of resistance trained athletes undergoing calorically restricted high protein diets, low fat interventions that maintain carbohydrate levels appear to be more effective at preventing LBM loses than lower carbohydrate, higher fat approaches. These results might indicate that attempting to maintain resistance training performance with higher carbohydrate intakes is more effective for LBM retention than attempting to maintain testosterone levels with higher fat intakes.
While cogent arguments for fat intakes between 20 to 30% of calories have been made to optimize testosterone levels in strength athletes 151, in some cases this intake may be unrealistic in the context of caloric restriction without compromising sufficient protein or carbohydrate intakes. While dieting, low carbohydrate diets may degrade performance 152 and lead to lowered insulin and IGF-1 which appear to be more closely correlated to LBM preservation than testosterone 146. Thus, a lower end fat intake between 15-20% of calories, which has been previously recommended for bodybuilders 153, can be deemed appropriate if higher percentages would reduce carbohydrate or protein below ideal ranges.
Table 6. Dietary recommendations for bodybuilding contest preparation
| Diet component | Recommendation |
|---|---|
| Protein (g/kg of LBM) | 2.3-3.1 |
| Fat (% of total calories) | 15-30% |
| Carbohydrate (% of total calories) | remaining |
| Weekly weight loss (% of body weight) | 0.5-1% |
Note: It must be noted that there is a high degree of variability in the way that individuals respond to diets. If training performance degrades it may prove beneficial to decrease the percentage of calories from dietary fat within these ranges in favor of a greater proportion of carbohydrate. Finally, while outside of the norm, some competitors may find that they respond better to diets that are higher in fat and lower in carbohydrate than recommended in this review. Therefore, monitoring of individual response over a competitive career is suggested. There is no evidence of any relationships with bone structure or regional subcutaneous fat distribution with any response to specific macronutrient ratios in bodybuilders or athletic populations. Bodybuilders, like others athletes, most likely operate best on balanced macronutrient intakes tailored to the energy demands of their sport 154. While the majority of competitors will respond best to the fat and carbohydrate guidelines proposed, the occasional competitor will undoubtedly respond better to a diet that falls outside of these suggested ranges. Careful monitoring over the course of a competitive career is required to determine the optimal macronutrient ratio for pre-contest dieting.
Timing and consumption of protein and/or carbohydrate during workouts
Questions remain about the utility of consuming protein and/or carbohydrate during bodybuilding-oriented training bouts. Since these bouts typically do not resemble endurance bouts lasting 2 hours or more, nutrient consumption during training is not likely to yield any additional performance-enhancing or muscle -sparing benefits if proper pre-workout nutrition is in place. In the exceptional case of resistance training sessions that approach or exceed two hours of exhaustive, continuous work, it might be prudent to employ tactics that maximize endurance capacity while minimizing muscle damage. This would involve approximately 8–15 g protein co-ingested with 30–60 g carbohydrate in a 6-8% solution per hour of training 155. Nutrient timing is an intriguing area of study that focuses on what might clinch the competitive edge. In terms of practical application to resistance training bouts of typical length, Aragon and Schoenfeld 156 recently suggested a protein dose corresponding with 0.4-0.5 g/kg bodyweight consumed at both the pre- and post-exercise periods. However, for objectives relevant to bodybuilding, the current evidence indicates that the global macronutrient composition of the diet is likely the most important nutritional variable related to chronic training adaptations. Table 7 below provides a continuum of importance with bodybuilding-specific context for nutrient timing.
Table 7. Continuum of nutrient & supplement timing importance
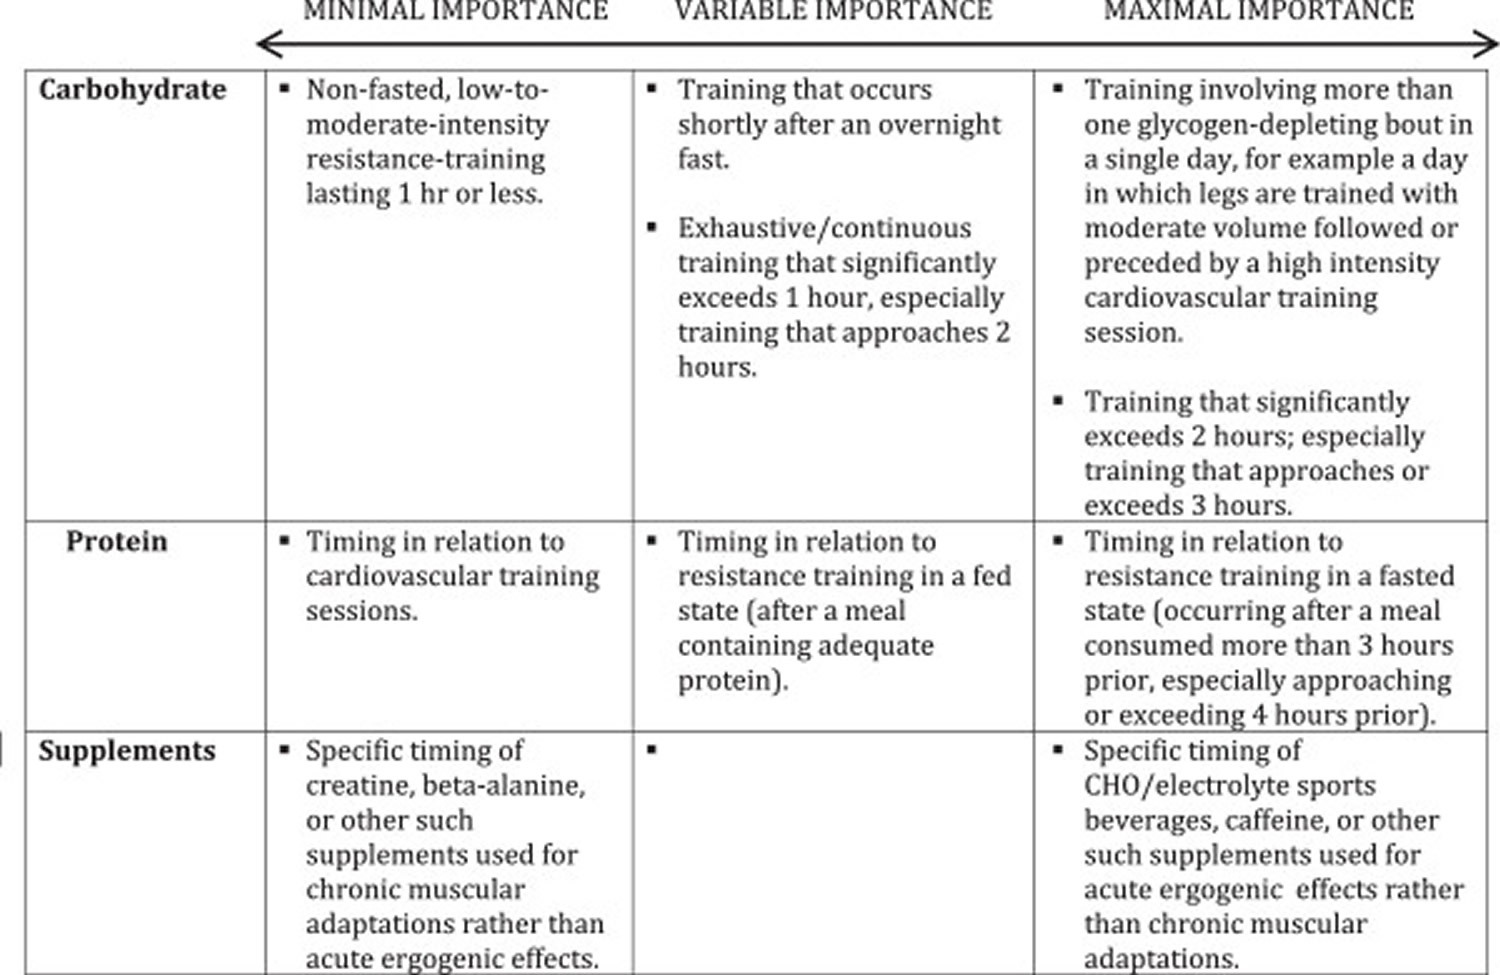
- Aragon AA, Schoenfeld BJ, Wildman R, et al. International society of sports nutrition position stand: diets and body composition. Journal of the International Society of Sports Nutrition. 2017;14:16. doi:10.1186/s12970-017-0174-y. https://www.ncbi.nlm.nih.gov/pmc/articles/PMC5470183/
- Nackers L, Ross K, Perri M. The association between rate of initial weight loss and long-term success in obesity treatment: does slow and steady win the race? Int J Behav Med. 2010;17(3):161–7. doi: 10.1007/s12529-010-9092-y. https://www.ncbi.nlm.nih.gov/pmc/articles/PMC3780395/
- Garthe I, Raastad T, Refsnes P, Koivisto A, Sundgot-Borgen J. Effect of two different weight-loss rates on body composition and strength and power-related performance in elite athletes. Int J Sport Nutr Exerc Metab. 2011;21(2):97–104. doi: 10.1123/ijsnem.21.2.97. https://www.ncbi.nlm.nih.gov/pubmed/21558571
- Helms E, Aragon A, Fitschen P. Evidence-based recommendations for natural bodybuilding contest preparation: nutrition and supplementation. J Int Soc Sports Nutr. 2014;11:20. doi: 10.1186/1550-2783-11-20. https://www.ncbi.nlm.nih.gov/pmc/articles/PMC4033492/
- Wang Z, Pierson RJ, Heymsfield S. The five-level model: a new approach to organizing body-composition research. Am J Clin Nutr. 1992;56:19–28. https://www.ncbi.nlm.nih.gov/pubmed/1609756
- Lee S, Gallagher D. Assessment methods in human body composition. Curr Opin Clin Nutr Metab Care. 2008;11(5):566–72. doi: 10.1097/MCO.0b013e32830b5f23. https://www.ncbi.nlm.nih.gov/pmc/articles/PMC2741386/
- Heymsfield SB, Lohman TG, Wang Z, et al. Human body composition. 2nd ed. Human kinetics; Champaigh, IL: 2005.
- Toomey C, McCormack W, Jakeman P. The effect of hydration status on the measurement of lean tissue mass by dual-energy X-ray absorptiometry. Eur J Appl Physiol. 2017;117(3):567–74. doi: 10.1007/s00421-017-3552-x. https://www.ncbi.nlm.nih.gov/pubmed/28204901
- Bone J, Ross M, Tomcik K, Jeacocke N, Hopkins W, Burke L. Manipulation of muscle creatine and glycogen changes DXA estimates of body composition. Med Sci Sports Exerc. 2016. [Epub ahead of print]. https://www.ncbi.nlm.nih.gov/pubmed/27898642
- Techniques of body composition assessment: a review of laboratory and field methods. Wagner DR, Heyward VH. Res Q Exerc Sport. 1999 Jun; 70(2):135-49. https://www.ncbi.nlm.nih.gov/pubmed/10380245/
- Ar L. Formula food-reducing diets:a new evidence-based addition to the weight management tool box. Nutr Bull. 2014;39(3):238–46. doi: 10.1111/nbu.12098. https://www.ncbi.nlm.nih.gov/pmc/articles/PMC4314695/
- Tsai A, Wadden T. The evolution of very-low-calorie diets: an update and meta-analysis. Obesity (Silver Spring) 2006;14(8):1283–93. doi: 10.1038/oby.2006.146. https://www.ncbi.nlm.nih.gov/pubmed/16988070
- Chang J, Kashyap S. The protein-sparing modified fast for obese patients with type 2 diabetes: what to expect. Cleve Clin J Med. 2014;81(9):557–65. doi: 10.3949/ccjm.81a.13128. https://www.ncbi.nlm.nih.gov/pubmed/25183847
- Saris W. Very-low-calorie diets and sustained weight loss. Obes Res. 2001;9(Suppl 4):295S–301S. doi: 10.1038/oby.2001.134. https://www.ncbi.nlm.nih.gov/pubmed/11707557
- Bryner R, Ullrich I, Sauers J, Donley D, Hornsby G, Kolar M, et al. Effects of resistance vs. aerobic training combined with an 800 calorie liquid diet on lean body mass and resting metabolic rate. J Am Coll Nutr. 1999;18(2):115–21. doi: 10.1080/07315724.1999.10718838. https://www.ncbi.nlm.nih.gov/pubmed/10204826
- Donnelly J, Sharp T, Houmard J, Carlson M, Hill J, Whatley J, et al. Muscle hypertrophy with large-scale weight loss and resistance training. Am J Clin Nutr. 1993;58(4):561–5. https://www.ncbi.nlm.nih.gov/pubmed/8379514
- JE D, J J, S G. Diet and body composition. Effect of very low calorie diets and exercise. Sports Med. 1991;12(4):237–49. doi: 10.2165/00007256-199112040-00003. https://www.ncbi.nlm.nih.gov/pubmed/1784876
- Makris A, Foster G. Dietary approaches to the treatment of obesity. Psychiatr Clin North Am. 2011;34(4):813–27. doi: 10.1016/j.psc.2011.08.004. https://www.ncbi.nlm.nih.gov/pmc/articles/PMC3222874/
- Manore M. Exercise and the institute of medicine recommendations for nutrition. Curr Sports Med Rep. 2005;4(4):193–8. doi: 10.1097/01.CSMR.0000306206.72186.00. https://www.ncbi.nlm.nih.gov/pubmed/16004827
- La Berge A. How the ideology of low fat conquered America. J Hist Med Allied Sci. 2008;63(2):139–77. doi: 10.1093/jhmas/jrn001. https://www.ncbi.nlm.nih.gov/pubmed/18296750
- 2015 Dietary Guidelines Advisory Committee DGAC MEETING 1: Materials and Presentations. History of Dietary Guidance Development in the United States and the Dietary Guidelines for Americans. https://health.gov/dietaryguidelines/2015-binder/meeting1/docs/Minutes_DGAC_Mtg_1_508.pdf
- USDA, USDHHS. 2015 – 2020 Dietary Guidelines for Americans, 8th Edition: U.S. Government Printing Office; 2015. Available from: https://www.cnpp.usda.gov/2015-2020-dietary-guidelines-americans
- Hooper LAA, Bunn D, Brown T, Summerbell CD, Skeaff CM. Effects of total fat intake on body weight. Cochrane Database Syst Rev. 2015;7(8):CD011834. https://www.ncbi.nlm.nih.gov/pubmed/26250104
- Lissner L, Levitsky D, Strupp B, Kalkwarf H, Roe D. Dietary fat and the regulation of energy intake in human subjects. Am J Clin Nutr. 1987;46(6):886–92. https://www.ncbi.nlm.nih.gov/pubmed/3687822
- Kendall A, Levitsky D, Strupp B, Lissner L. Weight loss on a low-fat diet: consequence of the imprecision of the control of food intake in humans. Am J Clin Nutr. 1991;53(5):1124–9. https://www.ncbi.nlm.nih.gov/pubmed/2021123
- Karl J, Roberts S. Energy density, energy intake, and body weight regulation in adults. Adv Nutr. 2014;5(6):835–50. doi: 10.3945/an.114.007112. https://www.ncbi.nlm.nih.gov/pmc/articles/PMC4224224/
- Saquib N, Natarajan L, Rock C, Flatt S, Madlensky L, Kealey S, et al. The impact of a long-term reduction in dietary energy density on body weight within a randomized diet trial. Nutr Cancer. 2008;60(1):31–8. doi: 10.1080/01635580701621320. https://www.ncbi.nlm.nih.gov/pmc/articles/PMC2575113/
- Stubbs R, Whybrow S. Energy density, diet composition and palatability: influences on overall food energy intake in humans. Physiol Behav. 2004;81(5):755–64. doi: 10.1016/j.physbeh.2004.04.027. https://www.ncbi.nlm.nih.gov/pubmed/15234181
- Huang R, Huang C, Hu F, Chavarro J. Vegetarian diets and weight reduction: a meta-analysis of randomized controlled trials. J Gen Intern Med. 2016;31(1):109–16. doi: 10.1007/s11606-015-3390-7. https://www.ncbi.nlm.nih.gov/pmc/articles/PMC4699995/
- Gardner C, Kiazand A, Alhassan S, Kim S, Stafford R, Balise R, et al. Comparison of the Atkins, Zone, Ornish, and LEARN diets for change in weight and related risk factors among overweight premenopausal women: the A TO Z Weight Loss Study: a randomized trial. JAMA. 2007;297(9):969–77. doi: 10.1001/jama.297.9.969. https://www.ncbi.nlm.nih.gov/pubmed/17341711
- de Souza R, Bray G, Carey V, Hall K, LeBoff M, Loria C, et al. Effects of 4 weight-loss diets differing in fat, protein, and carbohydrate on fat mass, lean mass, visceral adipose tissue, and hepatic fat: results from the POUNDS LOST trial. Am J Clin Nutr. 2012;95(3):614–25. doi: 10.3945/ajcn.111.026328. https://www.ncbi.nlm.nih.gov/pmc/articles/PMC3278241/
- USDA, USDHHS. 2015 – 2020 Dietary Guidelines for Americans, 8th Edition: U.S. Government Printing Office; 2015. Available from: https://health.gov/dietaryguidelines
- Frigolet M, Ramos Barragán V, Tamez GM. Low-carbohydrate diets: a matter of love or hate. Ann Nutr Metab. 2011;58(4):320–34. doi: 10.1159/000331994. https://www.ncbi.nlm.nih.gov/pubmed/21985780
- Lara-Castro C, Garvey W. Diet, insulin resistance, and obesity: zoning in on data for Atkins dieters living in South Beach. J Clin Endocrinol Metab. 2004;89(9):4197–205. doi: 10.1210/jc.2004-0683. https://www.ncbi.nlm.nih.gov/pubmed/15356006
- Westman E, Feinman R, Mavropoulos J, Vernon M, Volek J, Wortman J, et al. Low-carbohydrate nutrition and metabolism. Am J Clin Nutr. 2007;86(2):276–84. https://www.ncbi.nlm.nih.gov/pubmed/17684196
- Hu T, Mills K, Yao L, Demanelis K, Eloustaz M, Yancy WJ, et al. Effects of low-carbohydrate diets versus low-fat diets on metabolic risk factors: a meta-analysis of randomized controlled clinical trials. Am J Epidemiol. 2012;176(Suppl 7):S44–54. doi: 10.1093/aje/kws264. https://www.ncbi.nlm.nih.gov/pmc/articles/PMC3530364/
- Mansoor N, Vinknes K, Veierød M, Retterstøl K. Effects of low-carbohydrate diets v. low-fat diets on body weight and cardiovascular risk factors: a meta-analysis of randomised controlled trials. Br J Nutr. 2016;115(3):466–79. doi: 10.1017/S0007114515004699. https://www.ncbi.nlm.nih.gov/pubmed/26768850
- Hashimoto Y, Fukuda T, Oyabu C, Tanaka M, Asano M, Yamazaki M, et al. Impact of low-carbohydrate diet on body composition: meta-analysis of randomized controlled studies. Obes Rev. 2016;17(6):499–509. doi: 10.1111/obr.12405. https://www.ncbi.nlm.nih.gov/pubmed/27059106
- Paoli A. Ketogenic diet for obesity: friend or foe? Int J Environ Res Public Health. 2014;11(2):2092–107. doi: 10.3390/ijerph110202092. https://www.ncbi.nlm.nih.gov/pmc/articles/PMC3945587/
- Paoli A, Rubini A, Volek J, Grimaldi K. Beyond weight loss: a review of the therapeutic uses of very-low-carbohydrate (ketogenic) diets. Eur J Clin Nutr. 2013;67(8):789–96. doi: 10.1038/ejcn.2013.116. https://www.ncbi.nlm.nih.gov/pmc/articles/PMC3826507/
- Hall K, Chen K, Guo J, Lam Y, Leibel R, Mayer L, et al. Energy expenditure and body composition changes after an isocaloric ketogenic diet in overweight and obese men. Am J Clin Nutr. 2016;104(2):324–33. doi: 10.3945/ajcn.116.133561. https://www.ncbi.nlm.nih.gov/pmc/articles/PMC4962163/
- Clifton P, Condo D, Keogh J. Long term weight maintenance after advice to consume low carbohydrate, higher protein diets–a systematic review and meta analysis. Nutr Metab Cardiovasc Dis. 2014;24(3):224–35. doi: 10.1016/j.numecd.2013.11.006. https://www.ncbi.nlm.nih.gov/pubmed/24472635
- Soenen S, Bonomi A, Lemmens S, Scholte J, Thijssen M, van Berkum F, et al. Relatively high-protein or ‘low-carb’ energy-restricted diets for body weight loss and body weight maintenance? Physiol Behav. 2012;107(3):374–80. doi: 10.1016/j.physbeh.2012.08.004. https://www.ncbi.nlm.nih.gov/pubmed/22935440
- Leidy H, Clifton P, Astrup A, Wycherley T, Westerterp-Plantenga M, Luscombe-Marsh N, et al. The role of protein in weight loss and maintenance. Am J Clin Nutr. 2015.
- Weigle D, Breen P, Matthys C, Callahan H, Meeuws K, Burden V, et al. A high-protein diet induces sustained reductions in appetite, ad libitum caloric intake, and body weight despite compensatory changes in diurnal plasma leptin and ghrelin concentrations. Am J Clin Nutr. 2005;82(1):41–8. https://www.ncbi.nlm.nih.gov/pubmed/16002798
- Wilson J, Lowery R, Roberts M, Sharp M, Joy J, Shields K, et al. The effects of ketogenic dieting on body composition, strength, power, and hormonal profiles in resistance training males. J Strength Cond Res. 2017. doi: 10.1519/JSC.0000000000001935. https://www.ncbi.nlm.nih.gov/pubmed/28399015
- Veum V, Laupsa-Borge J, Eng Ø, Rostrup E, Larsen T, Nordrehaug J, et al. Visceral adiposity and metabolic syndrome after very high-fat and low-fat isocaloric diets: a randomized controlled trial. Am J Clin Nutr. 2017;105(1):85–99. doi: 10.3945/ajcn.115.123463. https://www.ncbi.nlm.nih.gov/pubmed/27903520
- Stimson R, Johnstone A, Homer N, Wake D, Morton N, Andrew R, et al. Dietary macronutrient content alters cortisol metabolism independently of body weight changes in obese men. J Clin Endocrinol Metab. 2007;92(11):4480–4. doi: 10.1210/jc.2007-0692. https://www.ncbi.nlm.nih.gov/pubmed/17785367
- Hall K, Guo J. Obesity Energetics: Body Weight Regulation and the Effects of Diet Composition. Gastroenterology. Gastroenterology. 2017;152(7):1718-27. https://www.ncbi.nlm.nih.gov/pubmed/28193517
- Hall K. A review of the carbohydrate-insulin model of obesity. Eur J Clin Nutr. 2017;71(3):323–6. doi: 10.1038/ejcn.2016.260. https://www.ncbi.nlm.nih.gov/pubmed/28074888
- Jabekk P, Moe I, Meen H, Tomten S, Høstmark A. Resistance training in overweight women on a ketogenic diet conserved lean body mass while reducing body fat. Nutr Metab (Lond) 2010;7:17. doi: 10.1186/1743-7075-7-17. https://www.ncbi.nlm.nih.gov/pmc/articles/PMC2845587/
- Wood R, Volek J, Davis S, Dell’Ova C, Fernandez M. Effects of a carbohydrate-restricted diet on emerging plasma markers for cardiovascular disease. Nutr Metab (Lond) 2006;3:19. doi: 10.1186/1743-7075-3-19. https://www.ncbi.nlm.nih.gov/pmc/articles/PMC1481590/
- Sumithran P, Prendergast L, Delbridge E, Purcell K, Shulkes A, Kriketos A, et al. Ketosis and appetite-mediating nutrients and hormones after weight loss. Eur J Clin Nutr. 2013;67(7):759–64. doi: 10.1038/ejcn.2013.90. https://www.ncbi.nlm.nih.gov/pubmed/23632752
- Johnstone A, Horgan G, Murison S, Bremner D, Lobley G. Effects of a high-protein ketogenic diet on hunger, appetite, and weight loss in obese men feeding ad libitum. Am J Clin Nutr. 2008;87(1):44–55. https://www.ncbi.nlm.nih.gov/pubmed/18175736
- Gibson A, Seimon R, Lee C, Ayre J, Franklin J, Markovic T, et al. Do ketogenic diets really suppress appetite? a systematic review and meta-analysis. Obes Rev. 2015;16(1):64–76. doi: 10.1111/obr.12230. https://www.ncbi.nlm.nih.gov/pubmed/25402637
- Havemann L, West S, Goedecke J, Macdonald I, St Clair Gibson A, Noakes T, et al. Fat adaptation followed by carbohydrate loading compromises high-intensity sprint performance. J Appl Physiol. 2006;100(1):194–202. doi: 10.1152/japplphysiol.00813.2005. https://www.ncbi.nlm.nih.gov/pubmed/16141377
- Stellingwerff T, Spriet L, Watt M, Kimber N, Hargreaves M, Hawley J, et al. Decreased PDH activation and glycogenolysis during exercise following fat adaptation with carbohydrate restoration. Am J Physiol Endocrinol Metab. 2006;290(2):E380–8. doi: 10.1152/ajpendo.00268.2005. https://www.ncbi.nlm.nih.gov/pubmed/16188909
- Burke L. Re-examining high-fat diets for sports performance: Did we call the ‘nail in the coffin’ too soon? Sports Med. 2015;45(Suppl 1):S33–49. doi: 10.1007/s40279-015-0393-9. https://www.ncbi.nlm.nih.gov/pmc/articles/PMC4672014/
- Urbain P, Strom L, Morawski L, Wehrle A, Deibert P, Bertz H. Impact of a 6-week non-energy-restricted ketogenic diet on physical fitness, body composition and biochemical parameters in healthy adults. Nutr Metab (Lond). 2017;14. https://www.ncbi.nlm.nih.gov/pmc/articles/PMC5319032/
- Zajac A, Poprzecki S, Maszczyk A, Czuba M, Michalczyk M, Zydek G. The effects of a ketogenic diet on exercise metabolism and physical performance in off-road cyclists. Nutrients. 2014;6(7):2493–508. doi: 10.3390/nu6072493. https://www.ncbi.nlm.nih.gov/pmc/articles/PMC4113752/
- Burke L, Ross M, Garvican-Lewis L, Welvaert M, Heikura I, Forbes S, et al. Low carbohydrate, high fat diet impairs exercise economy and negates the performance benefit from intensified training in elite race walkers. 2016. doi: 10.1113/JP273230. https://www.ncbi.nlm.nih.gov/pmc/articles/PMC5407976/
- Paoli A, Grimaldi K, D’Agostino D, Cenci L, Moro T, Bianco A, et al. Ketogenic diet does not affect strength performance in elite artistic gymnasts. J Int Soc Sports Nutr. 2012;9(1):34. doi: 10.1186/1550-2783-9-34. https://www.ncbi.nlm.nih.gov/pmc/articles/PMC3411406/
- Bray G, Smith S, de Jonge L, Xie H, Rood J, Martin C, et al. Effect of dietary protein content on weight gain, energy expenditure, and body composition during overeating: a randomized controlled trial. JAMA. 2012;307(1):47–55. doi: 10.1001/jama.2011.1918. https://www.ncbi.nlm.nih.gov/pmc/articles/PMC3777747/
- Layman D, Evans E, Erickson D, Seyler J, Weber J, Bagshaw D, et al. A moderate-protein diet produces sustained weight loss and long-term changes in body composition and blood lipids in obese adults. J Nutr. 2009;139(3):514–21. doi: 10.3945/jn.108.099440. https://www.ncbi.nlm.nih.gov/pubmed/19158228
- Layman D, Evans E, Baum J, Seyler J, Erickson D, Boileau R. Dietary protein and exercise have additive effects on body composition during weight loss in adult women. J Nutr. 2005;135(8):1903–10. https://www.ncbi.nlm.nih.gov/pubmed/16046715
- Pasiakos S, Cao J, Margolis L, Sauter E, Whigham L, McClung J, et al. Effects of high-protein diets on fat-free mass and muscle protein synthesis followingweight loss: a randomized controlled trial. FASEB J. 2013;27(9):3837–47. doi: 10.1096/fj.13-230227. https://www.ncbi.nlm.nih.gov/pubmed/23739654
- Longland T, Oikawa S, Mitchell C, Devries M, Phillips S. Higher compared with lower dietary protein during an energy deficit combined with intense exercise promotes greater lean mass gain and fat mass loss: a randomized trial. Am J Clin Nutr. 2016;103(3):738–46. doi: 10.3945/ajcn.115.119339. https://www.ncbi.nlm.nih.gov/pubmed/26817506
- Arciero P, Ormsbee M, Gentile C, Nindl B, Brestoff J, Ruby M. Increased protein intake and meal frequency reduces abdominal fat during energy balance and energy deficit. Obesity (Silver Spring) 2013;21(7):1357–66. doi: 10.1002/oby.20296. https://www.ncbi.nlm.nih.gov/pubmed/23703835
- Arciero PE RC, Bunsawat K, Gentile C, Ketcham C, Darin C, Renna M, et al. Protein-pacing from food or supplementation improves physical performance in overweight men and women: the PRISE 2 study. Nutrients. 2016;8(5):E288. doi: 10.3390/nu8050288. https://www.ncbi.nlm.nih.gov/pmc/articles/PMC4882701/
- Pesta D, Samuel V. A high-protein diet for reducing body fat: mechanisms and possible caveats. Nutr Metab (Lond) 2014;11(1):53. doi: 10.1186/1743-7075-11-53. https://www.ncbi.nlm.nih.gov/pmc/articles/PMC4258944/
- Wycherley T, Moran L, Clifton P, Noakes M, Brinkworth G. Effects of energy-restricted high-protein, low-fat compared with standard-protein, low-fat diets: a meta-analysis of randomized controlled trials. Am J Clin Nutr. 2012;96(6):1281–98. doi: 10.3945/ajcn.112.044321. https://www.ncbi.nlm.nih.gov/pubmed/23097268
- Dong J, Zhang Z, Wang P, Qin L. Effects of high-protein diets on body weight, glycaemic control, blood lipids and blood pressure in type 2 diabetes: meta-analysis of randomised controlled trials. Br J Nutr. 2013;10(5):781–9. doi: 10.1017/S0007114513002055. https://www.ncbi.nlm.nih.gov/pubmed/23829939
- Santesso N, Akl E, Bianchi M, Mente A, Mustafa R, Heels-Ansdell D, et al. Effects of higher- versus lower-protein diets on health outcomes: a systematic review and meta-analysis. Eur J Clin Nutr. 2012;66(7):780–8. doi: 10.1038/ejcn.2012.37. https://www.ncbi.nlm.nih.gov/pmc/articles/PMC3392894/
- Helms E, Zinn C, Rowlands D, Brown S. A systematic review of dietary protein during caloric restriction in resistance trained lean athletes: a case for higher intakes. Int J Sport Nutr Exerc Metab. 2014;24(2):127–38. doi: 10.1123/ijsnem.2013-0054. https://www.ncbi.nlm.nih.gov/pubmed/24092765
- Antonio J, Ellerbroek A, Silver T, Vargas L, Tamayo A, Buehn R, et al. A high protein diet has no harmful effects: a one-year crossover study in resistance-trained males. J Nutr Metab. 2016;2016:9104792. doi: 10.1155/2016/9104792. https://www.ncbi.nlm.nih.gov/pmc/articles/PMC5078648/
- Antonio J, Ellerbroek A, Silver T, Orris S, Scheiner M, Gonzalez A, et al. A high protein diet (3.4 g/kg/d) combined with a heavy resistance training program improves body composition in healthy trained men and women–a follow-up investigation. J Int Soc Sports Nutr. 2015;12:39. doi: 10.1186/s12970-015-0100-0. https://www.ncbi.nlm.nih.gov/pmc/articles/PMC4617900/
- Antonio J, Ellerbroek A, Silver T, Vargas L, Peacock C. The effects of a high protein diet on indices of health and body composition–a crossover trial in resistance-trained men. J Int Soc Sports Nutr. 2016;13:3. doi: 10.1186/s12970-016-0114-2. https://www.ncbi.nlm.nih.gov/pmc/articles/PMC4715299/
- Tinsley G, La Bounty P. Effects of intermittent fasting on body composition and clinical health markers in humans. Nutr Rev. 2015;73(10):661–74. doi: 10.1093/nutrit/nuv041. https://www.ncbi.nlm.nih.gov/pubmed/26374764
- Catenacci V, Pan Z, Ostendorf D, Brannon S, Gozansky W, Mattson M, et al. A randomized pilot study comparing zero-calorie alternate-day fasting to daily caloric restriction in adults with obesity. Obesity (Silver Spring) 2016;24(9):1874–83. doi: 10.1002/oby.21581. https://www.ncbi.nlm.nih.gov/pmc/articles/PMC5042570/
- Hill J, Schlundt D, Sbrocco T, Sharp T, Pope-Cordle J, Stetson B, et al. Evaluation of an alternating-calorie diet with and without exercise in the treatment of obesity. Am J Clin Nutr. 1989;50(2):248–54. https://www.ncbi.nlm.nih.gov/pubmed/2667313
- Keogh J, Pedersen E, Petersen K, Clifton P. Effects of intermittent compared to continuous energy restriction on short-term weight loss and long-term weight loss maintenance. Clin Obes. 2014;4(3):150–6. doi: 10.1111/cob.12052. https://www.ncbi.nlm.nih.gov/pubmed/25826770
- Harvie M, Pegington M, Mattson M, Frystyk J, Dillon B, Evans G, et al. The effects of intermittent or continuous energy restriction on weight loss and metabolic disease risk markers: a randomized trial in young overweight women. Int J Obes (Lond) 2011;35(5):714–27. doi: 10.1038/ijo.2010.171. https://www.ncbi.nlm.nih.gov/pmc/articles/PMC3017674/
- Harvie M, Wright C, Pegington M, McMullan D, Mitchell E, et al. The effect of intermittent energy and carbohydrate restriction v. daily energy restriction on weight loss and metabolic disease risk markers in overweight women. Br J Nutr. 2013;110(8):1534–47. doi: 10.1017/S0007114513000792. https://www.ncbi.nlm.nih.gov/pubmed/23591120
- Norouzy A, Salehi M, Philippou E, Arabi H, Shiva F, Mehrnoosh S, Mohajeri SMR, Reza Mohajeri SA, Motaghedi Larijani A, Nematy M. Effect of fasting in Ramadan on body composition and nutritional intake: a prospective study. J Hum Nutr Diet. 2013;26(Suppl. 1):97–104. https://www.ncbi.nlm.nih.gov/pubmed/23679071
- Tinsley G, Forsse J, Butler N, Paoli A, Bane A, La Bounty P, et al. Time-restricted feeding in young men performing resistance training: A randomized controlled trial. Eur J Sport Sci. 2017;17(2):200–7. doi: 10.1080/17461391.2016.1223173. https://www.ncbi.nlm.nih.gov/pubmed/27550719
- Moro T, Tinsley G, Bianco A, Marcolin G, Pacelli Q, Battaglia G, et al. Effects of eight weeks of time-restricted feeding (16/8) on basal metabolism, maximal strength, body composition, inflammation, and cardiovascular risk factors in resistance-trained males. J Transl Med. 2016;14(1):290. doi: 10.1186/s12967-016-1044-0. https://www.ncbi.nlm.nih.gov/pmc/articles/PMC5064803/
- Seimon R, Roekenes J, Zibellini J, Zhu B, Gibson A, Hills A, et al. Do intermittent diets provide physiological benefits over continuous diets for weight loss? A systematic review of clinical trials. Mol Cell Endocrinol. 2015;418(Pt 2):153–72. doi: 10.1016/j.mce.2015.09.014. https://www.ncbi.nlm.nih.gov/pubmed/26384657
- Aragon AA, Schoenfeld BJ, Wildman R, et al. International society of sports nutrition position stand: diets and body composition. Journal of the International Society of Sports Nutrition. 2017;14:16. doi:10.1186/s12970-017-0174-y. https://www.ncbi.nlm.nih.gov/pmc/articles/PMC5470183
- Jéquier E. Pathways to obesity. Int J Obes Relat Metab Disord. 2002;26(Suppl 2):S12–7. doi: 10.1038/sj.ijo.0802123. https://www.ncbi.nlm.nih.gov/pubmed/12174324
- Halton T, Hu F. The effects of high protein diets on thermogenesis, satiety and weight loss: a critical review. J Am Coll Nutr. 2004;23(5):373–85. doi: 10.1080/07315724.2004.10719381. https://www.ncbi.nlm.nih.gov/pubmed/15466943
- von Loeffelholzn C. The Role of Non-exercise Activity Thermogenesis in Human Obesity. Updated 2014 Jun 5. In: De Groot LJ, Chrousos G, Dungan K, et al, editors Endotext . South Dartmouth (MA): MDText.com, Inc. Available from: https://www.ncbi.nlm.nih.gov/books/NBK279077/
- Pinheiro Volp A, Esteves de Oliveira F, Duarte Moreira Alves R, Esteves E, Bressan J. Energy expenditure: components and evaluation methods. Nutr Hosp. 2011;26(3):430–40. https://www.ncbi.nlm.nih.gov/pubmed/21892558
- Levine J. Nonexercise activity thermogenesis (NEAT): environment and biology. Am J Physiol Endocrinol Metab. 2004;286(5):E675–85. doi: 10.1152/ajpendo.00562.2003. https://www.ncbi.nlm.nih.gov/pubmed/15102614
- Levine J. Nonexercise activity thermogenesis–liberating the life-force. J Intern Med. 2007;262(3):273–87. doi: 10.1111/j.1365-2796.2007.01842.x. https://www.ncbi.nlm.nih.gov/pubmed/17697152
- Boguszewski C, Paz-Filho G, Velloso L. Neuroendocrine body weight regulation: integration between fat tissue, gastrointestinal tract, and the brain. Endokrynol Pol. 2010;61(2):194–206. https://www.ncbi.nlm.nih.gov/pubmed/20464707
- Barr S, Wright J. Postprandial energy expenditure in whole-food and processed-food meals: implications for daily energy expenditure. Food Nutr Res. 2010;54. doi: 10.3402/fnr.v54i0.5144. https://www.ncbi.nlm.nih.gov/pmc/articles/PMC2897733/
- Davis L, Coleman C, Kiel J, Rampolla J, Hutchisen T, Ford L, et al. Efficacy of a meal replacement diet plan compared to a food-based diet plan after a period of weight loss and weight maintenance: a randomized controlled trial. Nutr J. 2010;9:11. doi: 10.1186/1475-2891-9-11. https://www.ncbi.nlm.nih.gov/pmc/articles/PMC2851659/
- McClave S, Snider H. Dissecting the energy needs of the body. Curr Opin Clin Nutr Metab Care. 2001;4(2):143–7. doi: 10.1097/00075197-200103000-00011. https://www.ncbi.nlm.nih.gov/pubmed/11224660
- Müller M, Wang Z, Heymsfield S, Schautz B, Bosy-Westphal A. Advances in the understanding of specific metabolic rates of major organs and tissues in humans. Curr Opin Clin Nutr Metab Care. 2013;16(5):501–8. https://www.ncbi.nlm.nih.gov/pubmed/23924948
- Hall KD. What is the required energy deficit per unit weight loss? Int J Obes. 2007;32:573–576. https://www.ncbi.nlm.nih.gov/pmc/articles/PMC2376744/
- Garthe I, Raastad T, Refsnes PE, Koivisto A, Sundgot-Borgen J. Effect of two different weight-loss rates on body composition and strength and power-related performance in elite athletes. Int J Sport Nutr Exerc Metab. 2011;21:97–104. https://www.ncbi.nlm.nih.gov/pubmed/21558571
- Hall KD. Body fat and fat-free mass inter-relationships: Forbes’s theory revisited. Br J Nutr. 2007;97:1059–1063. doi: 10.1017/S0007114507691946. https://www.ncbi.nlm.nih.gov/pmc/articles/PMC2376748/
- Mero AA, Huovinen H, Matintupa O, Hulmi JJ, Puurtinen R, Hohtari H, Karila T. Moderate energy restriction with high protein diet results in healthier outcome in women. J Int Soc Sports Nutr. 2010;7:4. doi: 10.1186/1550-2783-7-4. https://www.ncbi.nlm.nih.gov/pmc/articles/PMC2822830/
- Withers RT, Noell CJ, Whittingham NO, Chatterton BE, Schultz CG, Keeves JP. Body composition changes in elite male bodybuilders during preparation for competition. Aust J Sci Med Sport. 1997;29:11–16. https://www.ncbi.nlm.nih.gov/pubmed/9127683
- van der Ploeg GE, Brooks AG, Withers RT, Dollman J, Leaney F, Chatterton BE. Body composition changes in female bodybuilders during preparation for competition. Eur J Clin Nutr. 2001;55:268–277. doi: 10.1038/sj.ejcn.1601154. https://www.ncbi.nlm.nih.gov/pubmed/11360131
- Newton LE, Hunter GR, Bammon M, Roney RK. Changes in psychological state and self-reported diet during various phases of training in competitive bodybuilders. J Strength Cond Res. 1993;7:153–158.
- Forbes GB. Body fat content influences the body composition response to nutrition and exercise. Ann N Y Acad Sci. 2000;904:359–365. https://www.ncbi.nlm.nih.gov/pubmed/10865771
- Harvie MN, Pegington M, Mattson MP, Frystyk J, Dillon B, Evans G, Cuzick J, Jebb SA, Martin B, Cutler RG, Son TG, Maudsley S, Carlson OD, Egan JM, Flyvbjerg A, Howell A. The effects of intermittent or continuous energy restriction on weight loss and metabolic disease risk markers: a randomized trial in young overweight women. Int J Obes. 2011;35:714–727. doi: 10.1038/ijo.2010.171. https://www.ncbi.nlm.nih.gov/pmc/articles/PMC3017674/
- Soeters MR, Lammers NM, Dubbelhuis PF, Ackermans M, Jonkers-Schuitema CF, Fliers E, Sauerwein HP, Aerts JM, Serlie MJ. Intermittent fasting does not affect whole-body glucose, lipid, or protein metabolism. Am J Clin Nutr. 2009;90:1244–1251. doi: 10.3945/ajcn.2008.27327. https://www.ncbi.nlm.nih.gov/pubmed/19776143
- La Bounty PM, Campbell BI, Wilson J, Galvan E, Berardi J, Kleiner SM, Kreider RB, Stout JR, Ziegenfuss T, Spano M, Smith A, Antonio J. International Society of Sports Nutrition position stand: meal frequency. J Int Soc Sports Nutr. 2011;8:4. doi: 10.1186/1550-2783-8-4. https://www.ncbi.nlm.nih.gov/pmc/articles/PMC3070624/
- Compared with nibbling, neither gorging nor a morning fast affect short-term energy balance in obese patients in a chamber calorimeter. Taylor MA, Garrow JS. Int J Obes Relat Metab Disord. 2001 Apr; 25(4):519-28. https://www.ncbi.nlm.nih.gov/pubmed/11319656/
- Influence of the feeding frequency on nutrient utilization in man: consequences for energy metabolism. Verboeket-van de Venne WP, Westerterp KR. Eur J Clin Nutr. 1991 Mar; 45(3):161-9. https://www.ncbi.nlm.nih.gov/pubmed/1905998/
- Helms ER, Aragon AA, Fitschen PJ. Evidence-based recommendations for natural bodybuilding contest preparation: nutrition and supplementation. Journal of the International Society of Sports Nutrition. 2014;11:20. doi:10.1186/1550-2783-11-20. https://www.ncbi.nlm.nih.gov/pmc/articles/PMC4033492/
- Campbell B, Kreider R, Ziegenfuss T, La Bounty P, Roberts M, Burke D, et al. International Society of Sports Nutrition position stand: protein and exercise. J Int Soc Sports Nutr. 2007;4:8. doi: 10.1186/1550-2783-4-8. https://www.ncbi.nlm.nih.gov/pmc/articles/PMC2117006/
- Bandegan A, Courtney-Martin G, Rafii M, Pencharz P, Lemon P. Indicator amino acid–derived estimate of dietary protein requirement for male bodybuilders on a non training day is several-fold greater than the current recommended dietary allowance. J Nutr. 2017;147(5):850-7. https://www.ncbi.nlm.nih.gov/pubmed/28179492
- Cermak NR, de PT, Groot LC S, WH van Loon LJ. Protein supplementation augments the adaptive response of skeletal muscle to resistance-type exercise training: a meta-analysis. Am J Clin Nutr. 2012;96(6):1454–64. doi: 10.3945/ajcn.112.037556. http://ajcn.nutrition.org/content/96/6/1454.long
- Phillips S, Van Loon L. Dietary protein for athletes: from requirements to optimum adaptation. J Sports Sci. 2011;29(Suppl 1):S29–38. doi: 10.1080/02640414.2011.619204. https://www.ncbi.nlm.nih.gov/pubmed/22150425
- Churchward-Venne T, Murphy C, Longland T, Phillips S. Role of protein and amino acids in promoting lean mass accretion with resistance exercise and attenuating lean mass loss during energy deficit in humans. Amino Acids. 2013;45(2):231–40. doi: 10.1007/s00726-013-1506-0. https://www.ncbi.nlm.nih.gov/pubmed/23645387
- Attarzadeh Hosseini S, Sardar M, Hejazi K, Farahati S. The effect of ramadan fasting and physical activity on body composition, serum osmolarity levels and some parameters of electrolytes in females. Int J Endocrinol Metab. 2013;11(2):88–94. doi: 10.5812/ijem.9602. https://www.ncbi.nlm.nih.gov/pmc/articles/PMC3693661/
- Time-restricted feeding in young men performing resistance training: A randomized controlled trial. Tinsley GM, Forsse JS, Butler NK, Paoli A, Bane AA, La Bounty PM, Morgan GB, Grandjean PW. Eur J Sport Sci. 2017 Mar; 17(2):200-207. https://www.ncbi.nlm.nih.gov/pubmed/27550719/
- Effects of eight weeks of time-restricted feeding (16/8) on basal metabolism, maximal strength, body composition, inflammation, and cardiovascular risk factors in resistance-trained males. Moro T, Tinsley G, Bianco A, Marcolin G, Pacelli QF, Battaglia G, Palma A, Gentil P, Neri M, Paoli A. J Transl Med. 2016 Oct 13; 14(1):290. https://www.ncbi.nlm.nih.gov/pubmed/27737674/
- Do intermittent diets provide physiological benefits over continuous diets for weight loss? A systematic review of clinical trials. Seimon RV, Roekenes JA, Zibellini J, Zhu B, Gibson AA, Hills AP, Wood RE, King NA, Byrne NM, Sainsbury A. Mol Cell Endocrinol. 2015 Dec 15; 418 Pt 2():153-72. https://www.ncbi.nlm.nih.gov/pubmed/26384657/
- Kleiner SM, Bazzarre TL, Litchford MD. Metabolic profiles, diet, and health practices of championship male and female bodybuilders. J Am Diet Assoc. 1990;90:962–967. https://www.ncbi.nlm.nih.gov/pubmed/2365938
- Hickson JF Jr, Johnson TE, Lee W, Sidor RJ. Nutrition and the precontest preparations of a male bodybuilder. J Am Diet Assoc. 1990;90:264–267. https://www.ncbi.nlm.nih.gov/pubmed/2303663
- Andersen RE, Barlett SJ, Morgan GD, Brownell KD. Weight loss, psychological, and nutritional patterns in competitive male body builders. Int J Eat Disord. 1995 Jul;18(1):49-57. https://www.ncbi.nlm.nih.gov/pubmed/7670443
- Balon TW, Horowitz JF, Fitzsimmons KM. Effects of carbohydrate loading and weight-lifting on muscle girth. Int J Sport Nutr. 1992;2:328–334. https://www.ncbi.nlm.nih.gov/pubmed/1299502
- Costill DL, Cote R, Fink W. Muscle water and electrolytes following varied levels of dehydration in man. J Appl Physiol. 1976;40:6–11. https://www.ncbi.nlm.nih.gov/pubmed/1248983
- Maestu J, Eliakim A, Jurimae J, Valter I, Jurimae T. Anabolic and catabolic hormones and energy balance of the male bodybuilders during the preparation for the competition. J Strength Cond Res. 2010;24:1074–1081. doi: 10.1519/JSC.0b013e3181cb6fd3. https://www.ncbi.nlm.nih.gov/pubmed/20300017
- Bamman MM, Hunter GR, Newton LE, Roney RK, Khaled MA. Changes in body composition, diet, and strength of bodybuilders during the 12 weeks prior to competition. J Sports Med Phys Fitness. 1993;33:383–391. https://www.ncbi.nlm.nih.gov/pubmed/8035587
- Walberg-Rankin J, Edmonds CE, Gwazdauskas FC. Diet and weight changes of female bodybuilders before and after competition. Int J Sport Nutr. 1993;3:87–102. https://www.ncbi.nlm.nih.gov/pubmed/8499941
- Shephard RJ. Electrolyte manipulation in female body-builders. Br J Sports Med. 1994;28:60–61. https://www.ncbi.nlm.nih.gov/pmc/articles/PMC1332163/
- Joosen A, Westerterp K. Energy expenditure during overfeeding. Nutr Metab (Lond) 2006;3:25. doi: 10.1186/1743-7075-3-25. https://www.ncbi.nlm.nih.gov/pmc/articles/PMC1543621/
- Changes in energy expenditure resulting from altered body weight. Leibel RL, Rosenbaum M, Hirsch J. N Engl J Med. 1995 Mar 9; 332(10):621-8. https://www.ncbi.nlm.nih.gov/pubmed/7632212/
- Determinants of 24-hour energy expenditure in man. Methods and results using a respiratory chamber. Ravussin E, Lillioja S, Anderson TE, Christin L, Bogardus C. J Clin Invest. 1986 Dec; 78(6):1568-78. https://www.ncbi.nlm.nih.gov/pubmed/3782471/
- Joosen AM, Westerterp KR. Energy expenditure during overfeeding. Nutrition & Metabolism. 2006;3:25. doi:10.1186/1743-7075-3-25. https://www.ncbi.nlm.nih.gov/pmc/articles/PMC1543621/
- Amino Acids. 2013 Aug;45(2):231-40. doi: 10.1007/s00726-013-1506-0. Epub 2013 May 5. Role of protein and amino acids in promoting lean mass accretion with resistance exercise and attenuating lean mass loss during energy deficit in humans. https://www.ncbi.nlm.nih.gov/pubmed/23645387
- Dietary protein for athletes: from requirements to optimum adaptation. Phillips SM, Van Loon LJ. J Sports Sci. 2011; 29 Suppl 1():S29-38. https://www.ncbi.nlm.nih.gov/pubmed/22150425/
- Contemporary issues in protein requirements and consumption for resistance trained athletes. Wilson J, Wilson GJ. J Int Soc Sports Nutr. 2006 Jun 5; 3():7-27. https://www.ncbi.nlm.nih.gov/pubmed/18500966/
- Comparison of body composition, exercise and nutritional profiles of female and male body builders at competition. Sandoval WM, Heyward VH, Lyons TM. J Sports Med Phys Fitness. 1989 Mar; 29(1):63-70. https://www.ncbi.nlm.nih.gov/pubmed/2770270/
- A systematic review of dietary protein during caloric restriction in resistance trained lean athletes: a case for higher intakes. Helms ER, Zinn C, Rowlands DS, Brown SR. Int J Sport Nutr Exerc Metab. 2014 Apr; 24(2):127-38. https://www.ncbi.nlm.nih.gov/pubmed/24092765/
- Muscle substrate utilization and lactate production. MacDougall JD, Ray S, Sale DG, McCartney N, Lee P, Garner S. Can J Appl Physiol. 1999 Jun; 24(3):209-15. https://www.ncbi.nlm.nih.gov/pubmed/10364416/
- Nutrition guidelines for strength sports: sprinting, weightlifting, throwing events, and bodybuilding. Slater G, Phillips SM. J Sports Sci. 2011; 29 Suppl 1():S67-77. https://www.ncbi.nlm.nih.gov/pubmed/21660839/
- A reduced ratio of dietary carbohydrate to protein improves body composition and blood lipid profiles during weight loss in adult women. Layman DK, Boileau RA, Erickson DJ, Painter JE, Shiue H, Sather C, Christou DD. J Nutr. 2003 Feb; 133(2):411-7. https://www.ncbi.nlm.nih.gov/pubmed/12566476/
- Energy expenditure, satiety, and plasma ghrelin, glucagon-like peptide 1, and peptide tyrosine-tyrosine concentrations following a single high-protein lunch. Smeets AJ, Soenen S, Luscombe-Marsh ND, Ueland Ø, Westerterp-Plantenga MS. J Nutr. 2008 Apr; 138(4):698-702. https://www.ncbi.nlm.nih.gov/pubmed/18356323/
- Low-carbohydrate diets and performance. Cook CM, Haub MD. Curr Sports Med Rep. 2007 Jul; 6(4):225-9. https://www.ncbi.nlm.nih.gov/pubmed/17617997/
- Anabolic and catabolic hormones and energy balance of the male bodybuilders during the preparation for the competition. Mäestu J, Eliakim A, Jürimäe J, Valter I, Jürimäe T. J Strength Cond Res. 2010 Apr; 24(4):1074-81. https://www.ncbi.nlm.nih.gov/pubmed/20300017/
- Pituitary–gonadal axis during prolonged total starvation in obese men. Suryanarayana BV, Kent JR, Meister L, Parlow AF. Am J Clin Nutr. 1969 Jun; 22(6):767-70. https://www.ncbi.nlm.nih.gov/pubmed/5789477/
- Moderate energy restriction with high protein diet results in healthier outcome in women. Mero AA, Huovinen H, Matintupa O, Hulmi JJ, Puurtinen R, Hohtari H, Karila TA. J Int Soc Sports Nutr. 2010 Jan 25; 7(1):4. https://www.ncbi.nlm.nih.gov/pubmed/20205751/
- Decrease of serum total and free testosterone during a low-fat high-fibre diet. Hämäläinen EK, Adlercreutz H, Puska P, Pietinen P. J Steroid Biochem. 1983 Mar; 18(3):369-70. https://www.ncbi.nlm.nih.gov/pubmed/6298507/
- Diet and serum sex hormones in healthy men. Hämäläinen E, Adlercreutz H, Puska P, Pietinen P. J Steroid Biochem. 1984 Jan; 20(1):459-64. https://www.ncbi.nlm.nih.gov/pubmed/6538617/
- Bird SP. Strength nutrition: maximizing your anabolic potential. Strength Cond J. 2010;32:80–86. doi: 10.1519/SSC.0b013e3181d5284e.
- Macronutrient content of a hypoenergy diet affects nitrogen retention and muscle function in weight lifters. Walberg JL, Leidy MK, Sturgill DJ, Hinkle DE, Ritchey SJ, Sebolt DR. Int J Sports Med. 1988 Aug; 9(4):261-6. https://www.ncbi.nlm.nih.gov/pubmed/3182156/
- Macronutrient considerations for the sport of bodybuilding. Lambert CP, Frank LL, Evans WJ. Sports Med. 2004; 34(5):317-27. https://www.ncbi.nlm.nih.gov/pubmed/15107010/
- A perspective on fat intake in athletes. Pendergast DR, Leddy JJ, Venkatraman JT. J Am Coll Nutr. 2000 Jun; 19(3):345-50. https://www.ncbi.nlm.nih.gov/pubmed/10872896/
- International Society of Sports Nutrition position stand: nutrient timing. Kerksick C, Harvey T, Stout J, Campbell B, Wilborn C, Kreider R, Kalman D, Ziegenfuss T, Lopez H, Landis J, Ivy JL, Antonio J. J Int Soc Sports Nutr. 2008 Oct 3; 5():17. https://www.ncbi.nlm.nih.gov/pubmed/18834505/
- Aragon AA, Schoenfeld BJ. Nutrient timing revisited: is there a post-exercise anabolic window? J Int Soc Sports Nutr. 2013;10:5. doi: 10.1186/1550-2783-10-5. https://www.ncbi.nlm.nih.gov/pmc/articles/PMC3577439/
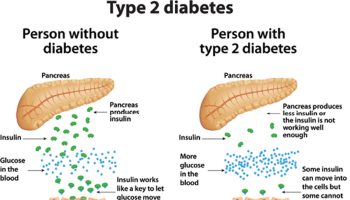


