close

Diet Plan

Diet PlanDiet, Food & Fitness

What is the Mayo Clinic Diet ?

the mayo clinic diet

The Mayo Clinic Diet

The Mayo Clinic Diet is a long-term weight management program created by a team of weight-loss experts at Mayo Clinic 1. The Mayo Clinic Diet is designed to help you reshape your lifestyle by adopting healthy new habits and breaking unhealthy old ones. The goal is to make simple, pleasurable changes that will result in a healthy weight that you can maintain for the rest of your life.

The purpose of the Mayo Clinic Diet is to help you lose excess weight and to find a way of eating that you can sustain for a lifetime. It focuses on changing your daily routine by adding and breaking habits that can make a difference in your weight, such as eating more fruits and vegetables, not eating while you watch TV and moving your body for 30 minutes a day.

The Mayo Clinic Diet also stresses key components of behavior change, such as finding your inner motivation to lose weight, setting achievable goals and handling setbacks.

Why you might follow the Mayo Clinic Diet

You might choose to follow the Mayo Clinic Diet because you:

  • Want to follow a diet that has been developed by medical professionals.
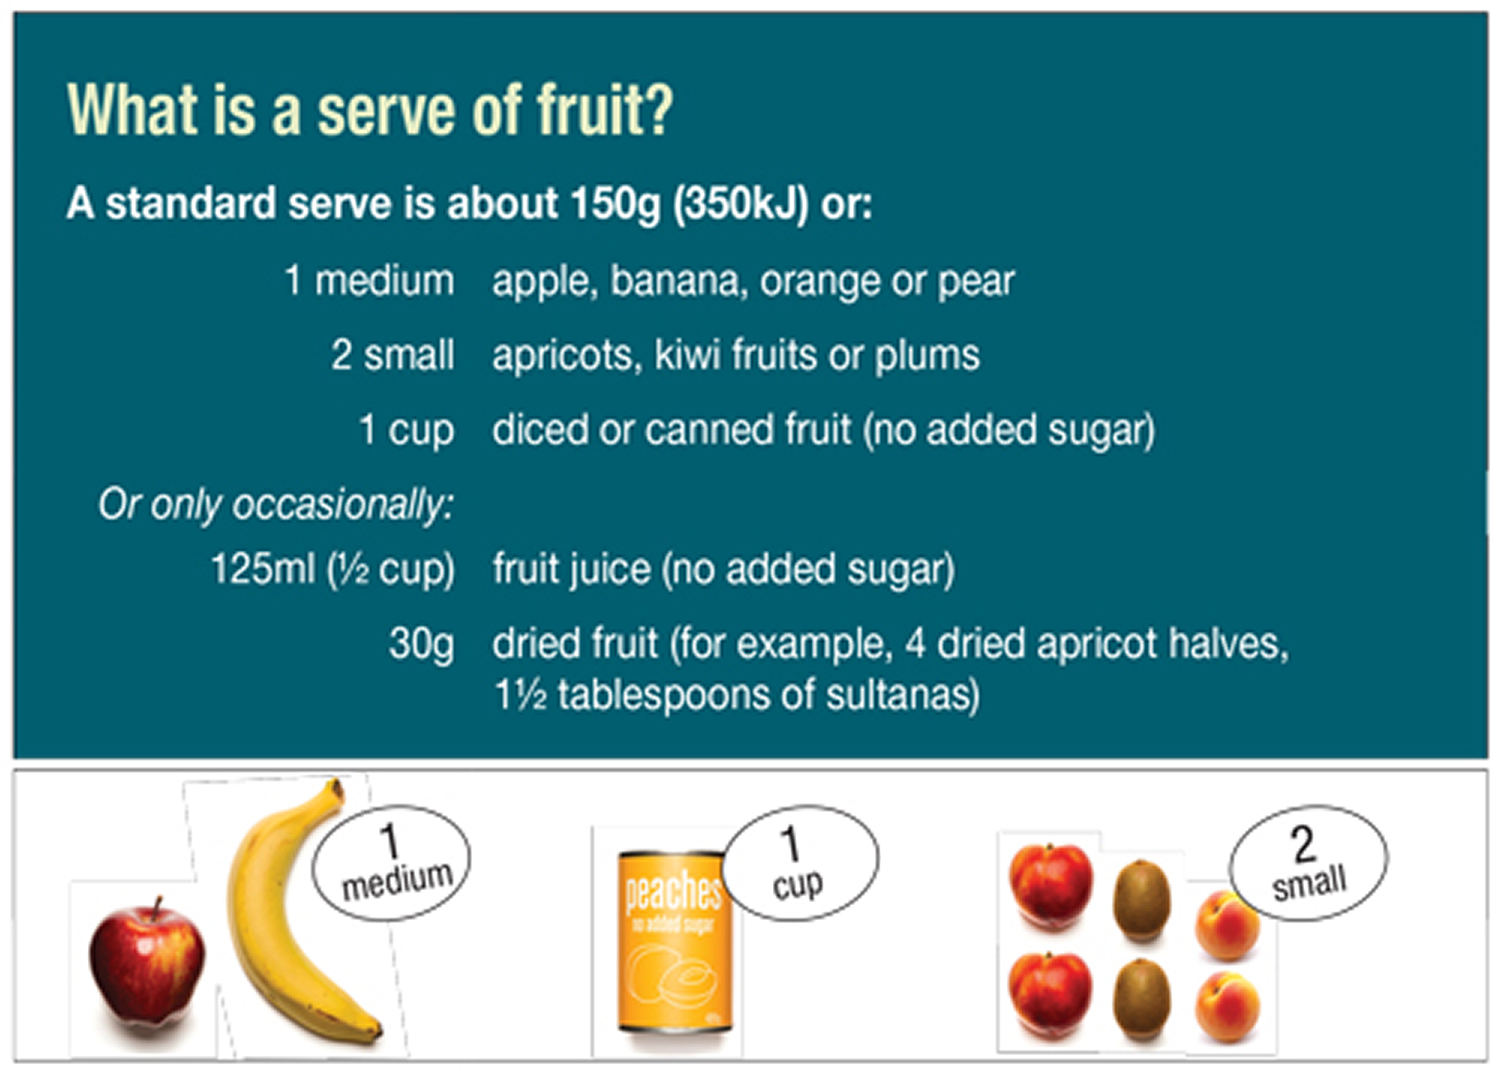
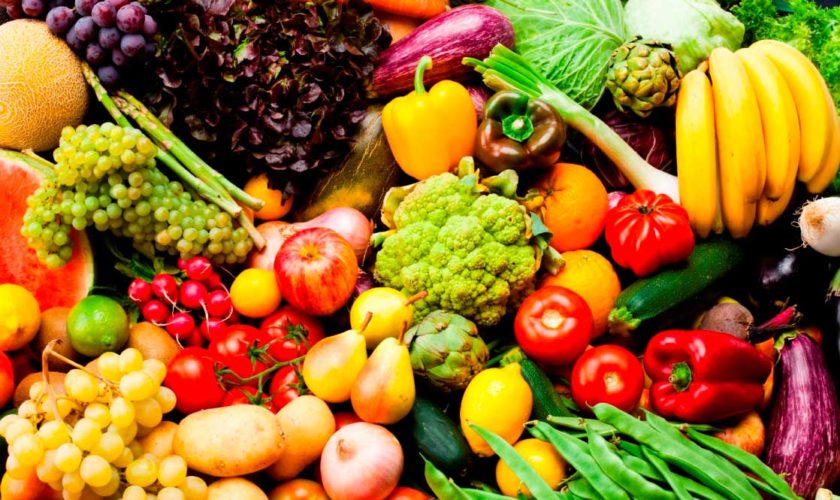
  • Enjoy the types and amounts of food featured in the diet, including unlimited vegetables and fruits.
  • Want to learn how to drop unhealthy lifestyle habits and gain healthy ones.
  • Want to improve your health and reduce your health risks by becoming more active and eating the recommended foods.
  • Don’t want to be precise about counting calories or grams of fat or eliminate entire groups of foods.
  • Want a diet you can stick with for life, not a fad or quick fix

Diet details

The Mayo Clinic Diet is the official diet developed by Mayo Clinic, based on research and clinical experience. It focuses on eating healthy foods that taste great and increasing physical activity. It emphasizes that the best way to keep weight off for good is to change your lifestyle and adopt new health habits. This diet can be tailored to your own individual needs and health history — it isn’t a one-size-fits-all approach.

The Mayo Clinic Diet has two main parts:

  1. Lose It ! This two-week phase is designed to jump-start your weight loss, so you may lose up to 6 to 10 pounds (2.7 to 4.5 kilograms) in a safe and healthy way. In this phase, you focus on lifestyle habits that are associated with weight. You learn how to ADD 5 healthy habits, BREAK 5 unhealthy habits and ADOPT another 5 bonus healthy habits. This phase can help you see some quick results — a psychological boost — and start practicing important habits that you’ll carry into the next phase of the diet.
  2. Live It ! This phase is a lifelong approach to diet and health. In this phase, you learn more about food choices, portion sizes, menu planning, physical activity, exercise and sticking to healthy habits. You may continue to see a steady weight loss of 1 to 2 pounds (0.5 to 1 kilogram) a week until you reach your goal weight. This phase can also help you maintain your goal weight permanently.

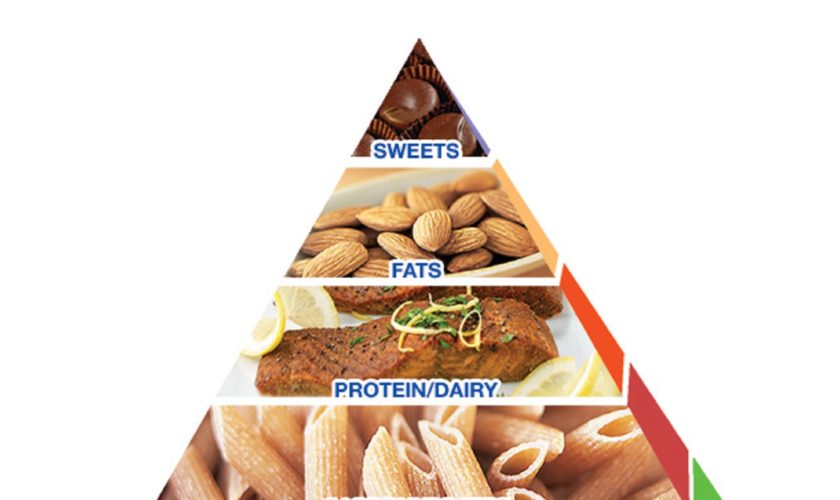
Follow the Mayo Clinic Healthy Weight Pyramid

The Mayo Clinic Healthy Weight Pyramid is a tool that helps guide you toward eating a balanced, nutritious diet while achieving a healthy weight.

The Mayo Clinic Diet doesn’t require you to be precise about counting calories or grams of fat. Instead, the Mayo Clinic Healthy Weight Pyramid serves as a guide to making smart eating choices. The main message is simple: Eat most of your food from the groups at the base of the pyramid and less from the top — and move more.

Vegetables and fruits, the foundation of the pyramid, should be your focus. These foods are low in energy density. That means you can eat a lot of them because they don’t contain a lot of calories. As you go up the pyramid, the food groups become higher in energy density — they have more calories for their volume. To lose weight, you should limit how many servings of these foods you eat.

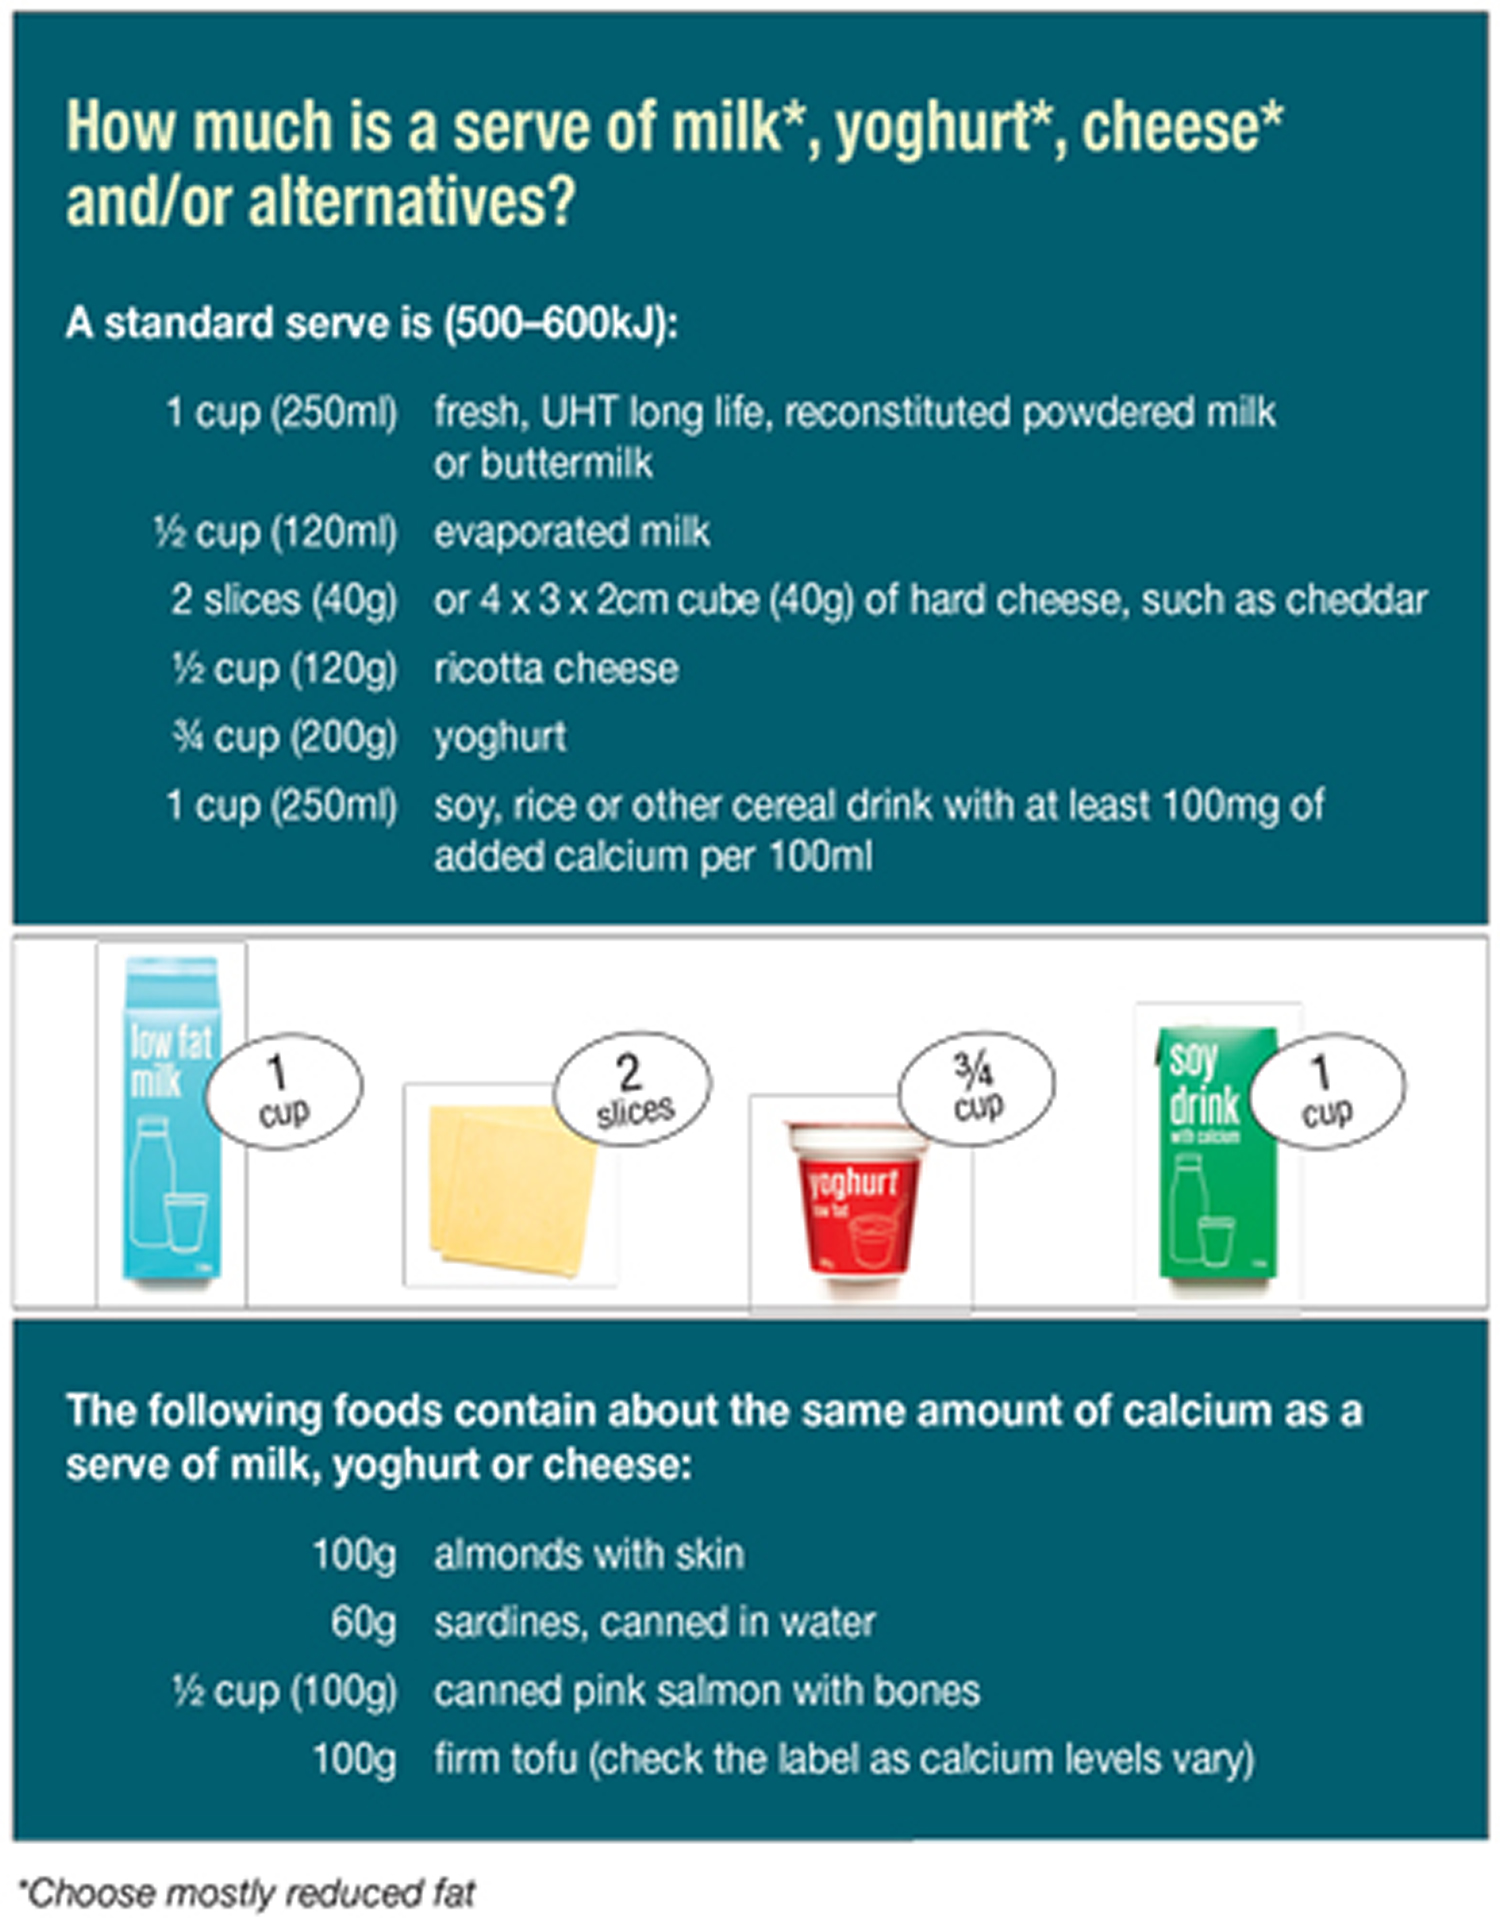
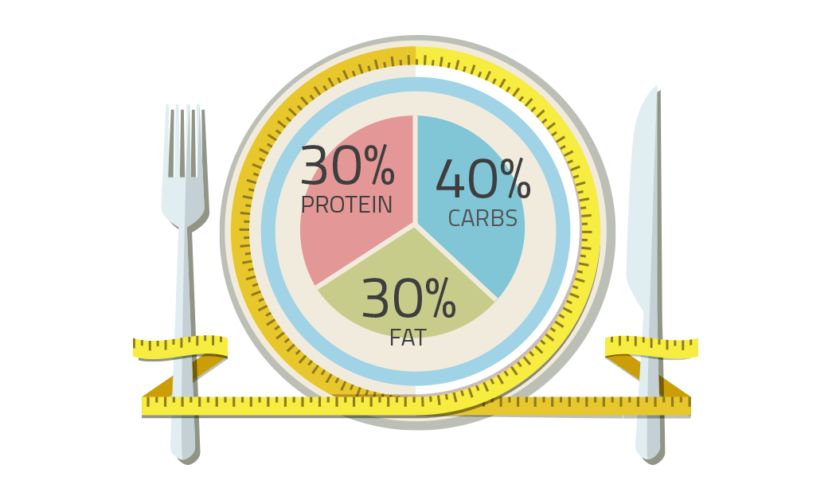
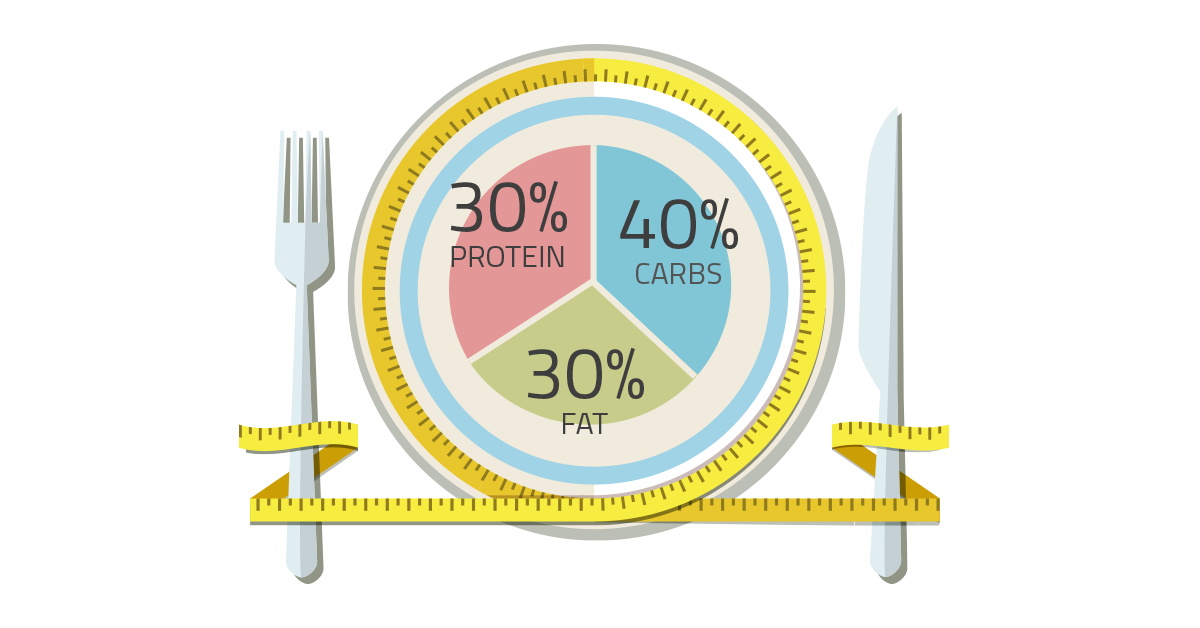
The number of servings for each food group is determined by your daily target calorie level. If your target is 1,200 calories, your meal plan should include four or more servings of vegetables, three servings of protein/dairy and three fat servings.mayo clinic diet plan

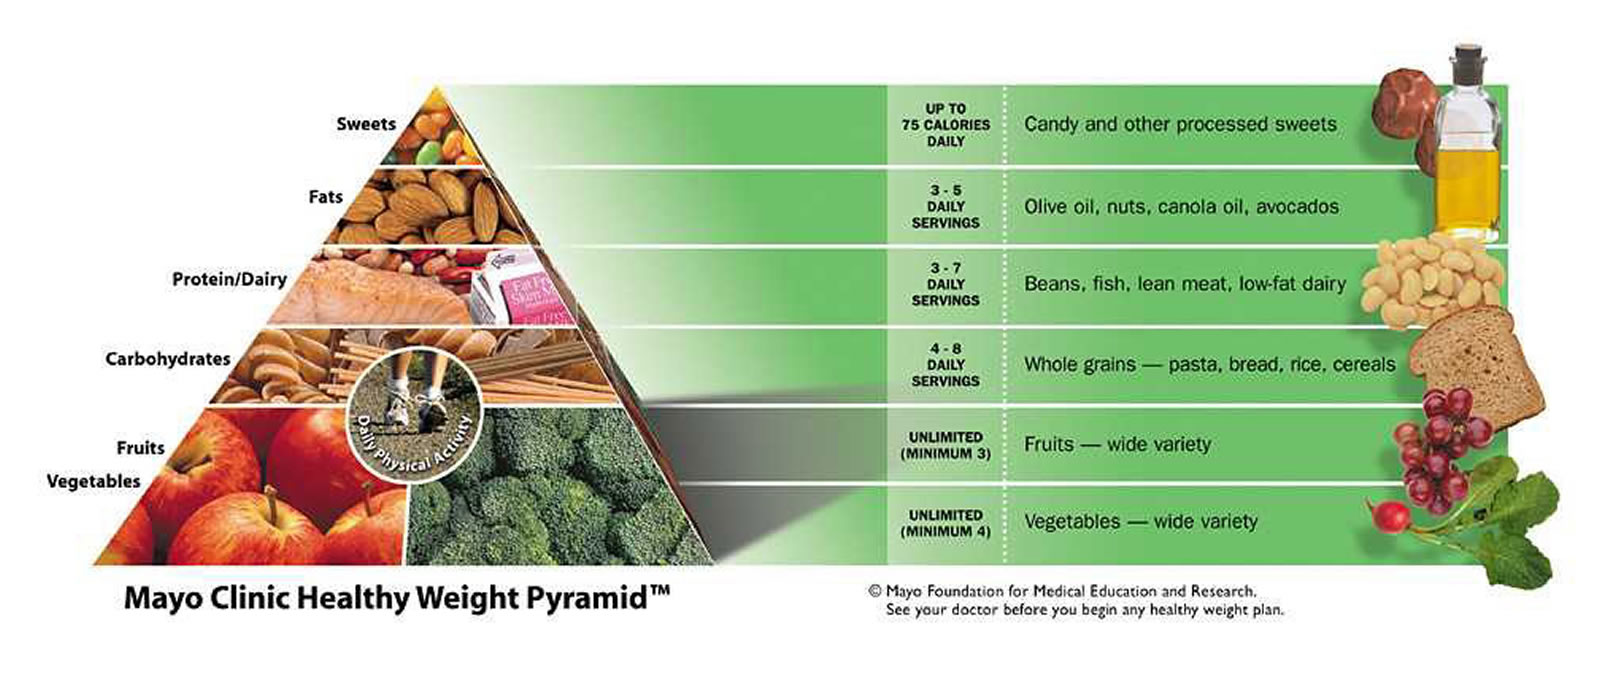
Note: The Mayo Clinic Healthy Weight Pyramid

The Mayo Clinic Healthy Weight Pyramid is a tool to help you lose weight or maintain your weight. The triangular shape shows you where to focus when selecting healthy foods. Eat more foods from the base of the pyramid and fewer from the top.

Sample menu under the Mayo Clinic Healthy Weight Pyramid

This sample menu for a day follows the Mayo Clinic Healthy Weight Pyramid. The sample shows you how to fit in servings from each category in the pyramid without going over 1,200 calories. You can adjust the menu to suit your own tastes and calorie needs.

Sample menu (1,200 calories) 1
Breakfast
3/4 cup hot whole-grain cereal
1 small banana
Calorie-free beverage
Lunch
Tossed salad (2 cups romaine, 1/4 onion, 1/4 cup mushrooms, 1 medium tomato, 1 hard-boiled egg, 1/2 cup low-fat shredded cheddar cheese)
1 whole-wheat dinner roll
1 1/2 teaspoons butter
1/2 cup cubed pineapple
Calorie-free beverage
Dinner
3 ounces seared scallops in 1 teaspoon olive oil
Garlic mashed cauliflower potatoes
1/2 cup beets
Calorie-free beverage
Snack (any time)
2 plums
8 wheat crackers


Nutritional analysis for sample menu
Calories1,178
Total fat34 g
Saturated fat12 g
Monounsaturated fat11 g
Cholesterol256 mg
Sodium1,761 mg
Total carbohydrate157 g
Dietary fiber24 g
Trans fatTrace
Total sugar58 g
Added sugar0 g
Protein61 g


Mayo Clinic Healthy Weight Pyramid servings with the sample menu
Vegetables4
Fruits3
Carbohydrates3 1/2
Protein and dairy3
Fats3
Sweets0

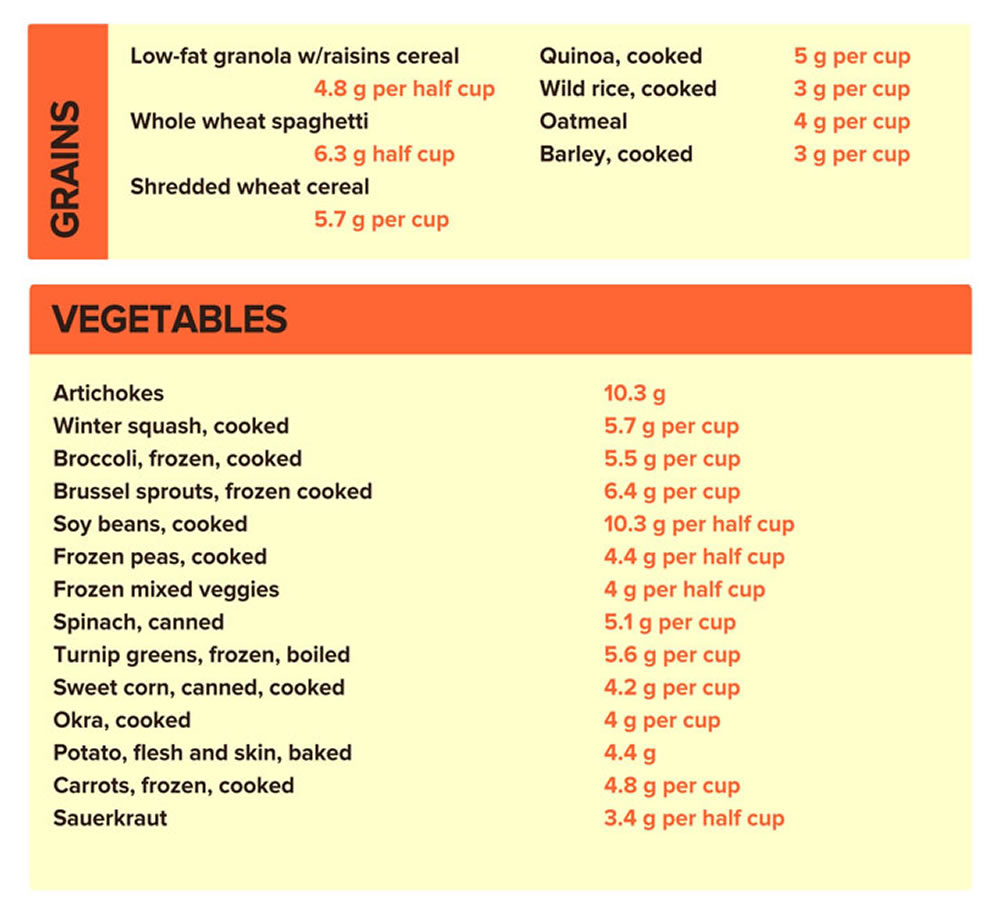
Healthy snacking to help fill you up

If you feel hungry while following the Mayo Clinic Healthy Weight Pyramid, reach for more fruits and vegetables to snack on. Just make sure your fruit is either fresh or canned in water or juice — and that you pour off the liquid before eating.

Eat healthy foods and portions

The base of the Mayo Clinic Healthy Weight Pyramid focuses on generous amounts of healthy foods that contain a smaller number of calories in a large volume of food, particularly fruits and vegetables.

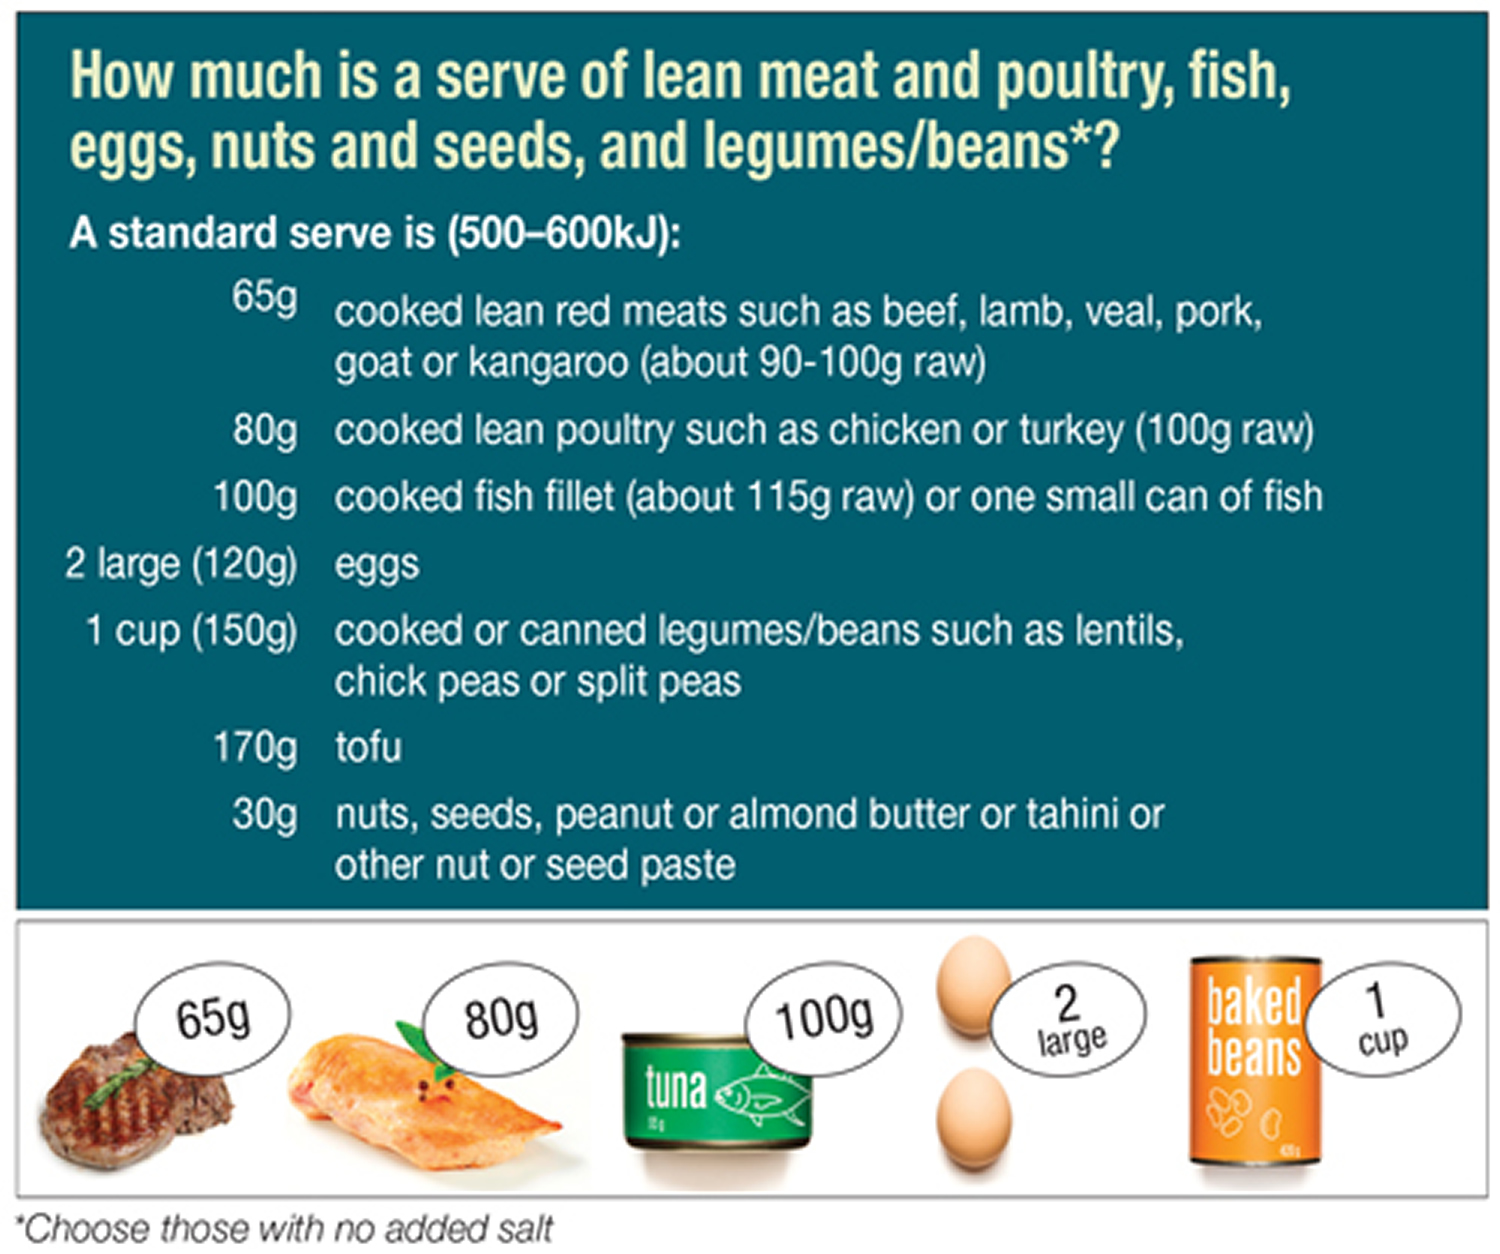
This principle involves eating low-energy-dense foods and can help you lose weight by feeling full on fewer calories. Healthy choices in each of the other food groups in moderate amounts make up the rest of the pyramid — including whole-grain carbohydrates, lean sources of protein such as legumes, fish and low-fat dairy, and heart-healthy unsaturated fats.

The Mayo Clinic Diet teaches you how to estimate portion sizes and plan meals. The diet doesn’t require you to eliminate any foods.

Increase your physical activity

The Mayo Clinic Diet provides practical and realistic ideas for including more physical activity and exercise throughout your day — as well as finding a plan that works for you. The diet recommends getting at least 30 minutes of exercise every day and even more exercise for further health benefits and weight loss. The diet also emphasizes moving more throughout the day, such as taking the stairs instead of an elevator.

Typical menu for the Mayo Clinic Diet Plan

The Mayo Clinic Diet provides several calorie levels. Here’s a look at a typical daily meal plan at the 1,200-calorie-a-day level:

  • Breakfast: 1/2 cup cooked oatmeal with 1 cup milk and 2 tablespoons raisins, 1/4 cup mango, calorie-free beverage.
  • Lunch: Quinoa and sweet potato cakes, tossed salad with fat-free dressing, calorie-free beverage.
  • Dinner: 1 pita pizza, 3/4 cup mixed fruit, calorie-free beverage.
  • Snack: 1 cup sliced bell peppers and 2 tablespoons hummus

You can have sweets — as long as you limit them to 75 calories a day. For practicality, consider thinking of your sweets calories over the course of a week. Have low-fat frozen yogurt or dark chocolate on Monday, and then hold off on any more sweets for a few days.

Before you begin The Mayo Clinic Diet, determine your starting point:

  • Record your initial weight. Weigh yourself at a time and in a manner you’ll be able to use consistently, such as right after getting up in the morning.
  • Determine your body mass index. BMI is a better indicator of body fat than is body weight. See the BMI table in the obesity article to determine your BMI. Write it down for future comparison.
  • Measure your waist. Use a flexible tape and measure around your body just above the highest points on your hipbones. Record your result.

You’ll also want to:

  • Consider your health. If you have health issues, such as diabetes, heart disease, shortness of breath or joint disease, are pregnant, or have any questions about your health, see your doctor before beginning this or any weight management program.
  • Assess your readiness. There’s a good time to start losing weight, and there’s a bad time. You don’t want to put off your start date any longer than necessary, but you don’t want to set yourself up for failure either by starting at a time when you’re facing a lot of obstacles.

Results

  • Weight loss

The Mayo Clinic Diet is designed to help you lose up to 6 to 10 pounds (2.7 to 4.5 kilograms) during the initial two-week phase. After that, you transition into the second phase, where you continue to lose 1 to 2 pounds (0.5 to 1 kilogram) a week until you reach your goal weight. By continuing the lifelong habits that you’ve learned, you can then maintain your goal weight for the rest of your life.

Most people can lose weight on almost any diet plan that restricts calories — at least in the short term. The goal of the Mayo Clinic Diet is to help you keep weight off permanently by making smarter food choices, learning how to manage setbacks and changing your lifestyle.

  • Other health benefits

In general, losing weight by following a healthy, nutritious diet — such as the Mayo Clinic Diet — can reduce your risk of weight-related health problems, such as diabetes, heart disease, high blood pressure and sleep apnea. If you already have any of these conditions, they may be improved dramatically if you lose weight, regardless of the diet plan you follow.

In addition, the healthy habits and kinds of foods recommended on the Mayo Clinic Diet — including lots of vegetables, fruits, whole grains, nuts, beans, fish and healthy fats — can further reduce your risk of certain health conditions. The Mayo Clinic Diet is meant to be positive, active, sustainable and enjoyable, so you can enjoy a happier, healthier life over the long term.

Risks

The Mayo Clinic Diet is generally safe for most adults. It does encourage unlimited amounts of vegetables and fruits. For most people, eating lots of fruits and vegetables is a good thing. However, if you aren’t used to this, you may experience minor, temporary changes in digestion as your body adjusts to this new way of eating.

Also, the natural sugar in fruit does affect your carbohydrate intake — especially if you eat a lot of fruit. This may temporarily raise your blood sugar or certain blood fats. However, this effect is lessened if you are losing weight. If you have diabetes or any other health conditions or concerns, adjust the Mayo Clinic Diet for your situation. For example, people with diabetes should aim for more vegetables than fruits, if possible. It’s a good idea to snack on vegetables, rather than snacking only on fruit.

References
  1. Mayo Foundation for Medical Education and Research. Mayo Clinic Healthy Weight Pyramid: A sample menu. http://www.mayoclinic.org/healthy-lifestyle/nutrition-and-healthy-eating/in-depth/healthy-weight-pyramid/art-20045416
read more
Diet PlanDiet, Food & Fitness

What is the Fast Diet or the 5-2 Fast Diet ?

the 5_2 diet


The 5:2 Fast Diet

Fasting has been practiced for millennia, but, only recently, studies have shed light on its role in adaptive cellular responses that reduce oxidative damage and inflammation, optimize energy metabolism, and bolster cellular protection. In lower fungi, plants, and animals, chronic fasting extends longevity, in part, by reprogramming metabolic and stress resistance pathways. In rodents intermittent or periodic fasting protects against diabetes, cancers, heart disease, and neurodegeneration, while in humans it helps reduce obesity, hypertension, asthma, and rheumatoid arthritis. Thus, fasting has the potential to delay aging and help prevent and treat diseases while minimizing the side effects caused by chronic dietary interventions 1.

In humans, fasting is achieved by ingesting no or minimal amounts of food and caloric beverages for periods that typically range from 12 hours to three weeks 1. In many clinics, patients are now monitored by physicians while undergoing water only or very low calorie (less than 200 kcal/day) fasting periods lasting from 1 week or longer for weight management, and for disease prevention and treatment 1. Fasting is distinct from caloric restriction in which the daily caloric intake is reduced chronically by 20–40%, but meal frequency is maintained.

Starvation is instead a chronic nutritional insufficiency that is commonly used as a substitute for the word fasting, particularly in lower eukaryotes (eukaryote is an organism with complex cells, or a single cell with a complex structure. In these cells the genetic material is organized into chromosomes in the cell nucleus. Animals, plants, algae and fungi are all eukaryotes), but that is also used to define extreme forms of fasting, which can result in degeneration and death.

Scientists now know that fasting results in ketogenesis, promotes potent changes in metabolic pathways and cellular processes such as stress resistance, lipolysis and autophagy, and can have medical applications that in some cases are as effective as those of approved drugs such as the dampening of seizures and seizure-associated brain damage and the amelioration of rheumatoid arthritis 2, 3, 4. Findings from well-controlled investigations in experimental animals, and emerging findings from human studies, indicate that different forms of fasting may provide effective strategies to reduce weight, delay aging, and optimize health.

The Fast Diet also known as the 5:2 Fast Diet is a diet created by the BBC journalist, doctor and author of the best-selling 5:2 diet, Dr. Michael Mosley. The 5:2 diet first reached the mainstream via a BBC Horizon documentary called Eat, Fast and Live Longer, broadcast in August 2012. The diet, which Mosley insists he was initially skeptical about, is not the only interesting discovery he has made through his research. Because of his family history of diabetes and his recent diagnosis for the metabolic syndrome, Dr. Mosley, instead of resorting to medication, decided to get drastic with his diet and see whether he could effect any change.

He ended up testing all sorts of different forms of fasting, including alternate-day fasting. Eventually, Dr. Mosley came up with something that he called the 5:2 Diet, where you eat normally five days a week and eat less calories on the other two days, which is really counting calories two days a week and eating normally the other five days. He stuck to that for about three months. During that period, he lost about 20 pounds of fat, his body fat went down from 28 percent to 20 percent, and his blood glucose went back to normal. However the body of evidence about 5:2 diet and intermittent fasting is limited when compared to other types of weight loss techniques.

The basic concept of intermittent fasting, where for two days of the week you restrict your calorie intake to about 2500 kilojoules (598 kcal) a day, giving your body a break from processing food and a period where your blood is not filled with glucose.

There’s exciting research indicating that intermittent fasting can have a very beneficial impact on your brain function, too. It may even hold the key to preventing Alzheimer’s disease. Dr. Mark Mattson, on his research with genetically engineered mice. They’ve been genetically engineered so they will develop Alzheimer’s or dementia around 1 year which equivalent of about 40 years or 50 years in humans. When he put them on a junk diet, a junk food diet, they developed it at about nine months. But when he put them on an intermittent fasting diet – alternate-day fasting diet in fact – they developed it at around two years, which is equivalent to being 90 years of age.

When he looked into their brains, he discovered that the ones who had been on intermittent fasting diet have grown 40 percent new brain cells particularly in the area associated with memory. He identified this thing called brain-derived neurotrophic factor (BNF), which seems to be driving those changes and also protecting the brains. He’s doing this big study in humans at the moment to see if the same thing happens with fasting humans.

Adaptive responses to fasting in humans

In most mammals, the liver serves as the main reservoir of glucose, which is stored in the form of glycogen. In humans, depending upon their level of physical activity, 12 to 24 hours of fasting typically results in a 20% or greater decrease in serum glucose and depletion of the hepatic glycogen, accompanied by a switch to a metabolic mode in which non-hepatic glucose, fat-derived ketone bodies and free fatty acids are used as energy sources (Figures C and ​A). Whereas most tissues can utilize fatty acids for energy, during prolonged periods of fasting, the brain relies on the ketone bodies β-hydroxybutyrate and acetoacetate in addition to glucose for energy consumption (Figure B). Ketone bodies are produced in hepatocytes from the acetyl-CoA generated from β oxidation of fatty acids released into the bloodstream by adipocytes, and also by the conversion of ketogenic amino acids. After hepatic glycogen depletion, ketone bodies, fat-derived glycerol, and amino acids account for the gluconeogenesis-dependent generation of approximately 80 grams/day of glucose, which is mostly utilized by the brain. Depending on body weight and composition, the ketone bodies, free fatty acids and gluconeogenesis allow the majority of human beings to survive 30 or more days in the absence of any food and allow certain species, such as king penguins, to survive for over 5 months without food 5.

In humans, during prolonged fasting, the plasma levels of 3-β-hydroxybutyrate (b-OHB) are about 5 times those of free fatty acids and acetoacetic acid (AcAc) (Figure A and B). The brain and other organs utilize ketone bodies in a process termed ketolysis, in which acetoacetic acid and 3-β-hydroxybutyrate are converted into acetoacetyl-CoA and then acetyl-CoA. These metabolic adaptations to fasting in mammals are reminiscent of those described earlier for E. coli and yeast, in which acetic acid accumulates in response to food deprivation 6, 7. It will be important to understand how the different carbon sources generated during fasting affect cellular protection and aging and to determine whether glycerol, specific ketone bodies or fatty acids can provide nourishment while reducing cellular aging in mammals, a possibility suggested by beneficial effects of a dietary ketone precursor in a mouse model of Alzheimer’s disease 8. It will also be important to study, in various model organisms and humans, how high intake of specific types of fats (medium- vs. long-chain fatty acids, etc.) in substitution of carbohydrates and proteins influences gluconeogenesis and glucose levels as well as aging and diseases.

Figure A: Concentrations of ketone bodies (acetone, β-hydroxybutyric acid, acetoacetic acid (AcAc)) and plasma free fatty acids (FFA) during 40 days of fasting in humans. Note the more than three orders of magnitude change in β-hydroxybutyrate (b-OHB) and the doubling of free fatty acids (FFA) 9.

ketone bodies during fasting in humans

Fasting and the brain

In mammals, severe caloric restriction/food deprivation results in a decrease in the size of most organs except the brain, and the testicles in male mice 10. From an evolutionary perspective this implies that maintenance of a high level of cognitive function under conditions of food scarcity is of preeminent importance. Indeed, a highly conserved behavioral trait of all mammals is to be active when hungry and sedentary when satiated. In rodents, alternating days of normal feeding and fasting (intermittent fasting) can enhance brain function as indicated by improvements in performance on behavioral tests of sensory and motor function 11 and learning and memory 12. The behavioral responses to intermittent fasting are associated with increased synaptic plasticity and increased production of new neurons from neural stem cells 13.

Particularly interesting with regards to adaptive responses of the brain to limited food availability during human evolution is brain-derived neurotrophic factor (BDNF). The genes encoding brain-derived neurotrophic factor (BDNF) and its receptor TrkB appeared in genomes relatively recently as they are present in vertebrates, but absent from worms, flies and lower species 14. The prominent roles of BDNF in the regulation of energy intake and expenditure in mammals is highlighted by the fact that the receptors for both BDNF and insulin are coupled to the highly conserved PI3 kinase – Akt, and MAP kinase signaling pathways. Studies of rats and mice have shown that running wheel exercise and intermittent fasting increase BDNF expression in several regions of the brain, and that brain-derived neurotrophic factor in part mediates exercise- and intermittent fasting-induced enhancement of synaptic plasticity, neurogenesis and neuronal resistance to injury and disease. Brain-derived neurotrophic factor signaling in the brain may also mediate behavioral and metabolic responses to fasting and exercise including regulation of appetite, activity levels, peripheral glucose metabolism and autonomic control of the cardiovascular and gastrointestinal systems 15, 16.

Hunger is an adaptive response to food deprivation that involves sensory, cognitive and neuroendocrine changes which motivate and enable food seeking behaviors. It has been proposed that hunger-related neuronal networks, neuropeptides and hormones play pivotal roles in the beneficial effects of energy restriction on aging and disease susceptibility. As evidence, when mice in which the hypothalamic ‘hunger peptide’ NPY is selectively ablated are maintained on a CR diet, the ability of CR to suppress tumor growth is abolished 17. The latter study further showed that the ability of caloric restriction to elevate circulating adiponectin levels was also compromised in NPY-deficient mice, suggesting a key role for the central hunger response in peripheral endocrine adaptations to energy restriction. Adiponectin levels increase dramatically in response to fasting; and data suggest roles for adiponectin in the beneficial effects of IF on the cardiovascular system 18. The hunger response may also improve immune function during aging as ghrelin-deficient mice exhibit accelerated thymic involution during aging, and treatment of middle age mice with ghrelin increases thymocyte numbers and improves the functional diversity of peripheral T cell subsets 19. In addition to its actions on the hypothalamus and peripheral endocrine cells, fasting may increase neuronal network activity in brain regions involved in cognition, resulting in the production of BDNF, enhanced synaptic plasticity and improved stress tolerance 20. Thus, hunger may be a critical factor involved in widespread central and peripheral adaptive responses to the challenge of food deprivation for extended time periods.

Our current understanding of the impact of intermittent fasting on the nervous system and cognitive functions is largely inferred from animal studies (see above). Interventional studies to determine the impact of fasting on brain function and neurodegenerative disease processes are lacking After 3–4 month, caloric restriction improved cognitive function (verbal memory) in overweight women 21 and in elderly subjects 22. Similarly, when subjects with mild cognitive impairment were maintained for 1 month on a low glycemic diet, they exhibited improved delayed visual memory, cerebrospinal fluid biomarkers of Aβ metabolism and brain bioenergetics 23. Studies in which cognitive function, regional brain volumes, neural network activity, and biochemical analyses of cerebrospinal fluid are measured in human subjects before and during an extended period of intermittent fasting should clarify the impact of intermittent fasting on human brain structure and function.

Figure B: Brain substrate utilization in three fasting obese volunteers after several weeks of food deprivation. Many studies suggest that human brain cells can survive with little to no glucose, but this has not been clearly demonstrated 24.

brain substrate utilization

Figure C: Intermittent Fasting modifies brain neurochemistry and neuronal network activity in ways that optimize brain function and peripheral energy metabolism. Four brain regions that are particularly important in adaptive responses to Intermittent Fasting include the hippocampus (cognitive processing), striatum (control of body movements), hypothalamus (Hyp, control of food intake and body temperature) and brainstem (control of cardiovascular and digestive systems). The brain communicates with all of the peripheral organs involved in energy metabolism. Intermittent Fasting enhances parasympathetic activity (mediated by the neurotransmitter acetylcholine) in the autonomic neurons that innervate the gut, heart and arteries, resulting in improved gut motility and reduced heart rate and blood pressure. By depleting glycogen from liver cells, fasting results in lipolysis and the generation of ketone bodies resulting in a reduction in body fat. Intermittent Fasting enhances insulin sensitivity of muscle and liver cells, and reduces IGF-1 production. Levels of oxidative stress and inflammation are reduced throughout the body and brain in response to Intermittent Fasting 9.

brain response to intermittent fasting

Fasting and Aging

Clinical and epidemiological data are consistent wit h an ability of fasting to retard the aging process and associated diseases 9. Among the major effects of fasting relevant to aging and diseases are changes in the levels of IGF-1, IGFBP1, glucose, and insulin. Fasting for 3 or more days causes a 30% or more decrease in circulating insulin and glucose, as well as rapid decline in the levels of insulin-like growth factor 1 (IGF-1), the major growth factor in mammals, which together with insulin is associated with accelerated aging and cancer 25. In humans, five days of fasting causes an over 60% decrease in IGF-1and a 5-fold or higher increase in one of the principal IGF-1-inhibiting proteins: IGFBP1 26. This effect of fasting on IGF-1 is mostly due to protein restriction and particularly to the restriction of essential amino acids, but is also supported by calorie restriction since the decrease in insulin levels during fasting promotes reduction in IGF-1 26. Notably, in humans, chronic calorie restriction does not lead to a decrease in IGF-1 unless combined with protein restriction 27. Although extreme dietary interventions during old age may continue to protect from age-related diseases, they could have detrimental effects on the immune system and the ability to respond to certain infectious diseases, wounds and other challenges 28, 29.

Fasting and Cancer

Fasting has the potential for applications in both cancer prevention and treatment. Although no human data are available on the effect of intermittent fasting or periodic fasting in cancer prevention, their effect on reducing IGF-1, insulin and glucose levels, and increasing IGFBP1 and ketone body levels could generate a protective environment that reduces DNA damage and carcinogenesis, while at the same time creating hostile conditions for tumor and pre-cancerous cells. In fact, elevated circulating IGF-1 is associated with increased risk of developing certain cancers 30, 31 and individuals with severe IGF-1deficiency caused by growth hormone receptor deficiency, rarely develop cancer 32, 33, 34.

In a preliminary study of 10 subjects with a variety of malignancies, the combination of chemotherapy with fasting resulted in a decrease in a range of self-reported common side effects caused by chemotherapy compared to the same subjects receiving chemotherapy while on a standard diet 35. The effect of fasting on chemotherapy toxicity and cancer progression is now being tested in clinical trials in both Europe and the US.

Fasting, inflammation and hypertension

In humans, one of the best demonstrations of the beneficial effects of long-term fasting lasting one to 3 weeks is in the treatment of rheumatoid arthritis. In agreement with the results in rodents, there is little doubt that during the period of fasting both inflammation and pain are reduced in rheumatoid arthritis patients 4. However, after the normal diet is resumed, inflammation returns unless the fasting period is followed by a vegetarian diet 36, a combination therapy that has beneficial effects lasting for two years or longer 37. The validity of this approach is supported by four differently controlled studies, including two randomized trials 4. Therefore, fasting combined with a vegetarian diet and possibly with other modified diets provides beneficial effects in the treatment of rheumatoid arthritis. Alternate day intermittent fasting also resulted in significant reductions in serum TNFα and ceramides in asthma patients during a 2 month period 38. The latter study further showed that markers of oxidative stress often associated with inflammation (protein and lipid oxidation) were significantly reduced in response to intermittent fasting. Thus, for many patients able and willing to endure long-term fasting and to permanently modify their diet, fasting cycles would have the potential to not only augment but also replace existing medical treatments.

Water only and other forms of long-term fasting have also been documented to have potent effects on hypertension. An average of 13 days of water only fasting resulted in the achievement of a systolic blood pressure (BP) below 120 in 82% of subjects with borderline hypertension with a mean 20 mm Hg reduction in BP 39. BP remained significantly lower compared to baseline even after subjects resumed the normal diet for an average of 6 days 39. A small pilot study of patients with hypertension (140 mm and above systolic BP) also showed that 10–11 days of fasting caused a 37–60 mm decrease in systolic BP 40. These preliminary studies are promising but underscore the need for larger controlled and randomized clinical studies that focus on periodic fasting strategies that are feasible for a larger portion of the population.

Fasting and the metabolic syndrome

Periodic fasting can reverse multiple features of the metabolic syndrome in humans: it enhances insulin sensitivity, stimulates lipolysis and reduces blood pressure. Body fat and blood pressure were reduced and glucose metabolism improved in obese subjects in response to an alternate day modified fast 41, 42. Overweight subjects maintained for 6 months on a twice weekly intermittent fasting diet in which they consumed only 500–600 calories on the fasting days, lost abdominal fat, displayed improved insulin sensitivity and reduced blood pressure 43. Three weeks of alternate day fasting resulted in reductions in body fat and insulin levels in normal weight men and women 44 and Ramadan fasting (2 meals/day separated by approximately 12 hours) in subjects with MS resulted in decreased daily energy intake, decreased plasma glucose levels and increased insulin sensitivity 45. Subjects undergoing coronary angiography who reported that they fasted regularly exhibited a lower prevalence of diabetes compared to non-fasters 46. Anti-metabolic syndrome effects of intermittent fasting were also observed in healthy young men (BMI of 25) after 15 days of alternate day fasting: their whole-body glucose uptake rates increased significantly, levels of plasma ketone bodies and adiponectin were elevated, all of which occurred without a significant decrease in body weight 47. The latter findings are similar to data from animal studies showing that IF can improve glucose metabolism even with little or no weight change 48. It will be important to determine if longer fasting periods which promote a robust switch to a fat breakdown and ketone body-based metabolism, can cause longer lasting and more potent effects.

How does the Fast Diet work ?

On the 5:2 plan, you cut your food down to one-fourth of your normal daily calories on fasting days (about 600 calories for men and about 500 for women), along with plenty of water and tea. On the other five days of the week, you can eat normally.

If we were to distill the Fast Diet into a single sound-bite, it would all come down to 5:2. That’s five days of normal eating, with little thought to calorie control and a slice of pie for pudding if that’s what you want. Then, on the other two days, you reduce your calorie intake to 500 calories for women and 600 calories for men.

  1. Day 1 Normal
  2. Day 2 Normal
  3. Day 3 FASTING (reduce your calorie intake to 500 calories for women and 600 calories for men)
  4. Day 4 Normal
  5. Day 5 FASTING (reduce your calorie intake to 500 calories for women and 600 calories for men)
  6. Day 6 Normal
  7. Day 7 Normal

Since you are only fasting for two days of your choice each week, and eating normally on the other five days, there is always something new and tasty on the near horizon. In short, it’s easy to comply with a regime that only asks you to restrict your calorie intake occasionally. It recalibrates the diet equation, and stacks the odds in your favour.

It is important to note that this is not a permanent eating program and once your insulin resistance improves and you are normal weight, you can start eating more food as you will have reestablished your body’s ability to burn fat for fuel.

One of the arguments for intermittent fasting is that it mimics the way our ancestors ate. They didn’t have access to food 24/7, and underwent alternating intervals of “feast and famine.” The human body is adapted to this, and research shows that abstaining from food now and then actually optimizes biological function all-around.

Perhaps best of all, intermittent fasting is not something you have to do non-stop for the rest of your life. Most who are insulin/leptin resistant would benefit from doing it continuously until the resistance resolves. However, once your weight is ideal and you have no high blood pressure, abnormal cholesterol ratios, or diabetes, then you can have more meals until or unless the insulin/leptin resistance returns.

the 5_2_diet_plan

How many calories on a non-Fast Day ?

You may have wondered how he came up with the recommendation that women have 500 calories and men have 600 calories on a Fast Day. Dr. Mosley used the rule of thumb that women need 2000 calories and men need 2400 calories per day and on a Fast Day you should eat a quarter of a normal day’s recommended calories. Some of you have also wondered exactly how many calories you should be eating on days when you’re not fasting.

Intermittent Fasting Actually curbs Your Hunger

Many are hesitant to try fasting as they fear they’ll be ravenously hungry all the time. But one of the most incredible side effects of intermittent fasting that we’ve found is the disappearance of hunger and sugar cravings.

Dr. Mosley had the same experience once he began fasting. Others have also contacted him saying they’re astonished to realize that hunger no longer dominates their lives; they’re back in control. Now, you get hungry because your body needs fuel. But the vast majority of people in the world, certainly in the developed world, are eating foods that severely inhibit their ability to produce lipase and use fat as an energy source. Lipase is inhibited because of high insulin levels, and your insulin rises in response to eating foods high in carbohydrates.

If you struggle with food cravings, especially sugar, know that once you make this shift to burning fat instead of sugar as your body’s primary fuel, your hunger for unhealthy foods will vanish, and you will not have to exert enormous amounts of self-discipline to resist unhealthy foods any longer. You will be back in control!

What can you eat on the 5:2 Fast Diet

  • High in healthy fats. Many will benefit from 50-85 percent of their daily calories in the form of healthy fat from avocados, organic grass-fed butter, pastured egg yolks, coconut oil, and raw nuts such as macadamia, pecans, and pine nuts.
  • Moderate amounts of high-quality protein from organically raised, grass-fed or pastured animals. Most will likely not need more than 40 to 70 grams of protein per day.
  • Unrestricted amounts of fresh vegetables.

Intermittent Exercise

Dr. Mosley is also a proponent of high intensity interval training (HIIT), and recently finished a new book called Fast Exercise.

  • Sedentary : Little or no exercise. This level is for someone who does not or cannot incorporate exercise into their daily life (eg drives rather than walks, takes the lift rather than the stairs, has a desk job or restricted mobility).
  • Lightly active : Light exercise or sports 1-3 days per week. This level would include people who incorporate walking and activity into their day to day activities but do not have an exercise regime at such or exercise or play sports fewer than three times a week.
  • Moderately active : Moderate exercise or sports 3-5 days per week. This level is for people who exercise or play very active sports at least 30 minutes non-stop at a time at least three times a week, every week. This is the level for people who keep up a good fitness regime that fits into their daily life.
  • Very active : Hard exercise or sports 6-7 days per week. This level would include serious non-professional athletes actively training for, eg, a triathlon that requires near daily hard exercise for at least an hour at a time.
  • Extremely active : Very hard exercise or sports more than once every day and a physical job. This level is for people doing exercise multiple times per day, at least an hour at a time and with the type of physical job that requires top fitness. This level is not common – most non-professional athletes in serious training will be in the “Very active” level at most.

Optimizing your brain function is yet another amazing benefit of applying these two powerful approaches – intermittent fasting and intermittent exercise. You’re actually able to think clearer, get more done, and be far more efficient. It’s a phenomenal side effect of following this type of program.

Health Effects of a Intermittent Fasting Diet

Dietary restriction has been shown in a variety of animal models to have many health benefits. Fasting, in which food isn’t consumed (but water is), represents the extreme form of restriction. Previous studies in animals and people suggested that periodic cycles of fasting may improve certain metabolic and immune functions. Fasting for 2 or more days, like the 5:2 Diet, however, is difficult for many people, and can have adverse health effects.

Here we review the fascinating and potent effects of different forms of fasting including intermittent fasting (including alternate day fasting, or twice weekly fasting, the 5:2 Diet) and periodic fasting lasting several days or longer every 2 or more weeks.

Fasting, the most extreme form of Dietary Restriction, which entails the abstinence from all food but not water, can be applied in a chronic manner as intermittent fasting or periodically as cycles of prolonged fasting lasting 2 or more days 1. In rodents, intermittent fasting promotes protection against diabetes, cancer, heart disease and neuro-degeneration (Longo and Mattson, 2014). In humans, IF and less severe regimens (e.g. consumption of approximately 500 kcal/day for 2 days a week), have beneficial effects on insulin, glucose, C-reactive protein, and blood pressure (Harvie et al., 2011).

A team led by Dr. Valter Longo at the University of Southern California 49 studied diets designed to mimic the beneficial effects of fasting while minimizing the risks and difficulty associated with complete food restriction. The research was funded in part by National Institutes of Health’s National Institute on Aging. Results were published in Cell Metabolism on July 7, 2015 49.

The team first tested cycles of prolonged fasting in yeast, a single-celled organism. Yeast that were switched back and forth from a nutrient-rich environment to water for several cycles had a longer lifespan and were better able to survive toxin exposure—a marker of increased stress resistance—than yeast not exposed to periodic starvation.

The team next tested a very low-calorie, low-protein diet in mice. The diet was designed to mimic some of the beneficial effects of fasting, including improving markers of longevity and metabolism. Middle-aged mice (16 months old) were fed the diet for 4 consecutive days, followed by 10 days of unlimited access to food. The mice overate during these phases so that their overall calorie intake was similar to mice continuously fed a regular diet.

Mice fed the diet twice a month for several months had various metabolic changes, including lower blood glucose and insulin levels, than mice fed a control diet. These metabolic markers all returned to normal levels during periods of re-feeding. Mice fed the diet had less fat around their organs (known as deep or visceral fat) at 28 months of age. They also had greater bone density at old age and increased nerve cell development in the brain. At the end of life, mice on the diet had fewer tumors and skin lesions than control mice.

The team next conducted a pilot study in a small group of people. Nineteen healthy adults consumed a proprietary plant-based diet that provided between 34% and 54% of the normal caloric intake with at least 9–10% protein, 34–47% carbohydrate, and 44–56% fat. Participants consumed the diet 5 days a month for 3 months (3 cycles), resuming their normal diet at the end of each diet period. A control group of 19 adults ate a normal diet.

People on the diet had improvements in blood glucose and decreased body weight compared to the control group. Those with initially elevated C-reactive protein levels (a marker of heart disease risk) had lower levels, while those with normal levels had no change. Reports of side effects were low and included fatigue, weakness, and headache.

“Strict fasting is hard for people to stick to, and it can also be dangerous, so we developed a complex diet that triggers the same effects in the body,” Longo says. “It’s not a typical diet because it isn’t something you need to stay on.”

More research will be needed to determine the long-term impact of the diet on human health and provide information on when and how such a diet might be applied.

Are there any side effects from intermittent fasting ?

Little is known about possible side effects as no systematic attempt has been made to study this issue. Anecdotal reports of effects include:

  • difficulties sleeping
  • bad breath (a known problem with low carbohydrate diets)
  • irritability
  • anxiety
  • dehydration
  • daytime sleepiness

However, more research would be needed to confirm these side effects and their severity.

If you are fasting, you may want to think about how fasting will impact on your life during your fasting days. You are likely to be very hungry and have less energy and this could affect your ability to function (such as at work), in particular it may affect your ability to exercise which is an important part of maintaining a healthy weight.

Also, intermittent fasting may not be suitable for pregnant women and people with specific health conditions, such as diabetes, or a history of eating disorders.

Because it is a fairly radical approach to weight loss, if you are considering trying IF for yourself, it is wise to speak to your GP first to see if it is safe to do so.

Summary

Based on the existing evidence from animal and human studies described, there is great potential for lifestyles that incorporate periodic fasting (Intermittent Fasting) during adult life to promote optimal health and reduce the risk of many chronic diseases, particularly for those who are overweight and sedentary. Fasting periods lasting longer than 24 hours and particularly those lasting 3 or more days should be done under the supervision of a physician and preferably in a clinic.

Despite 5:2 diet increasing popularity, there is a great deal of uncertainty about the 5:2 diet with significant gaps in the evidence.

For example, it is unclear:

  • What pattern of intermittent fasting is the most effective in improving health outcomes – 5:2, alternative day fasting, or something else entirely different
  • What is the optimal calorie consumption during the fasting days – the 5:2 diet recommends 500 calories for women and 600 for men, but these recommendations seem arbitrary without clear evidence to support them.
  • How sustainable is intermittent fasting in the long-term – would most people be willing to stick with the plan for the rest of their lives ?
References
  1. Fasting: molecular mechanisms and clinical applications. Longo VD, Mattson MP. Cell Metab. 2014 Feb 4; 19(2):181-92. https://www.ncbi.nlm.nih.gov/pubmed/24440038/
  2. Food restriction reduces brain damage and improves behavioral outcome following excitotoxic and metabolic insults. Bruce-Keller AJ, Umberger G, McFall R, Mattson MP. Ann Neurol. 1999 Jan; 45(1):8-15.
  3. Intermittent fasting: a “new” historical strategy for controlling seizures ? Hartman AL, Rubenstein JE, Kossoff EH. Epilepsy Res. 2013 May; 104(3):275-9. https://www.ncbi.nlm.nih.gov/pubmed/23206889/
  4. Fasting followed by vegetarian diet in patients with rheumatoid arthritis: a systematic review. Müller H, de Toledo FW, Resch KL. Scand J Rheumatol. 2001; 30(1):1-10. https://www.ncbi.nlm.nih.gov/pubmed/11252685/
  5. Heterothermy in growing king penguins. Eichhorn G, Groscolas R, Le Glaunec G, Parisel C, Arnold L, Medina P, Handrich Y. Nat Commun. 2011 Aug 16; 2():435. https://www.ncbi.nlm.nih.gov/pubmed/21847109/
  6. Genome-wide screen identifies Escherichia coli TCA-cycle-related mutants with extended chronological lifespan dependent on acetate metabolism and the hypoxia-inducible transcription factor ArcA. Gonidakis S, Finkel SE, Longo VD. Aging Cell. 2010 Oct; 9(5):868-81. https://www.ncbi.nlm.nih.gov/pubmed/20707865/
  7. Replicative and chronological aging in Saccharomyces cerevisiae. Longo VD, Shadel GS, Kaeberlein M, Kennedy B. Cell Metab. 2012 Jul 3; 16(1):18-31. https://www.ncbi.nlm.nih.gov/pubmed/22768836/
  8. A ketone ester diet exhibits anxiolytic and cognition-sparing properties, and lessens amyloid and tau pathologies in a mouse model of Alzheimer’s disease. Kashiwaya Y, Bergman C, Lee JH, Wan R, King MT, Mughal MR, Okun E, Clarke K, Mattson MP, Veech RL. Neurobiol Aging. 2013 Jun; 34(6):1530-9. https://www.ncbi.nlm.nih.gov/pubmed/23276384/
  9. Fasting: molecular mechanisms and clinical applications. Longo VD, Mattson MP. Cell Metab. 2014 Feb 4; 19(2):181-92. https://www.ncbi.nlm.nih.gov/pmc/articles/PMC3946160/
  10. Seminars in medicine of the Beth Israel Deaconess Medical Center. Caloric intake and aging. Weindruch R, Sohal RS. N Engl J Med. 1997 Oct 2; 337(14):986-94. https://www.ncbi.nlm.nih.gov/pubmed/9309105/
  11. Late-onset intermittent fasting dietary restriction as a potential intervention to retard age-associated brain function impairments in male rats. Singh R, Lakhanpal D, Kumar S, Sharma S, Kataria H, Kaur M, Kaur G. Age (Dordr). 2012 Aug; 34(4):917-33. https://www.ncbi.nlm.nih.gov/pubmed/21861096/
  12. Caloric restriction increases learning consolidation and facilitates synaptic plasticity through mechanisms dependent on NR2B subunits of the NMDA receptor. Fontán-Lozano A, Sáez-Cassanelli JL, Inda MC, de los Santos-Arteaga M, Sierra-Domínguez SA, López-Lluch G, Delgado-García JM, Carrión AM. J Neurosci. 2007 Sep 19; 27(38):10185-95. https://www.ncbi.nlm.nih.gov/pubmed/17881524/
  13. Dietary restriction enhances neurotrophin expression and neurogenesis in the hippocampus of adult mice. Lee J, Seroogy KB, Mattson MP. J Neurochem. 2002 Feb; 80(3):539-47. https://www.ncbi.nlm.nih.gov/pubmed/11905999/
  14. Trophic factors: An evolutionary cul-de-sac or door into higher neuronal function ? Chao MV. J Neurosci Res. 2000 Feb 1; 59(3):353-5. https://www.ncbi.nlm.nih.gov/pubmed/10679770/
  15. Energy intake and exercise as determinants of brain health and vulnerability to injury and disease. Mattson MP. Cell Metab. 2012 Dec 5; 16(6):706-22. https://www.ncbi.nlm.nih.gov/pubmed/23168220/
  16. Brain-derived neurotrophic factor as a regulator of systemic and brain energy metabolism and cardiovascular health. Rothman SM, Griffioen KJ, Wan R, Mattson MP. Ann N Y Acad Sci. 2012 Aug; 12, 64:49-63. https://www.ncbi.nlm.nih.gov/pubmed/22548651/
  17. Starvation-induced activation of ATM/Chk2/p53 signaling sensitizes cancer cells to cisplatin. Shi Y, Felley-Bosco E, Marti TM, Orlowski K, Pruschy M, Stahel RA. BMC Cancer. 2012 Dec 4; 12:571. https://www.ncbi.nlm.nih.gov/pubmed/23211021/
  18. Cardioprotective effect of intermittent fasting is associated with an elevation of adiponectin levels in rats. Wan R, Ahmet I, Brown M, Cheng A, Kamimura N, Talan M, Mattson MP. J Nutr Biochem. 2010 May; 21(5):413-7. https://www.ncbi.nlm.nih.gov/pubmed/19423320/
  19. Surgical stress resistance induced by single amino acid deprivation requires Gcn2 in mice. Peng W, Robertson L, Gallinetti J, Mejia P, Vose S, Charlip A, Chu T, Mitchell JR. Sci Transl Med. 2012 Jan 25; 4(118):118ra11. https://www.ncbi.nlm.nih.gov/pubmed/22277968/
  20. Brain-derived neurotrophic factor as a regulator of systemic and brain energy metabolism and cardiovascular health. Rothman SM, Griffioen KJ, Wan R, Mattson MP. Ann N Y Acad Sci. 2012 Aug; 1264():49-63. https://www.ncbi.nlm.nih.gov/pubmed/22548651/
  21. Cognitive effects of a long-term weight reducing diet. Kretsch MJ, Green MW, Fong AK, Elliman NA, Johnson HL. Int J Obes Relat Metab Disord. 1997 Jan; 21(1):14-21. https://www.ncbi.nlm.nih.gov/pubmed/9023595/
  22. Caloric restriction improves memory in elderly humans. Witte AV, Fobker M, Gellner R, Knecht S, Flöel A. Proc Natl Acad Sci U S A. 2009 Jan 27; 106(4):1255-60. https://www.ncbi.nlm.nih.gov/pubmed/19171901/
  23. Diet intervention and cerebrospinal fluid biomarkers in amnestic mild cognitive impairment. Bayer-Carter JL, Green PS, Montine TJ, VanFossen B, Baker LD, Watson GS, Bonner LM, Callaghan M, Leverenz JB, Walter BK, Tsai E, Plymate SR, Postupna N, Wilkinson CW, Zhang J, Lampe J, Kahn SE, Craft S. Arch Neurol. 2011 Jun; 68(6):743-52. https://www.ncbi.nlm.nih.gov/pubmed/21670398/
  24. Cahill GF., Jr Fuel metabolism in starvation. Annu Rev Nutr. 2006;26:1–22. https://www.ncbi.nlm.nih.gov/pubmed/16848698
  25. Extending healthy life span–from yeast to humans. Fontana L, Partridge L, Longo VD. Science. 2010 Apr 16; 328(5976):321-6. https://www.ncbi.nlm.nih.gov/pubmed/20395504/
  26. Nutritional regulation of the insulin-like growth factors. Thissen JP, Ketelslegers JM, Underwood LE. Endocr Rev. 1994 Feb; 15(1):80-101. https://www.ncbi.nlm.nih.gov/pubmed/8156941/
  27. Long-term effects of calorie or protein restriction on serum IGF-1 and IGFBP-3 concentration in humans. Fontana L, Weiss EP, Villareal DT, Klein S, Holloszy JO. Aging Cell. 2008 Oct; 7(5):681-7. https://www.ncbi.nlm.nih.gov/pubmed/18843793/
  28. Calorie restriction and susceptibility to intact pathogens. Kristan DM. Age (Dordr). 2008 Sep; 30(2-3):147-56. https://www.ncbi.nlm.nih.gov/pubmed/19424864/
  29. Enhanced cell proliferation and biosynthesis mediate improved wound repair in refed, caloric-restricted mice. Reed MJ, Penn PE, Li Y, Birnbaum R, Vernon RB, Johnson TS, Pendergrass WR, Sage EH, Abrass IB, Wolf NS. Mech Ageing Dev. 1996 Jul 31; 89(1):21-43. https://www.ncbi.nlm.nih.gov/pubmed/8819104/
  30. Insulin-like growth factor I (IGF-I), IGF-binding protein-3 and prostate cancer risk: epidemiological studies. Chan JM, Stampfer MJ, Giovannucci E, Ma J, Pollak M. Growth Horm IGF Res. 2000 Apr; 10 Suppl A:S32-3. https://www.ncbi.nlm.nih.gov/pubmed/10984284/
  31. Insulin-like growth factor I (IGF-I), IGF-binding protein-3 and the risk of colorectal adenoma and cancer in the Nurses’ Health Study. Giovannucci E, Pollak M, Platz EA, Willett WC, Stampfer MJ, Majeed N, Colditz GA, Speizer FE, Hankinson SE. Growth Horm IGF Res. 2000 Apr; 10 Suppl A():S30-1. https://www.ncbi.nlm.nih.gov/pubmed/10984283/
  32. Growth hormone receptor deficiency is associated with a major reduction in pro-aging signaling, cancer, and diabetes in humans. Guevara-Aguirre J, Balasubramanian P, Guevara-Aguirre M, Wei M, Madia F, Cheng CW, Hwang D, Martin-Montalvo A, Saavedra J, Ingles S, de Cabo R, Cohen P, Longo VD. Sci Transl Med. 2011 Feb 16; 3(70):70ra13. https://www.ncbi.nlm.nih.gov/pubmed/21325617/
  33. Patients with congenital deficiency of IGF-I seem protected from the development of malignancies: a preliminary report. Shevah O, Laron Z. Growth Horm IGF Res. 2007 Feb; 17(1):54-7. https://www.ncbi.nlm.nih.gov/pubmed/17166755/
  34. Congenital IGF1 deficiency tends to confer protection against post-natal development of malignancies. Steuerman R, Shevah O, Laron Z. Eur J Endocrinol. 2011 Apr; 164(4):485-9. https://www.ncbi.nlm.nih.gov/pubmed/21292919/
  35. Fasting and cancer treatment in humans: A case series report. Safdie FM, Dorff T, Quinn D, Fontana L, Wei M, Lee C, Cohen P, Longo VD. Aging (Albany NY). 2009 Dec 31; 1(12):988-1007. https://www.ncbi.nlm.nih.gov/pubmed/20157582/
  36. Controlled trial of fasting and one-year vegetarian diet in rheumatoid arthritis. Kjeldsen-Kragh J, Haugen M, Borchgrevink CF, Laerum E, Eek M, Mowinkel P, Hovi K, Førre O. Lancet. 1991 Oct 12; 338(8772):899-902. https://www.ncbi.nlm.nih.gov/pubmed/1681264/
  37. Vegetarian diet for patients with rheumatoid arthritis–status: two years after introduction of the diet. Kjeldsen-Kragh J, Haugen M, Borchgrevink CF, Førre O. Clin Rheumatol. 1994 Sep; 13(3):475-82. https://www.ncbi.nlm.nih.gov/pubmed/7835013/
  38. Alternate day calorie restriction improves clinical findings and reduces markers of oxidative stress and inflammation in overweight adults with moderate asthma. Johnson JB, Summer W, Cutler RG, Martin B, Hyun DH, Dixit VD, Pearson M, Nassar M, Telljohann R, Maudsley S, Carlson O, John S, Laub DR, Mattson MP. Free Radic Biol Med. 2007 Mar 1; 42(5):665-74. https://www.ncbi.nlm.nih.gov/pubmed/17291990/
  39. Medically supervised water-only fasting in the treatment of borderline hypertension. Goldhamer AC, Lisle DJ, Sultana P, Anderson SV, Parpia B, Hughes B, Campbell TC. J Altern Complement Med. 2002 Oct; 8(5):643-50. https://www.ncbi.nlm.nih.gov/pubmed/12470446/
  40. Medically supervised water-only fasting in the treatment of hypertension. Goldhamer A, Lisle D, Parpia B, Anderson SV, Campbell TC. J Manipulative Physiol Ther. 2001 Jun; 24(5):335-9. https://www.ncbi.nlm.nih.gov/pubmed/11416824/
  41. Alternate day fasting (ADF) with a high-fat diet produces similar weight loss and cardio-protection as ADF with a low-fat diet. Klempel MC, Kroeger CM, Varady KA. Metabolism. 2013 Jan; 62(1):137-43. https://www.ncbi.nlm.nih.gov/pubmed/22889512/
  42. Short-term modified alternate-day fasting: a novel dietary strategy for weight loss and cardioprotection in obese adults. Varady KA, Bhutani S, Church EC, Klempel MC. Am J Clin Nutr. 2009 Nov; 90(5):1138-43. https://www.ncbi.nlm.nih.gov/pubmed/19793855/
  43. The effects of intermittent or continuous energy restriction on weight loss and metabolic disease risk markers: a randomized trial in young overweight women. Harvie MN, Pegington M, Mattson MP, Frystyk J, Dillon B, Evans G, Cuzick J, Jebb SA, Martin B, Cutler RG, Son TG, Maudsley S, Carlson OD, Egan JM, Flyvbjerg A, Howell A. Int J Obes (Lond). 2011 May; 35(5):714-27. https://www.ncbi.nlm.nih.gov/pubmed/20921964/
  44. Alternate-day fasting in nonobese subjects: effects on body weight, body composition, and energy metabolism. Heilbronn LK, Smith SR, Martin CK, Anton SD, Ravussin E. Am J Clin Nutr. 2005 Jan; 81(1):69-73. https://www.ncbi.nlm.nih.gov/pubmed/15640462/
  45. Effect of Ramadan fasting on some indices of insulin resistance and components of the metabolic syndrome in healthy male adults. Shariatpanahi ZV, Shariatpanahi MV, Shahbazi S, Hossaini A, Abadi A. Br J Nutr. 2008 Jul; 100(1):147-51. https://www.ncbi.nlm.nih.gov/pubmed/18053308/
  46. Relation of routine, periodic fasting to risk of diabetes mellitus, and coronary artery disease in patients undergoing coronary angiography. Horne BD, Muhlestein JB, May HT, Carlquist JF, Lappé DL, Bair TL, Anderson JL, Intermountain Heart Collaborative Study Group. Am J Cardiol. 2012 Jun 1; 109(11):1558-62. https://www.ncbi.nlm.nih.gov/pubmed/22425331/
  47. Effect of intermittent fasting and refeeding on insulin action in healthy men. Halberg N, Henriksen M, Söderhamn N, Stallknecht B, Ploug T, Schjerling P, Dela F. J Appl Physiol (1985). 2005 Dec; 99(6):2128-36. https://www.ncbi.nlm.nih.gov/pubmed/16051710/
  48. Intermittent fasting dissociates beneficial effects of dietary restriction on glucose metabolism and neuronal resistance to injury from calorie intake. Anson RM, Guo Z, de Cabo R, Iyun T, Rios M, Hagepanos A, Ingram DK, Lane MA, Mattson MP. Proc Natl Acad Sci U S A. 2003 May 13; 100(10):6216-20. https://www.ncbi.nlm.nih.gov/pubmed/12724520/
  49. A Periodic Diet that Mimics Fasting Promotes Multi-System Regeneration, Enhanced Cognitive Performance, and Healthspan. Brandhorst S, Choi IY, Wei M, Cheng CW, Sedrakyan S, Navarrete G, Dubeau L, Yap LP, Park R, Vinciguerra M, Di Biase S, Mirzaei H, Mirisola MG, Childress P, Ji L, Groshen S, Penna F, Odetti P, Perin L, Conti PS, Ikeno Y, Kennedy BK, Cohen P, Morgan TE, Dorff TB, Longo VD. Cell Metab. 2015 Jul 7;22(1):86-99. doi: 10.1016/j.cmet.2015.05.012. Epub 2015 Jun 18. PMID: 26094889. https://www.ncbi.nlm.nih.gov/pubmed/26094889
read more
Diet PlanDiet, Food & Fitness

What is the Grapefruit Diet and Does It Work For Weight Loss ?

grapefruit juice diet

Grapefruit

The Grapefruit Diet

Grapefruit is a citrus fruit. Grapefruit is a source of vitamin C, fiber, potassium, pectin, and other nutrients. Some components might have antioxidant effects that might help protect cells from damage or reduce cholesterol. It was found that red grapefruit has a higher content of bioactive compounds and a higher antioxidant potential than blond grapefruit.

People use the fruit, oil from the peel, and extracts from the seed as medicine. Grapefruit seed extract is processed from grapefruit seeds and pulp obtained as a byproduct from grapefruit juice production. Vegetable glycerin is added to the final product to reduce acidity and bitterness.

Grapefruit juice is used for high cholesterol, “hardening of the arteries” (atherosclerosis), cancer, a skin disease called psoriasis, and for weight loss and obesity. Diet supplemented with fresh red grapefruit positively influences serum lipid levels of all fractions, especially serum triglycerides and also serum antioxidant activity. The addition of fresh red grapefruit to generally accepted diets could be beneficial for hyperlipidemic, especially hypertriglyceridemic, patients suffering from coronary atherosclerosis.

In an study involving 72 hypercholesterolemic patients, ages 43-71 years who have had a coronary bypass surgery were divided into 3 groups. Groups 1 and 2, were given 100 ml and 200 ml fresh grapefruit juice, whilst group 3 was the control. After 30 consecutive days of fresh grapefruit juice supplemented diets, improvements in serum lipids levels were found in Group 1 and Group 2 versus control group (no changes in the CG were found). The researchers concluded that Diet supplemented with this juice positively influences serum lipid, albumin, and fibrinogen levels and their antioxidant capacities. Addition of fresh grapefruit juice to generally accepted diets may be beneficial for hypercholesterolemic patients 1. What is lacking from this study was the unknown substances in the grapefruit that affect the cholesterol and the antioxidants.

Grapefruit seed extract is taken by mouth for bacterial, viral, and fungal infections including yeast infections.

Grapefruit oil is applied to the skin for muscle fatigue, hair growth, toning the skin, and for acne and oily skin. It is also used for the common cold and flu (influenza). It is not clear how the oil might work for medicinal uses.

Table 1. Nutritional Value of Grapefruit

[Source: United States Department of Agriculture, Agriculture Research Service. USDA Food Composition Databases. 2]

Grapefruit and Weight Loss

The grapefruit diet has outlasted most fad diets. People were even trying it back in the 1930s. Its fans claim that grapefruit contains certain enzymes that, when eaten before other foods, help burn off fat. However, more evidence is needed to rate the effectiveness of eating fresh grapefruit daily increases weight loss in overweight people.

Grapefruit doesn’t burn fat and if you’re hoping that grapefruit will melt fat, you’re going to be disappointed. Remember the cabbage soup diet ? The detox diet ? How about the Hollywood 48 Hour Miracle diet, the Subway diet, the apple cider vinegar diet, the HCG diet and a host of forgettable celebrity diets ?

The truth is, almost any diet will work if it helps you take in fewer calories. Diets do this in four main ways:

  1. Getting you to eat certain “good” foods and/or avoid “bad” ones.
  2. Cutting calories. Swapping high-calorie foods for lower calorie alternatives and reducing portion sizes.
  3. Changing how you behave and the ways you think or feel about food.
  4. Getting to become physically active. Every weight-loss program should include physical activity. Exercise plus calorie restriction can help give your weight loss a boost. Exercise also offers numerous health benefits, including improving your mood, strengthening your cardiovascular system and reducing your risk of heart disease and type 2 diabetes. And exercise is an important factor in maintaining weight loss. People who get regular physical activity may be more likely to maintain their weight loss.

The best diet for losing weight is one that is good for all parts of your body, from your brain to your gut and not just for your waistline and wallet. It is also one you can live with for a long time. In other words, a diet that offers plenty of good tasting and healthy choices, banishes few foods, and doesn’t require an extensive and expensive list of groceries or supplements.

Successful weight loss requires permanent changes to your eating habits and physical activity. This means you need to find a weight-loss approach that you can embrace for life. Even then, you’ll likely always have to remain vigilant about your weight. But combining a healthier diet with more activity is the best way to lose weight and keep it off for the long term.

The classic version of the grapefruit diet meal plan involves:

  • Most versions of the grapefruit diet recommend eating it with every meal.
  • Cutting back on sugar and carbs (including rice, potatoes, and pasta)
  • Avoiding certain foods, such as celery and white onion
  • Eating more of foods that are high in protein, fat, and/or cholesterol (such as eggs, pork, and red meat)
  • Eating grapefruit or grapefruit juice before or with every meal
  • Most variations also cut calories, some to as low as 800 calories per day.
  • On the diet, you also drink 8 glasses of water and 1 cup of coffee daily.

Don’t bother with this diet. Such a limited variety of foods in small portions is the prescription for boredom. It’s exactly the formula to cause most dieters to give up trying to lose weight.

Grapefruit can be part of a healthy weight loss diet because it’s nutritious, not because of any mysterious fat-burning properties. If you’re a grapefruit lover, reap the benefits of this super-nutritious fruit by enjoying a serving before meals. A half grapefruit or a glass of grapefruit juice before meals may help fill you up, so you’ll eat fewer calories at meals and potentially lose weight.

Grapefruit juice and certain Medicines May Not Mix

Grapefruit and grapefruit juice are healthful, providing enough vitamin C, potassium, dietary fiber, and other nutrients to earn the American Heart Association’s “heart-check” mark. That’s the good news. The bad news is that grapefruit juice can interact with dozens of medications, sometimes dangerously.

Grapefruit juice and fresh grapefruit can interfere with the action of some prescription drugs, as well as a few non-prescription drugs. This interaction can be dangerous according to the Food and Drug Administration’s Office of Clinical Pharmacology 3. With most drugs that interact with grapefruit juice, the grapefruit juice increases the absorption of the drug into the bloodstream. When there is a higher concentration of a drug, you tend to have more adverse events.

Many drugs are broken down (metabolized) with the help of a vital enzyme called CYP3A4 in the small intestine 3. Certain substances in grapefruit juice block the action of CYP3A4, so instead of being metabolized, more of the drug enters the bloodstream and stays in the body longer. The result: potentially dangerous levels of the drug in your body 3.

The amount of the CYP3A4 enzyme in the intestine varies from one person to another. Some people have a lot, and others have just a little—so grapefruit juice may affect people differently when they take the same drug.

While scientists have known for several decades that grapefruit juice can cause a potentially toxic level of certain drugs in the body, more recent studies have found that the grapefruit juice has the opposite effect on a few other drugs.

Drinking grapefruit juice several hours before or several hours after you take your medicine may still be dangerous, so it’s best to avoid or limit consuming grapefruit juice or fresh grapefruit when taking certain drugs 3.

Examples of some types of drugs that grapefruit juice can interact with are:

  • some statin drugs to lower cholesterol, such as Zocor (simvastatin), Lipitor (atorvastatin) and Pravachol (pravastatin)
  • some blood pressure-lowering drugs, such as Nifediac and Afeditab (both nifedipine)
  • some organ transplant rejection drugs, such as Sandimmune and Neoral (both cyclosporine)
  • some anti-anxiety drugs, such as BuSpar (buspirone)
  • some anti-arrhythmia drugs, such as Cordarone and Nexterone (both amiodarone)
  • some antihistamines, such as Allegra (fexofenadine)

Grapefruit juice does not affect all the drugs in the categories above. Ask your pharmacist or other health care professional to find out if your specific drug is affected.

There is a well-characterized interaction between grapefruit juice and certain statins (drugs that can lower blood cholesterol). This interaction leads to the effective dose of a statin being increased, with resulting benefits in reducing LDL cholesterol and coronary heart disease. The risk of rhabdomyolysis (side effects of statin drugs causing the breakdown of muscle cells)  is much less in comparison, and overall, there is no need to advise people on statins to avoid drinking grapefruit juice 4.

Eating whole fruits linked to lower risk of type 2 diabetes

Eating more whole fruits, particularly blueberries, grapes, and apples, was significantly associated with a lower risk of type 2 diabetes, according to a new study led by Harvard School of Public Health researchers 5. Greater consumption of fruit juices was associated with a higher risk of type 2 diabetes. The study is the first to look at the effects of individual fruits on diabetes risk.

The researchers’ findings provided a novel evidence suggesting that certain fruits (blueberries, grapes, and apples) may be especially beneficial for lowering diabetes risk.

The researchers examined data gathered between 1984 and 2008 from 187,382 participants in three long-running studies (Nurses’ Health Study, Nurses’ Health Study II, and Health Professionals Follow-up Study). Participants who reported a diagnosis of diabetes, cardiovascular disease, or cancer at enrollment were excluded. Results showed that 12,198 participants (6.5%) developed diabetes during the study period.

The researchers looked at overall fruit consumption, as well as consumption of individual fruits: grapes or raisins; peaches, plums, or apricots; prunes; bananas; cantaloupe; apples or pears; oranges; grapefruit; strawberries; and blueberries. They also looked at consumption of apple, orange, grapefruit, and “other” fruit juices.

People who ate at least two servings each week of certain whole fruits — particularly blueberries, grapes, and apples — reduced their risk for type 2 diabetes by as much as 23% in comparison to those who ate less than one serving per month. Conversely, those who consumed one or more servings of fruit juice each day increased their risk of developing type 2 diabetes by as much as 21%. The researchers found that swapping three servings of juice per week for whole fruits would result in a 7% reduction in diabetes risk.

The fruits’ glycemic index (a measure of how rapidly carbohydrates in a food boost blood sugar) did not prove to be a significant factor in determining a fruit’s association with type 2 diabetes risk. However, the high glycemic index of fruit juice — which passes through the digestive system more rapidly than fiber-rich fruit — may explain the positive link between juice consumption and increased diabetes risk.

The researchers theorize that the beneficial effects of certain individual fruits could be the result of a particular component. Previous studies have linked anthocyanins found in berries and grapes to lowered heart attack risk, for example. But more research is necessary to determine which components in the more beneficial fruits influence diabetes risk.

The researchers further endorsed current recommendations on increasing whole fruits consumption, but not fruit juice, as a measure for diabetes prevention 5.

Grapefruit and Vitamin C

Grapefruit juice can be part of a healthful diet—most of the time. It has vitamin C and potassium—substances your body needs to work properly. Vitamin C, also known as L-ascorbic acid or ascorbate, is a water-soluble vitamin that is naturally present in some foods, added to others, and available as a dietary supplement. Vitamin C is synthesized from D-glucose or D-galactose by many plants and animals. However, humans lack the enzyme L-gulonolactone oxidase required for ascorbic acid synthesis and must obtain vitamin C through food or supplements 6, 7. In the body, it acts as an antioxidant, helping to protect cells from the damage caused by free radicals. Free radicals are compounds formed when our bodies convert the food we eat into energy. People are also exposed to free radicals in the environment from cigarette smoke, air pollution, and ultraviolet light from the sun.

Vitamin C plays a role in collagen, carnitine, hormone, and amino acid formation. It is essential for wound healing and facilitates recovery from burns. Vitamin C is also an antioxidant, supports immune function, and facilitates the absorption of iron 8. High-Dose vitamin C, when taken by intravenous (IV) infusion, vitamin C can reach much higher levels in the blood than when it is taken by mouth. Studies suggest that these higher levels of vitamin C may cause the death of cancer cells in the laboratory. Surveys of healthcare practitioners at United States complementary and alternative medicine conferences in recent years have shown that high-dose IV vitamin C is frequently given to patients as a treatment for infections, fatigue, and cancers, including breast cancer 9.

Vitamin C is required for the biosynthesis of collagen, L-carnitine, and certain neurotransmitters; vitamin C is also involved in protein metabolism 7, 10. Collagen is an essential component of connective tissue, which plays a vital role in wound healing. Vitamin C is also an important physiological antioxidant 11 and has been shown to regenerate other antioxidants within the body, including alpha-tocopherol (vitamin E) 12. Ongoing research is examining whether vitamin C, by limiting the damaging effects of free radicals through its antioxidant activity, might help prevent or delay the development of certain cancers, cardiovascular disease, and other diseases in which oxidative stress plays a causal role. In addition to its biosynthetic and antioxidant functions, vitamin C plays an important role in immune function 12 and improves the absorption of nonheme iron 13, the form of iron present in plant-based foods. Insufficient vitamin C intake causes scurvy, which is characterized by fatigue or lassitude, widespread connective tissue weakness, and capillary fragility 7, 10, 12, 14, 15, 16, 17.

What are some of the Benefits of Vitamin C on Health

Due to its function as an antioxidant and its role in immune function, vitamin C has been promoted as a means to help prevent and/or treat numerous health conditions. Scientists are studying vitamin C to understand how it affects health. Here are several examples of what this research has shown.

Vitamin C and Cancer Prevention

Epidemiologic evidence suggests that people with high intakes of vitamin C from fruits and vegetables might have a lower risk of getting many types of cancer, such as lung, breast, and colon cancer, perhaps, in part, due to their high vitamin C content 7, 10. Vitamin C can limit the formation of carcinogens, such as nitrosamines 10, 18, in vivo; modulate immune response 10, 12; and through its antioxidant function, possibly attenuate oxidative damage that can lead to cancer 7.

Most case-control studies have found an inverse association between dietary vitamin C intake and cancers of the lung, breast, colon or rectum, stomach, oral cavity, larynx or pharynx, and esophagus 10, 12. Plasma concentrations of vitamin C are also lower in people with cancer than controls 10.

However, evidence from prospective cohort studies is inconsistent, possibly due to varying intakes of vitamin C among studies. In a cohort of 82,234 women aged 33–60 years from the Nurses’ Health Study, consumption of an average of 205 mg/day of vitamin C from food (highest quintile of intake) compared with an average of 70 mg/day (lowest quintile of intake) was associated with a 63% lower risk of breast cancer among premenopausal women with a family history of breast cancer 19. Conversely, Kushi and colleagues did not observe a significantly lower risk of breast cancer among postmenopausal women consuming at least 198 mg/day (highest quintile of intake) of vitamin C from food compared with those consuming less than 87 mg/day (lowest quintile of intake) 20. A review by Carr and Frei concluded that in the majority of prospective cohort studies not reporting a significantly lower cancer risk, most participants had relatively high vitamin C intakes, with intakes higher than 86 mg/day in the lowest quintiles 10. Studies reporting significantly lower cancer risk found these associations in individuals with vitamin C intakes of at least 80–110 mg/day, a range associated with close to vitamin C tissue saturation 10, 21, 22.

Evidence from most randomized clinical trials suggests that vitamin C supplementation, usually in combination with other micronutrients, does not affect cancer risk. In the Supplémentation en Vitamines et Minéraux Antioxydants (SU.VI.MAX) study, a randomized, double-blind, placebo-controlled clinical trial,13,017 healthy French adults received antioxidant supplementation with 120 mg ascorbic acid, 30 mg vitamin E, 6 mg beta-carotene, 100 mcg selenium, and 20 mg zinc, or placebo 23. After a median follow-up time of 7.5 years, antioxidant supplementation lowered total cancer incidence in men, but not in women. In addition, baseline antioxidant status was related to cancer risk in men, but not in women 24. Supplements of 500 mg/day vitamin C plus 400 IU vitamin E every other day for a mean follow-up period of 8 years failed to reduce the risk of prostate or total cancer compared with placebo in middle-aged and older men participating in the Physicians’ Health Study II 25. Similar findings were reported in women participating in the Women’s Antioxidant Cardiovascular Study 26. Compared with placebo, supplementation with vitamin C (500 mg/day) for an average of 9.4 years had no significant effect on total cancer incidence or cancer mortality. In a large intervention trial conducted in Linxian, China, daily supplements of vitamin C (120 mg) plus molybdenum (30 mcg) for 5–6 years did not significantly affect the risk of developing esophageal or gastric cancer 27. Moreover, during 10 years of follow-up, this supplementation regimen failed to significantly affect total morbidity or mortality from esophageal, gastric, or other cancers 28. A 2008 review of vitamin C and other antioxidant supplements for the prevention of gastrointestinal cancers found no convincing evidence that vitamin C (or beta-carotene, vitamin A, or vitamin E) prevents gastrointestinal cancers 29. A similar review by Coulter and colleagues found that vitamin C supplementation, in combination with vitamin E, had no significant effect on death risk due to cancer in healthy individuals 30.

At this time, the evidence is inconsistent on whether dietary vitamin C intake affects cancer risk. Results from most clinical trials suggest that modest vitamin C supplementation alone or with other nutrients offers no benefit in the prevention of cancer.

A substantial limitation in interpreting many of these studies is that investigators did not measure vitamin C concentrations before or after supplementation. Plasma and tissue concentrations of vitamin C are tightly controlled in humans. At daily intakes of 100 mg or higher, cells appear to be saturated and at intakes of at least 200 mg, plasma concentrations increase only marginally 10, 31, 21, 20, 27. If subjects’ vitamin C levels were already close to saturation at study entry, supplementation would be expected to have made little or no difference on measured outcomes 21, 32, 33, 34.

Vitamin C and Cancer Treatment

More than fifty years ago, a study suggested that cancer was a disease of changes in connective tissue caused by a lack of vitamin C. In the 1970’s, it was proposed that high-dose ascorbic acid could help build resistance to disease or infection and possibly treat cancer 35.

During the 1970s, studies by Cameron, Campbell, and Pauling suggested that high-dose vitamin C has beneficial effects on quality of life and survival time in patients with terminal cancer 36, 37. However, some subsequent studies—including a randomized, double-blind, placebo-controlled clinical trial by Moertel and colleagues at the Mayo Clinic 38 did not support these findings. In the Moertel study, patients with advanced colorectal cancer who received 10 g/day vitamin C fared no better than those receiving a placebo. The authors of a 2003 review assessing the effects of vitamin C in patients with advanced cancer concluded that vitamin C confers no significant mortality benefit 30.

Emerging research suggests that the route of vitamin C administration (intravenous vs. oral) could explain the conflicting findings 7, 39, 40. Most intervention trials, including the one conducted by Moertel and colleagues, used only oral administration, whereas Cameron and colleagues used a combination of oral and intravenous (IV) administration. Oral administration of vitamin C, even of very large doses, can raise plasma vitamin C concentrations to a maximum of only 220 micromol/L, whereas IV administration can produce plasma concentrations as high as 26,000 micromol/L [46,47]. Concentrations of this magnitude are selectively cytotoxic to tumor cells in vitro 7, 41. Research in mice suggests that pharmacologic doses of IV vitamin C might show promise in treating otherwise difficult-to-treat tumors 42. A high concentration of vitamin C may act as a pro-oxidant and generate hydrogen peroxide that has selective toxicity toward cancer cells 42, 43, 44. Based on these findings and a few case reports of patients with advanced cancers who had remarkably long survival times following administration of high-dose IV vitamin C, some researchers support reassessment of the use of high-dose IV vitamin C as a drug to treat cancer 45, 46, 40, 47, 48. Surveys of healthcare practitioners at United States complementary and alternative medicine conferences in recent years have shown that high-dose IV vitamin C is frequently given to patients as a treatment for infections, fatigue, and cancers, including breast cancer 9.

It is uncertain whether supplemental vitamin C and other antioxidants might interact with chemotherapy and/or radiation 49. Therefore, individuals undergoing these procedures should consult with their oncologist prior to taking vitamin C or other antioxidant supplements, especially in high doses 50, 45.

References
  1. J Agric Food Chem. 2004 Aug 11;52(16):5215-22.Fresh israeli jaffa sweetie juice consumption improves lipid metabolism and increases antioxidant capacity in hypercholesterolemic patients suffering from coronary artery disease: studies in vitro and in humans and positive changes in albumin and fibrinogen fractions. https://www.ncbi.nlm.nih.gov/pubmed/15291499/
  2. United States Department of Agriculture, Agriculture Research Service. USDA Food Composition Databases. https://ndb.nal.usda.gov/ndb/
  3. U.S. Food and Drug Administration. Grapefruit Juice and Medicine May Not Mix. https://www.fda.gov/ForConsumers/ConsumerUpdates/ucm292276.htm
  4. The American Journal of Medicine January 2016, Volume 129, Issue 1, Pages 26–29 . Grapefruit Juice and Statins. http://www.amjmed.com/article/S0002-9343(15)00774-3/fulltext
  5. Harvard University, Harvard School of Public Health. Eating whole fruits linked to lower risk of type 2 diabetes. https://www.hsph.harvard.edu/news/press-releases/eating-whole-fruits-linked-to-lower-risk-of-type-2-diabetes/
  6. Naidu KA: Vitamin C in human health and disease is still a mystery? An overview. Nutr J 2: 7, 2003. https://www.ncbi.nlm.nih.gov/pubmed/14498993?dopt=Abstract
  7. Li Y, Schellhorn HE. New developments and novel therapeutic perspectives for vitamin C. J Nutr 2007;137:2171-84. https://www.ncbi.nlm.nih.gov/pubmed/17884994?dopt=Abstract
  8. Merck Sharp & Dohme Corp., Merck Manual. Vitamin C (Ascorbic Acid). https://www.merckmanuals.com/professional/nutritional-disorders/vitamin-deficiency,-dependency,-and-toxicity/vitamin-c
  9. National Cancer Institute. High-Dose Vitamin C–Patient Version. https://www.cancer.gov/about-cancer/treatment/cam/patient/vitamin-c-pdq#link/_5
  10. Carr AC, Frei B. Toward a new recommended dietary allowance for vitamin C based on antioxidant and health effects in humans. Am J Clin Nutr 1999;69:1086-107. https://www.ncbi.nlm.nih.gov/pubmed/10357726?dopt=Abstract
  11. Proc Natl Acad Sci U S A. 1989 Aug;86(16):6377-81. Ascorbate is an outstanding antioxidant in human blood plasma. https://www.ncbi.nlm.nih.gov/pubmed/2762330%20?dopt=Abstract
  12. Jacob RA, Sotoudeh G. Vitamin C function and status in chronic disease. Nutr Clin Care 2002;5:66-74. https://www.ncbi.nlm.nih.gov/pubmed/12134712?dopt=Abstract
  13. Gershoff SN. Vitamin C (ascorbic acid): new roles, new requirements? Nutr Rev 1993;51:313-26. https://www.ncbi.nlm.nih.gov/pubmed/8108031?dopt=Abstract
  14. Weinstein M, Babyn P, Zlotkin S. An orange a day keeps the doctor away: scurvy in the year 2000. Pediatrics 2001;108:E55. https://www.ncbi.nlm.nih.gov/pubmed/11533373?dopt=Abstract
  15. Wang AH, Still C. Old world meets modern: a case report of scurvy. Nutr Clin Pract 2007;22:445-8. https://www.ncbi.nlm.nih.gov/pubmed/17644699?dopt=Abstract
  16. Institute of Medicine. Food and Nutrition Board. Dietary Reference Intakes for Vitamin C, Vitamin E, Selenium, and Carotenoids. Washington, DC: National Academy Press, 2000. https://www.nap.edu/catalog/9810/dietary-reference-intakes-for-vitamin-c-vitamin-e-selenium-and-carotenoids
  17. Stephen R, Utecht T. Scurvy identified in the emergency department: a case report. J Emerg Med 2001;21:235-7. https://www.ncbi.nlm.nih.gov/pubmed/11604276?dopt=Abstract
  18. Hecht SS. Approaches to cancer prevention based on an understanding of N-nitrosamine carcinogenesis. Proc Soc Exp Biol Med 1997;216:181-91. https://www.ncbi.nlm.nih.gov/pubmed/9349687?dopt=Abstract
  19. Zhang S, Hunter DJ, Forman MR, Rosner BA, Speizer FE, Colditz GA, et al. Dietary carotenoids and vitamins A, C, and E and risk of breast cancer. J Natl Cancer Inst 1999;91:547-56. https://www.ncbi.nlm.nih.gov/pubmed/10088626?dopt=Abstract
  20. Kushi LH, Fee RM, Sellers TA, Zheng W, Folsom AR. Intake of vitamins A, C, and E and postmenopausal breast cancer. The Iowa Women’s Health Study. Am J Epidemiol 1996;144:165-74. https://www.ncbi.nlm.nih.gov/pubmed/8678048?dopt=Abstract
  21. Levine M, Conry-Cantilena C, Wang Y, Welch RW, Washko PW, Dhariwal KR, et al. Vitamin C pharmacokinetics in healthy volunteers: evidence for a recommended dietary allowance. Proc Natl Acad Sci U S A 1996;93:3704-9. https://www.ncbi.nlm.nih.gov/pubmed/8623000?dopt=Abstract
  22. Levine M, Wang Y, Padayatty SJ, Morrow J. A new recommended dietary allowance of vitamin C for healthy young women. Proc Natl Acad Sci U S A 2001;98:9842-6. https://www.ncbi.nlm.nih.gov/pubmed/11504949?dopt=Abstract
  23. Hercberg S, Galan P, Preziosi P, Bertrais S, Mennen L, Malvy D, et al. The SU.VI.MAX Study: a randomized, placebo-controlled trial of the health effects of antioxidant vitamins and minerals. Arch Intern Med 2004;164:2335-42. https://www.ncbi.nlm.nih.gov/pubmed/15557412?dopt=Abstract
  24. Galan P, Briançon S, Favier A, Bertrais S, Preziosi P, Faure H, et al. Antioxidant status and risk of cancer in the SU.VI.MAX study: is the effect of supplementation dependent on baseline levels? Br J Nutr 2005;94:125-32. https://www.ncbi.nlm.nih.gov/pubmed/16115341?dopt=Abstract
  25. Gaziano JM, Glynn RJ, Christen WG, Kurth T, Belanger C, MacFadyen J, et al. Vitamins E and C in the prevention of prostate and total cancer in men: the Physicians’ Health Study II randomized controlled trial. JAMA 2009;301:52-62. https://www.ncbi.nlm.nih.gov/pubmed/19066368?dopt=Abstract
  26. Lin J, Cook NR, Albert C, Zaharris E, Gaziano JM, Van Denburgh M, et al. Vitamins C and E and beta carotene supplementation and cancer risk: a randomized controlled trial. J Natl Cancer Inst 2009;101:14-23. https://www.ncbi.nlm.nih.gov/pubmed/19116389%20?dopt=Abstract
  27. Taylor PR, Li B, Dawsey SM, Li JY, Yang CS, Guo W, et al. Prevention of esophageal cancer: the nutrition intervention trials in Linxian, China. Linxian Nutrition Intervention Trials Study Group. Cancer Res 1994;54(7 Suppl):2029s-31s. https://www.ncbi.nlm.nih.gov/pubmed/8137333?dopt=Abstract
  28. Qiao YL, Dawsey SM, Kamangar F, Fan JH, Abnet CC, Sun XD, et al. Total and cancer mortality after supplementation with vitamins and minerals: follow-up of the Linxian General Population Nutrition Intervention Trial. J Natl Cancer Inst 2009;101:507-18. https://www.ncbi.nlm.nih.gov/pubmed/19318634?dopt=Abstract
  29. Bjelakovic G, Nikolova D, Simonetti RG, Gluud C. Antioxidant supplements for preventing gastrointestinal cancers. Cochrane Database Syst Rev 2008;(3):CD004183. https://www.ncbi.nlm.nih.gov/pubmed/18677777?dopt=Abstract
  30. Coulter I, Hardy M, Shekelle P, Udani J, Spar M, Oda K, et al. Effect of the supplemental use of antioxidants vitamin C, vitamin E, and coenzyme Q10 for the prevention and treatment of cancer. Evidence Report/Technology Assessment Number 75. AHRQ Publication No. 04-E003. Rockville, MD: Agency for Healthcare Research and Quality, 2003. https://www.ncbi.nlm.nih.gov/pubmed/15523748?dopt=Abstract
  31. Padayatty SJ, Sun H, Wang Y, Riordan HD, Hewitt SM, Katz A, Wesley RA, Levine M. Vitamin C pharmacokinetics: implications for oral and intravenous use. Ann Intern Med 2004;140:533-7. https://www.ncbi.nlm.nih.gov/pubmed/15068981?dopt=Abstract
  32. Levine M, Rumsey SC, Daruwala R, Park JB, Wang Y. Criteria and recommendations for vitamin C intake. JAMA 1999;281:1415-23. https://www.ncbi.nlm.nih.gov/pubmed/10217058?dopt=Abstract
  33. Padayatty SJ, Levine M. Vitamins C and E and the prevention of preeclampsia. N Engl J Med 2006;355:1065. https://www.ncbi.nlm.nih.gov/pubmed/16957157?dopt=Abstract
  34. Padayatty SJ, Levine M. Antioxidant supplements and cardiovascular disease in men. JAMA 2009;301:1336. https://www.ncbi.nlm.nih.gov/pubmed/19336705?dopt=Abstract
  35. National Cancer Institute. High-Dose Vitamin C – Health Professional Version. https://www.cancer.gov/about-cancer/treatment/cam/hp/vitamin-c-pdq#section/_14
  36. Cameron E, Campbell A. The orthomolecular treatment of cancer. II. Clinical trial of high-dose ascorbic acid supplements in advanced human cancer. Chem Biol Interact 1974;9:285-315. https://www.ncbi.nlm.nih.gov/pubmed/4430016%20?dopt=Abstract
  37. Cameron E, Pauling L. Supplemental ascorbate in the supportive treatment of cancer: prolongation of survival times in terminal human cancer. Proc Natl Acad Sci U S A 1976;73:3685-9. https://www.ncbi.nlm.nih.gov/pubmed/1068480?dopt=Abstract
  38. Moertel CG, Fleming TR, Creagan ET, Rubin J, O’Connell MJ, Ames MM. High-dose vitamin C versus placebo in the treatment of patients with advanced cancer who have had no prior chemotherapy. A randomized double-blind comparison. N Engl J Med 1985;312:137-41. https://www.ncbi.nlm.nih.gov/pubmed/3880867?dopt=Abstract
  39. Bruno EJ Jr, Ziegenfuss TN, Landis J. Vitamin C: research update. Curr Sports Med Rep 2006;5:177-81. https://www.ncbi.nlm.nih.gov/pubmed/16830410?dopt=Abstract
  40. Padayatty SJ, Riordan HD, Hewitt SM, Katz A, Hoffer LJ, Levine M. Intravenously administered vitamin C as cancer therapy: three cases. CMAJ 2006;174:937-42. https://www.ncbi.nlm.nih.gov/pubmed/16567755%20?dopt=Abstract
  41. Shekelle P, Morton S, Hardy M. Effect of supplemental antioxidants vitamin C, vitamin E, and coenzyme Q10 for the prevention and treatment of cardiovascular disease. Evidence Report/Technology Assessment No. 83 AHRQ Publication No. 03-E043. Rockville, MD: Agency for Healthcare Research and Quality, 2003. https://www.ncbi.nlm.nih.gov/pubmed/15040141?dopt=Abstract
  42. Chen Q, Espey MG, Sun AY, Pooput C, Kirk KL, Krishna MC, et al. Pharmacologic doses of ascorbate act as a prooxidant and decrease growth of aggressive tumor xenografts in mice. Proc Natl Acad Sci U S A 2008;105:11105-9. https://www.ncbi.nlm.nih.gov/pubmed/18678913?dopt=Abstract
  43. Chen Q, Espey MG, Krishna MC, Mitchell JB, Corpe CP, Buettner GR, et al. Pharmacologic ascorbic acid concentrations selectively kill cancer cells: action as a pro-drug to deliver hydrogen peroxide to tissues. Proc Natl Acad Sci U S A 2005;102:13604-9. https://www.ncbi.nlm.nih.gov/pubmed/16157892?dopt=Abstract
  44. Chen Q, Espey MG, Sun AY, Lee JH, Krishna MC, Shacter E, et al. Ascorbate in pharmacologic concentrations selectively generates ascorbate radical and hydrogen peroxide in extracellular fluid in vivo. Proc Natl Acad Sci U S A 2007;104:8749-54. https://www.ncbi.nlm.nih.gov/pubmed/17502596?dopt=Abstract
  45. National Cancer Institute. High-Dose Vitamin C –Health Professional Version. https://www.cancer.gov/about-cancer/treatment/cam/hp/vitamin-c-pdq
  46. Frei B, England L, Ames BN. Ascorbate is an outstanding antioxidant in human blood plasma. Proc Natl Acad Sci U S A 1989;86:6377-81. https://www.ncbi.nlm.nih.gov/pubmed/2762330%20?dopt=Abstract
  47. Chen Q, Espey MG, Sun AY, Pooput C, Kirk KL, Krishna MC, et al. Pharmacologic doses of ascorbate act as a prooxidant and decrease growth of aggressive tumor xenografts in mice. Proc Natl Acad Sci U S A 2008;105:11105-9.https://www.ncbi.nlm.nih.gov/pubmed/18678913?dopt=Abstract
  48. Levine M, Espey MG, Chen Q. Losing and finding a way at C: new promise for pharmacologic ascorbate in cancer treatment. Free Radic Biol Med 2009;47:27-9. https://www.ncbi.nlm.nih.gov/pubmed/19361554?dopt=Abstract
  49. Seifried HE, Anderson DE, Sorkin BC, Costello RB. Free radicals: the pros and cons of antioxidants. Executive summary report. J Nutr 2004;134:3143S-63S. https://www.ncbi.nlm.nih.gov/pubmed/15514289?dopt=Abstract
  50. Natural Medicines Comprehensive Database. Vitamin C. http://naturaldatabase.therapeuticresearch.com/home.aspx?cs=&s=ND
read more
Diet PlanDiet, Food & Fitness

What is the DASH Diet ?

DASH diet eating plan

The DASH Diet

DASH stands for Dietary Approaches to Stop Hypertension is similar to a Mediterranean-type diet 1. DASH diet is an eating plan that is based on research studies sponsored by the National Heart, Lung, and Blood Institute 2. The DASH diet is a lifelong approach to healthy eating that’s designed to help treat or prevent high blood pressure (hypertension). The DASH diet encourages you to reduce the sodium in your diet and eat a variety of foods rich in nutrients that help lower blood pressure, such as potassium, calcium and magnesium and eating foods that are low in saturated fat, total fat, and cholesterol, and high in fruits, vegetables, and low fat dairy foods 3.

DASH Diet is a flexible and balanced eating plan that helps you create a heart-healthy eating style for life.

The DASH diet eating plan requires no special foods and has no hard-to-follow recipes. It simply calls for a certain number of daily servings from various food groups to provide your daily and weekly nutritional goals. The Dietary Approaches to Stop Hypertension (DASH) diet recommends 4:

  • Grains and grain products: 7–8 servings per day, more than half of which are whole-grain foods
  • Fruits: 4–5 servings per day
  • Vegetables: 4–5 servings per day
  • Low-fat or non-fat dairy foods: 2–3 servings per day
  • Lean meats, fish, poultry: 6 or less servings or fewer per day
  • Nuts, seeds, and legumes: 4–5 servings per week
  • Added fats and oils: 2–3 servings per day
  • Sweets: 5 or less servings per week
  • Salt (sodium): 1,500 milligrams (mg) sodium lowers blood pressure even further than 2,300 mg sodium daily.
  • Limiting foods that are high in saturated fat, such as fatty meats, full-fat dairy products, and tropical oils such as coconut, palm kernel and palm oils
  • Limiting sugar-sweetened beverages and sweets.

The DASH diet eating plan includes vegetables, whole grains, poultry, fish, and nuts, and has low amounts of fats, red meats, sweets, and sugared beverages. It is also high in potassium, calcium and magnesium, as well as protein and fiber. The number of servings depends on the number of calories you’re allowed each day. Your calorie level depends on your age, sex, the amount of lean body mass (muscular, athletic, average or overweight), height and, especially, how active you are. Think of this as an energy balance system—if you want to maintain your current weight, you should take in only as many calories as you burn by being physically active. If you need to lose weight, eat fewer calories than you burn or increase your activity level to burn more calories than you eat.

The DASH dietary approach has been shown to lower blood pressure, but little has been published regarding weight loss 1. In fact, a systematic review and meta-analysis on observational prospective studies on the effects of Dietary Approaches to Stop Hypertension (DASH)-style diet, showed that the DASH diet can significantly protect against cardiovascular diseases, coronary heart disease, stroke, and heart failure risk by 20%, 21%, 19% and 29%, respectively 5, 6.

Blood pressure is usually measured in millimeters of mercury (mmHg) and is recorded as two numbers—systolic pressure (as the heart beats) “over” diastolic pressure (as the heart relaxes between beats)—for example, 120/80 mmHg. Both numbers in a blood pressure test are important, but for people who are age 50 or older, systolic pressure gives the most accurate diagnosis of high blood pressure. Systolic pressure is the top number in a blood pressure reading. It is high if it is 140 mmHg or above 7.

High blood pressure is blood pressure higher than 140/90 mmHg and prehypertension is blood pressure between 120/80 and 139/89 mmHg. Prehypertension means that you don’t have high blood pressure now, but are likely to develop it in the future unless you adopt the healthy lifestyle. High blood pressure is dangerous because it makes your heart work too hard, hardens the walls of your arteries, and can cause the brain to hemorrhage or the kidneys to function poorly or not at all. If not controlled, high blood pressure can lead to heart and kidney disease, stroke and blindness.

Being overweight or obese increases your risk of developing high blood pressure. In fact, your blood pressure rises as your body weight increases. Losing even 10 pounds can lower your blood pressure and losing weight has the biggest effect on those who are overweight and already have hypertension. Overweight and obesity are also risk factors for heart disease. And being overweight or obese increases your chances of developing high blood cholesterol and diabetes—two
more risk factors for heart disease.

The original DASH trial 8 consisted of 459 subjects with systolic blood pressures <160 mm Hg and diastolic blood pressures between 80 and 95 mm Hg. For three weeks, all participants were fed a control diet low in fruits, vegetables, and dairy products, and with a fat content typical of an American diet (37% of daily caloric intake). During the following eight weeks, the participants were randomized to one of three diets: the control diet, a diet rich in fruits and vegetables, or the DASH Diet.

The DASH Diet was not low in sodium (salt), but still reduced blood pressure. A meta-analysis of 56 randomized, controlled trials that included over 3,500 participants did not support universal sodium restriction, but instead only recommended dietary sodium restriction in the elderly 9.

The DASH Diet reduced systolic blood pressure by 5.5 mm Hg and diastolic blood pressure by 3.3 mm Hg, as compared with controls. Subgroup analysis showed that African Americans and those with hypertension had the greatest reduction in blood pressure 8 . The DASH diet results might be applied to a larger group due to the heterogeneous population: half of the participants were women, 60% were African American, and 37% had household incomes of <$30,000 per year. One limitation of applying the DASH Diet to the general population is that the study was carried out in a very controlled setting, where all the meals were prepared for the subjects, and thus no comments may be made regarding attrition rates for the diet.

By following the DASH diet, you may be able to reduce your blood pressure by a few points in just two weeks. Over time, your systolic blood pressure could drop by eight to 14 points, which can make a significant difference in your health risks.

Salt or sodium is a mineral that’s essential for life. Table salt is a combination of two minerals — about 40% sodium and 60% chloride. Salt or sodium is regulated by your kidneys, and it helps control your body’s fluid balance. It also helps send nerve impulses and affects muscle function. High levels of salt in your diet can increase blood pressure. High blood pressure is known as the “silent killer” because its symptoms are not always obvious. It’s one of the major risk factors for heart disease, the No. 1 killer worldwide. Ninety percent of American adults are expected to develop high blood pressure over their lifetimes. Because high blood pressure is an important risk factor for stroke, and strokes are detrimental to cognitive health, excessive salt intake is harmful for your brain health. Most of the salt that you eat is added to processed foods. More than 70% of the sodium you consume comes from packaged, prepared and restaurant foods. The rest of the sodium in the diet occurs naturally in food (about 15 percent) or is added when we’re cooking food or sitting down to eat (about 11 percent). The American Heart Association recommends no more than 2,300 milligrams (mg) a day and moving toward an ideal limit of no more than 1,500 mg per day for most adults. On average, Americans eat more than 3,400 milligrams of sodium each day — much more than the American Heart Association and other health organizations recommend. Because the average American eats so much excess sodium, even cutting back by 1,000 milligrams a day can significantly improve blood pressure and heart health. One estimate suggested that if the U.S. population dropped its sodium intake to 1,500 mg/day (1/2 teaspoon salt), overall blood pressure could decrease by 25.6%, with an estimated $26.2 billion in health care savings. Another estimate projected that achieving this goal would reduce cardiovascular disease deaths by anywhere from 500,000 to nearly 1.2 million over the next decade.

Here are the approximate amounts of sodium in a given amount of salt:

  • 1/4 teaspoon salt = 575 mg sodium
  • 1/2 teaspoon salt = 1,150 mg sodium
  • 3/4 teaspoon salt = 1,725 mg sodium
  • 1 teaspoon salt = 2,300 mg sodium

The body needs only a small amount of sodium (less than 500 milligrams per day) to function properly. That’s a mere smidgen — the amount in less than ¼ teaspoon. Very few people come close to eating less than that amount. Plus, healthy kidneys are great at retaining the sodium that your body needs.

Table 1. Daily Nutrient Goals Used in the DASH Studies (for a 2,100 Calorie Eating Plan)

Total fat: 27% of caloriesSodium: 2,300 mg*
Saturated fat: 6% of caloriesPotassium: 4,700 mg
Protein: 18% of caloriesCalcium: 1,250 mg
Carbohydrate: 55% of caloriesMagnesium: 500 mg
Cholesterol: 150 mgFiber: 30 g

Footnote: 1,500 mg sodium* was a lower goal tested and found to be even better for lowering blood pressure. It was particularly effective for middle-aged and older individuals, African Americans, and those who already had high blood pressure. The American Heart Association recommends no more than 2,300 milligrams (mg) a day and moving toward an ideal limit of no more than 1,500 mg per day for most adults. On average, Americans eat more than 3,400 milligrams of sodium each day — much more than the American Heart Association and other health organizations recommend. Because the average American eats so much excess sodium, even cutting back by 1,000 milligrams a day can significantly improve blood pressure and heart health.

Abbreviations: g = grams; mg = milligrams

[Source 10 ].

Another DASH diet called DASH-Sodium — calls for cutting back sodium (salt) to 1,500 milligrams a day (about 2/3 teaspoon). Studies of people on the DASH-Sodium plan lowered their blood pressure as well.

To further investigate the effects of sodium restriction, the DASH-Sodium Trial 11 looked at the effect on blood pressure of a reduced dietary sodium intake as participants followed either the DASH eating plan or an eating plan typical of what many Americans consume. This second study involved 412 participants. Participants were randomly assigned to one of the two eating plans and then followed for a month at each of the three sodium levels. The three sodium levels were a higher intake of about 3,300 milligrams per day (the level consumed by many Americans), an intermediate intake of about 2,300 milligrams per day, and a lower intake of about 1,200 milligrams per day. Results showed that reducing dietary sodium lowered blood pressure for both eating plans. At each sodium level, blood pressure was lower on the DASH eating plan than on the other eating plan. Additionally, there was no significant difference between high (3,300 milligrams per day) and intermediate sodium (2,300 milligrams per day) intake on diastolic blood pressure for those on the DASH Diet. The greatest blood pressure reductions were for the DASH eating plan at the sodium intake of 1,200 milligrams per day. Those with high blood pressure saw the greatest reductions, but those with prehypertension also had large decreases 11. The DASH Diet can reduce systolic blood pressure by 5.5 mm Hg and diastolic blood pressure by 3.3 mm Hg. However, the effect of sodium reduction on hypertension remains controversial. Lowering sodium to the levels of 1.2 g/day, as achieved in the lowest sodium intake group of the DASH-Sodium Trial, would be nearly impossible without changes in the food industry, as 75% of sodium intake comes from additions made in processing 12.

Detailed analysis showed that the DASH diet and reduced sodium intake reduced blood pressure for all the population subgroups studied. The following list shows the average blood pressure reduction for key subgroups:

  • For those with hypertension: 12/6 mm Hg (systolic/diastolic); for those without hypertension, 7/4 mm Hg.
  • For those over age 45, 12/6 mm Hg; for those 45 or younger, 6/3 mm Hg.
  • For women, 11/5 mm Hg; for men, 7/4 mm Hg.
  • For African Americans, 10/5 mm Hg; for non-African Americans, 8/4 mm Hg.

Other results include:

  • Compared with the typical American diet, the DASH diet alone (at the higher sodium level) reduced blood pressure by about 6/3 mm Hg for African Americans, and 6/2 mm Hg for other races.
  • For those with hypertension, reductions from the DASH diet alone were 7/3 mm Hg; and for those without hypertension, the reductions were 5/3 mm Hg. The effects of sodium reduction appeared in all subgroups and were greater for those who ate the typical American diet, compared with those on the DASH diet.
  • The effects from sodium reduction were particularly great for those with hypertension, African Americans, women, and those over age 45. Sodium reduction in those eating the control diet resulted in lower systolic and diastolic pressures by 8.3 mm Hg and 4.4 mm Hg, respectively, in hypertensives, and 5.4 and 2.8 mm Hg, respectively, in non-hypertensives.

“The blood pressure reductions achieved from this combination came in only 4 weeks and persisted through the duration of the study”, said Dr. Denise Simons-Morton, Leader of the NHLBI Prevention Scientific Research Group and a DASH coauthor 13.

Both versions of the DASH diet include lots of whole grains, fruits, vegetables and low-fat dairy products. The DASH diet also includes some fish, poultry and legumes, and encourages a small amount of nuts and seeds a few times a week.

The DASH diet generally includes about 2,000 calories a day. If you’re trying to lose weight, you may need to eat fewer calories. You may also need to adjust your serving goals based on your individual circumstances — something your health care team can help you decide.

Studies showed that DASH lowers high blood pressure and improves levels of cholesterol. This reduces your risk of getting heart disease.

Because the DASH diet is a healthy way of eating, it offers health benefits besides just lowering blood pressure. The DASH diet is also in line with dietary recommendations to prevent osteoporosis, cancer, heart disease, stroke and diabetes.

While the DASH diet is not a weight-loss program, you may indeed lose unwanted pounds because it can help guide you toward healthier food choices. A recent study showed that people can lose weight while following the DASH eating plan and lowering their sodium intake. In a randomized trial of 810 participants called the PREMIER Study 14, 15, who were placed into three groups to lower blood pressure, lose weight, and improve health. The groups included:

  1. Advice-only group received a 30-minute individual session with a nutritionist, which did not include counseling on how to make behavior changes.
  2. Established treatment plan, including counseling for 6 months to keep track of their diet, including calorie and sodium consumption, and their physical activity.
  3. Established treatment plan, plus counseling and use of the DASH diet.

After 6 months, blood pressure levels declined in all three groups. The two groups that received counseling and followed a treatment plan had more weight loss than the advice-only group. However, participants in the established treatment plan who followed the DASH diet had the greatest improvement in their blood pressure 14, 15.

By paying close attention to food labels when you shop, you can consume less sodium. Sodium is found naturally in many foods. But processed foods account for most of the salt and sodium that Americans consume. Processed foods that are high in salt include regular canned vegetables and soups, frozen dinners, lunch meats, instant and ready-to-eat cereals, and salty chips and other snacks.

Food labels sodium content
Food labels sodium content: The frozen peas. The canned peas have three times more sodium than the frozen peas.

You can eat red meat, sweets and fats in small amounts. The DASH diet is low in saturated fat, cholesterol and total fat.

Because the DASH diet is a healthy way of eating, it offers health benefits besides just lowering blood pressure. The DASH diet is also in line with dietary recommendations to prevent osteoporosis, cancer, heart disease, stroke and diabetes.

Health Benefits of DASH Diet

  • Following the DASH diet will provide all the nutrients you need.
  • It is safe for both adults and children.
  • The diet is flexible enough to follow if you are vegetarian, vegan, or gluten-free.
  • It is low in fat and high in fiber, an eating style that is recommended for everyone.

The DASH diet sets the standard for a healthy diet. It has been widely studied and has many health benefits. Following this diet plan may help:

  • Lower high blood pressure 16
  • Reduce the risk for heart disease, heart failure, and stroke 5, 6
  • Help prevent or control type 2 diabetes 17
  • Improve cholesterol levels
  • Reduce the chance of kidney stones

Can the DASH diet promote Weight Loss ?

The DASH eating plan was not designed to promote weight loss. But it is rich in low-calorie foods such as fruits and vegetables. Therefore, the DASH diet eating plan can be used to help you lose weight. To lose weight, follow the DASH diet eating plan and try to reduce your total daily calories gradually. Find out your daily calorie needs or goals use these free and useful online tools and apps:

  • To find out about your body mass index (BMI), you can use a FREE online BMI calculators from the Centers for Disease Control and Prevention (CDC) – for Adults 18 and for Children 19

BMI Calculator Adults. https://www.cdc.gov/healthyweight/assessing/bmi/adult_BMI/english_bmi_calculator/bmi_calculator.html

BMI Calculator Children. https://nccd.cdc.gov/dnpabmi/Calculator.aspx

  • To find out about how many calories you should eat to lose weight according to your weight, age, sex, height and physical activity, you can use a FREE online app Body Weight Planner 20

Body Weight Planner. https://www.supertracker.usda.gov/bwp/index.html

  • To find out about the 5 Food Groups you should have on your plate for a meal, you can use a FREE online app ChooseMyPlate 21

ChooseMyPlate. https://www.choosemyplate.gov/

  • To find out What and How Much To Eat, you can use a FREE, award-winning, state-of-the-art, online diet and activity tracking tool called SuperTracker 22 from the United States Department of Agriculture Center for Nutrition Policy and Promotion 22. This free application empowers you to build a healthier diet, manage weight, and reduce your risk of chronic diet-related diseases. You can use SuperTracker 22 to determine what and how much to eat; track foods, physical activities, and weight; and personalize with goal setting, virtual coaching, and journaling.

SuperTracker website: https://supertracker.usda.gov

You can make your meals lower in calories by replacing high-calorie foods with more fruits and vegetables and that also will make it easier for you to reach your DASH eating plan goals.

What Foods To Eat

  • Fruits
  • Vegetables
  • Whole-grains
  • Low-fat dairy products
  • Skinless poultry and fish
  • Nuts and legumes
  • Non-tropical vegetable oils

What Foods to Reduce or Avoid

  • Saturated and trans fats
  • Sodium (salt)
  • Red meat (if you do eat red meat, compare labels and select the leanest cuts available)
  • Sweets and sugar-sweetened beverages
  • Alcohol and caffeine
  • Processed foods, which are often high in fat, salt, and sugar

Drinking too much alcohol can increase blood pressure. It also can harm the liver, brain, and heart. Alcoholic drinks also contain calories, which matters if you are trying to lose weight. The Dietary Guidelines for Americans recommends that men limit alcohol to no more than two drinks a day and women to one or less.

The DASH diet doesn’t address caffeine consumption. The influence of caffeine on blood pressure remains unclear. But caffeine can cause your blood pressure to rise at least temporarily. If you already have high blood pressure or if you think caffeine is affecting your blood pressure, talk to your doctor about your caffeine consumption.

The DASH Diet

  • Emphasizes vegetables, fruits, and fat-free or low-fat dairy products.
  • Includes whole grains, fish, poultry, beans, seeds, nuts, and vegetable oils.
  • Limits sodium, sweets, sugary beverages, and red meats. The American Heart Association recommends 1,500 mg a day of sodium as an upper limit for all adults.

One teaspoon of table salt has 2,325 mg of sodium. When you read food labels, you may be surprised at just how much sodium some processed foods contain. Even low-fat soups, canned vegetables, ready-to-eat cereals and sliced turkey from the local deli — foods you may have considered healthy — often have lots of sodium

Along with DASH, other lifestyle changes can help lower your blood pressure. They include staying at a healthy weight, exercising, and not smoking.

The Role of Exercise

DASH diet recommends at least 30 minutes of exercise a day, most days of the week. Do exercises that get your heart pumping. To help prevent weight gain, exercise for 60 minutes a day. Exercise helps you lose weight and weight loss can help lower blood pressure 23.

dash diet guidelines

Dash Diet Guidelines

DASH Diet is a flexible and balanced eating plan that helps you create a heart-healthy eating style for life.

The DASH diet eating plan requires no special foods and has no hard-to-follow recipes. It simply calls for a certain number of daily servings from various food groups to provide your daily and weekly nutritional goals. This plan recommends:

  • Eating vegetables, fruits, and whole grains
  • Including fat-free or low-fat dairy products, fish, poultry, beans, nuts, and vegetable oils
  • Increase potassium intake
  • Limiting foods that are high in saturated fat, such as fatty meats, full-fat dairy products, and tropical oils such as coconut, palm kernel and palm oils
  • Limiting sugar-sweetened beverages and sweets.

The number of servings depends on the number of calories you’re allowed each day. Your calorie level depends on your age, sex, the amount of lean body mass (muscular, athletic, average or overweight), height and, especially, how active you are. Think of this as an energy balance system—if you want to maintain your current weight, you should take in only as many calories as you burn by being physically active. If you need to lose weight, eat fewer calories than you burn or increase your activity level to burn more calories than you eat.

What is your physical activity level ? Are you mostly:

  • Sedentary: You do only light physical activity that is part of your typical day-to-day routine.
  • Moderately active: You do physical activity equal to walking about 1 to 3 miles a day at 3 to 4 miles per hour, plus light physical activity.
  • Active: You do physical activity equal to walking more than 3 miles per day at 3 to 4 miles per hour, plus light physical activity.

Use the Tables 24 below to estimate your daily calorie needs.

Table 2. Estimated Calorie Needs per Day, by Age, Sex, and Physical Activity Level

Daily Calorie Needs for Women

Age (years)Calories Needed for Sedentary Activity LevelCalories Needed for Moderately Active Activity LevelCalories Needed for Active Activity Level
19–3020002,000–2,2002400
31–50180020002200
51160018002,000–2,200

Footnote: Estimates for females do not include women who are pregnant or breastfeeding. Within each age and sex category, the low end of the range is for sedentary individuals; the high end of the range is for active individuals. Due to reductions in basal metabolic rate (resting energy requirement) that occur with aging, calorie needs generally decrease for adults as they age.
These are only estimates, and approximations of individual calorie needs can be aided with online tools such as those available at www.supertracker.usda.gov 25. To find out What and How Much To Eat, you can use a FREE, award-winning, state-of-the-art, online diet and activity tracking tool called SuperTracker 22 from the United States Department of Agriculture Center for Nutrition Policy and Promotion 22. This free application empowers you to build a healthier diet, manage weight, and reduce your risk of chronic diet-related diseases. You can use SuperTracker 22 to determine what and how much to eat; track foods, physical activities, and weight; and personalize with goal setting, virtual coaching, and journaling.

After figuring out your daily calorie needs, go to the Table 3 below and find the closest calorie level to yours. The tables below estimates the number of servings from each food group that you should have. Serving quantities are per day, unless otherwise noted.

Daily Calorie Needs for Men

Age (years)Calories Needed for Sedentary Activity LevelCalories Needed for Moderately Active Activity LevelCalories Needed for Active Activity Level
19–3024002,600–2,8003000
31–5022002,400–2,6002,800–3,000
5120002,200–2,4002,400–2,800

Footnote: Within each age and sex category, the low end of the range is for sedentary individuals; the high end of the range is for active individuals. Due to reductions in basal metabolic rate (resting energy requirement) that occur with aging, calorie needs generally decrease for adults as they age.

These are only estimates, and approximations of individual calorie needs can be aided with online tools such as those available at www.supertracker.usda.gov 25. To find out What and How Much To Eat, you can use a FREE, award-winning, state-of-the-art, online diet and activity tracking tool called SuperTracker 22 from the United States Department of Agriculture Center for Nutrition Policy and Promotion 22. This free application empowers you to build a healthier diet, manage weight, and reduce your risk of chronic diet-related diseases. You can use SuperTracker 22 to determine what and how much to eat; track foods, physical activities, and weight; and personalize with goal setting, virtual coaching, and journaling.

After figuring out your daily calorie needs, go to the Table 3 below and find the closest calorie level to yours. The tables below estimates the number of servings from each food group that you should have. Serving quantities are per day, unless otherwise noted.

DASH Diet Eating Plan—Number of Food Servings by Calorie Level

Table 3. DASH Diet Eating Plan—Number of Food Servings by Calorie Level

Food Group1,200 Cal.1,400 Cal.1,600 Cal.1,800 Cal.2,000 Cal.2,600 Cal.3,100 Cal.
Grains a
4–55–6666–810–1112–13
Vegetables3–43–43–44–54–55–66
Fruits3–4444–54–55–66
Fat-free or low-fat dairy products b
2–32–32–32–32–333–4
Lean meats, poultry, and fish3 or less3–4 or less3–4 or less6 or less6 or less6 or less6–9
Nuts, seeds, and legumes3 per week3 per week3–4 per week4 per week4–5 per week11
Fats and oils c
1122–32–334
Sweets and added sugars3 or less per week3 or less per week3 or less per week5 or less per week5 or less per week≤2≤2
Maximum sodium limit d
2,300 mg/day2,300 mg/day2,300 mg/day2,300 mg/day2,300 mg/day2,300 mg/day2,300 mg/day

Footnotes:

a Whole grains are recommended for most grain servings as a good source of fiber and nutrients.

b For lactose intolerance, try either lactase enzyme pills with dairy products or lactose-free or lactose-reduced milk.

c Fat content changes the serving amount for fats and oils. For example, 1 Tbsp regular salad dressing = one serving; 1 Tbsp low-fat dressing = one-half serving; 1 Tbsp fat-free dressing = zero servings.

d The DASH diet eating plan has a salt (sodium) limit of either 2,300 mg or 1,500 mg per day. 1,500 milligrams (mg) sodium lowers blood pressure even further than 2,300 mg sodium daily.

Tips for Lowering Salt (Sodium) When Shopping, Cooking, and Eating Out

Table 4. Tips for Lowering Salt (Sodium) When Shopping, Cooking, and Eating Out

ShoppingCookingEating Out
Read food labels, and choose items that are lower in sodium and salt, particularly for convenience foods and condiments.*
Choose fresh poultry, fish, and lean meats instead of cured food such as bacon and ham.
Choose fresh or frozen versus canned fruits and vegetables.
Avoid food with added salt, such as pickles, pickled vegetables, olives, and sauerkraut.
Avoid instant or flavored rice and pasta.
Don’t add salt when cooking rice, pasta, and hot cereals.
Flavor your foods with salt-free seasoning blends, fresh or dried herbs and spices, or fresh lemon or lime juice.
Rinse canned foods or foods soaked in brine before using to remove the sodium.
Use less table salt to flavor food.
Ask that foods be prepared without added salt or MSG, commonly used in Asian foods.
Avoid choosing menu items that have salty ingredients such as bacon, pickles, olives, and cheese.
Avoid choosing menu items that include foods that are pickled, cured, smoked, or made with soy sauce or broth.
Choose fruit or vegetables as a side dish, instead of chips or fries.

Footnote: *Examples of convenience foods are frozen dinners, prepackaged foods, and soups; examples of condiments are mustard, ketchup, soy sauce, barbecue sauce, and salad dressings. Most of the salt (sodium) Americans eat comes from processed and prepared foods, such as breads, cold cuts, pizza, poultry, soups, sandwiches and burgers, cheese, pasta and meat dishes, and salty snacks. Therefore, healthier choices when shopping and eating out are particularly important.

Increasing Daily Potassium

The DASH diet eating plan is designed to be rich in potassium, with a target of 4,700 mg potassium daily, to enhance the effects of reducing sodium on blood pressure. The following are examples of potassium-rich foods.

Table 5. Sample Foods and Potassium Levels

Food GroupsPotassium (mg)
Vegetables
Potato, 1 medium926
Sweet Potato, 1 medium540
Spinach, cooked, 1/2 cup290
Zucchini, cooked, 1/2 cup280
Tomato, fresh, 1/2 cup210
Kale, cooked, 1/2 cup150
Romaine lettuce, 1 cup140
Mushrooms, 1/2 cup110
Cucumber, 1/2 cup80
Fruit
Banana, 1 medium420
Apricots, 1/4 cup380
Orange, 1 medium237
Cantaloupe chunks, 1/2 cup214
Apple, 1 medium150
Nuts, seeds, and legumes
Cooked soybeans, 1/2 cup440
Cooked lentils, 1/2 cup370
Cooked kidney beans, 1/2 cup360
Cooked split peas, 1/2 cup360
Almonds, roasted, 1/3 cup310
Walnuts, roasted, 1/3 cup190
Sunflower seeds, roasted, 2 Tbsp124
Peanuts, roasted, 1/3 cup120
Low-fat or fat-free milk and milk products
Milk, 1 cup380
Yogurt, 1 cup370
Lean meats, fish, and poultry
Fish (cod, halibut, rockfish, trout, tuna), 3 oz200-400
Pork tenderloin, 3 oz370
Beef tenderloin, chicken, turkey, 3 oz210

Footnote: Before you increase the potassium in your diet or use salt substitutes (which often contain potassium), check with your doctor. People who have kidney problems or who take certain medicines must be careful about how much potassium they consume.

[Source 26 ]

Daily and Weekly DASH Diet Eating Plan Goals for a 2,000-Calorie-a-Day Diet

Based on these recommendations, the following tables shows examples of daily and weekly servings that meet DASH diet eating plan targets for a 2,000-calorie-a-day diet.

When following the DASH diet eating plan, it is important to choose foods that are:

  • Low in saturated and trans fats
  • Rich in potassium, calcium, magnesium, fiber, and protein
  • Lower in sodium

Table 6. Daily and Weekly DASH Diet Eating Plan Goals for a 2,000-Calorie-a-Day Diet

Food GroupDaily ServingsServing SizesExamples and NotesSignificance of Each Food Group to the DASH Eating Pattern
Grains*06/08/211 slice bread
1 oz dry cereal**
1/2 cup cooked rice, pasta, or cereal
Whole wheat bread and rolls, whole wheat pasta, English muffin, pita bread, bagel, cereals, grits, oatmeal, brown rice, unsalted pretzels and popcornMajor sources of energy and fiber
Vegetables04/05/211 cup raw leafy vegetable
1/2 cup cut-up raw or cooked vegetable
1/2 cup vegetable juice
Broccoli, carrots, collards, green beans, green peas, kale, lima beans, potatoes, spinach, squash, sweet potatoes, tomatoesRich sources of potassium, magnesium, and fiber
Fruits04/05/211 medium fruit
1/4 cup dried fruit
1/2 cup fresh, frozen, or canned fruit
1/2 cup fruit juice
Apples, apricots, bananas, dates, grapes, oranges, grapefruit, grapefruit juice, mangoes, melons, peaches, pineapples, raisins, strawberries, tangerinesImportant sources of potassium, magnesium, and fiber
Fat-free or low-fat milk and milk products02/03/211 cup milk or yogurt
1 1/2 oz cheese
Fat-free (skim) or low-fat (1%) milk or buttermilk, fat-free, low-fat, or reduced-fat cheese, fat-free or low-fat regular or frozen yogurtMajor sources of calcium and protein
Lean meats, poultry, and fish6 or less1 oz cooked meats, poultry, or fish
1 egg***
Select only lean; trim away visible fats; broil, roast, or poach; remove skin from poultryRich sources of protein and magnesium
Nuts, seeds, and legumes4-5 per week1/3 cup or 1 1/2 oz nuts
2 Tbsp peanut butter
2 Tbsp or 1/2 oz seeds
1/2 cup cooked legumes (dry beans and peas)
Almonds, hazelnuts, mixed nuts, peanuts, walnuts, sunflower seeds, peanut butter, kidney beans, lentils, split peasRich sources of energy, magnesium, protein, and fiber
Fats and oils****02/03/211 tsp soft margarine
1 tsp vegetable oil
1 Tbsp mayonnaise
2 Tbsp salad dressing
Soft margarine, vegetable oil (such as canola, corn, olive, or safflower), low-fat mayonnaise, light salad dressingThe DASH study had 27 percent of calories as fat, including fat in or added to foods
Sweets and added sugars5 or less per week1 Tbsp sugar
1 Tbsp jelly or jam
1/2 cup sorbet, gelatin
1 cup lemonade
Fruit-flavored gelatin, fruit punch, hard candy, jelly, maple syrup, sorbet and ices, sugarSweets should be low in fat

Footnotes:

* Whole grains are recommended for most grain servings as a good source of fiber and nutrients.

** Serving sizes vary between 1/2 cup and 11/4 cups, depending on cereal type. Check the product’s Nutrition Facts label.

*** Since eggs are high in cholesterol, limit egg yolk intake to no more than four per week; two egg whites have the same protein content as 1 oz of meat.

**** Fat content changes serving amount for fats and oils. For example, 1 Tbsp of regular salad dressing equals one serving; 1 Tbsp of a low-fat dressing equals one-half serving; 1 Tbsp of a fat-free dressing equals zero servings.

[Source 27 ]

DASH Diet Eating Plan—Number of Daily Servings for Other Calorie Levels

When following the DASH diet eating plan, it is important to choose foods that are:

  • Low in saturated and trans fats
  • Rich in potassium, calcium, magnesium, fiber, and protein
  • Lower in sodium

Table 7. DASH Diet Eating Plan—Number of Daily Servings for Other Calorie Levels

Servings/Day
Food Groups1,600 calories/day2,600 calories/day3,100 calories/day
Grains*610/11/2101/12/13
Vegetables03/04/2105/06/216
Fruits405/06/216
Fat-free or lowfat milk and milk products02/03/21303/04/21
Lean meats, poultry, and fish03/06/21606/09/21
Nuts, seeds, and legumes3/week11
Fats and oils234
Sweets and added sugars0less than 2less than 2

Footnote: * Whole grains are recommended for most grain servings as a good source of fiber and nutrients.

[Source 27 ]

Dash Diet Eating Plan

To benefit from the DASH diet eating plan, it is important to consume the appropriate amount of calories to maintain a healthy weight.

The DASH diet eating plan can be used to help you lose weight. To lose weight, follow the DASH eating plan and try to reduce your total daily calories gradually. Find out your daily calorie needs or goals with the Body Weight Planner and calorie chart. Talk with your doctor before beginning any diet or eating plan.

General tips for reducing daily calories include:

  • Eat smaller portions more frequently throughout the day.
  • Reduce the amount of meat that you eat while increasing the amount of fruits, vegetables, whole grains, or dry beans.
  • Substitute low-calorie foods, such as when snacking (choose fruits or vegetables instead of sweets and desserts) or drinking (choose water instead of soda or juice), when possible.

Tips for Following DASH Diet

It’s easy to follow the DASH diet. But it might mean making some changes to how you currently eat. To get started:

  • DO NOT try to make changes all at once. It’s fine to change your eating habits gradually.
  • To add vegetables to your diet, try having a salad at lunch. Or, add cucumber, lettuce, shredded carrots, or tomatoes to your sandwiches.
  • There should always been something green on your plate. It’s fine to use frozen vegetables instead of fresh. Just make sure the package does not contain added salt or fat.
  • Add sliced fruit to your cereal or oatmeal for breakfast.
  • For dessert, choose fresh fruit or low-fat frozen yogurt instead of high-calorie sweets, such as cakes or pies.
  • Choose healthy snacks, such as unsalted rice cakes or popcorn, raw vegetables, or yogurt. Dried fruits, seeds, and nuts also make great snack choices. Just keep these portions small.
  • Choose whole grain foods for most grain servings to get added nutrients, such as minerals and fiber. For example, choose whole wheat bread or whole grain cereals.
  • Think of meat as part of your meal, instead of the main course. Limit your servings of lean meat to 6 ounces (170 grams) a day. You can have two 3-ounce (85 grams) servings during the day. If you now eat large portions of meats, cut them back gradually by a half or a third at each meal.
  • Try these snacks ideas: unsalted rice cakes; nuts mixed with raisins; graham crackers; fat-free and low-fat yogurt and frozen yogurt; popcorn with no salt or butter added; raw vegetables.
  • Try cooking without meat at least twice each week. Instead, eat beans, nuts, tofu, or eggs for your protein.
  • If you are allergic to nuts, use seeds or legumes (cooked dried beans or peas).

DASH diet guidelines

Here’s a look at the recommended servings from each food group for the 2,000-calorie-a-day DASH diet plan.

A) Grains: 6 to 8 servings a day (Note: A standard grain (cereal) serve is about 500kJ).

Grains include bread, cereal, rice and pasta. Examples of one serving of grains include 1 slice whole-wheat bread, 1 ounce dry cereal, or 1/2 cup cooked cereal, rice or pasta.

Grains are naturally low in fat. Keep them this way by avoiding butter, cream and cheese sauces.

rice and grains serving size

Focus on whole grains because they have more fiber and nutrients than do refined grains. For instance, use brown rice instead of white rice, whole-wheat pasta instead of regular pasta and whole-grain bread instead of white bread. Look for products labeled “100 percent whole grain” or “100 percent whole wheat.”

B) Vegetables: 4 to 5 servings a day (Note: A standard vegetable serve is about 75g (100–350kJ)).

Tomatoes, carrots, broccoli, sweet potatoes, greens and other vegetables are full of fiber, vitamins, and such minerals as potassium and magnesium. Examples of one serving include 1 cup raw leafy green vegetables or 1/2 cup cut-up raw or cooked vegetables.

Don’t think of vegetables only as side dishes — a hearty blend of vegetables served over brown rice or whole-wheat noodles can serve as the main dish for a meal.

vegetable serving size

Fresh and frozen vegetables are both good choices. When buying frozen and canned vegetables, choose those labeled as low sodium or without added salt.

To increase the number of servings you fit in daily, be creative. In a stir-fry, for instance, cut the amount of meat in half and double up on the vegetables.

C) Fruits: 4 to 5 servings a day (Note: A standard fruit serve is about 150g (350kJ)).

Many fruits need little preparation to become a healthy part of a meal or snack. Like vegetables, they’re packed with fiber, potassium and magnesium and are typically low in fat — coconuts are an exception. Examples of one serving include one medium fruit, 1/2 cup fresh, frozen or canned fruit, or 4 ounces of juice.

Have a piece of fruit with meals and one as a snack, then round out your day with a dessert of fresh fruits topped with a dollop of low-fat yogurt. Leave on edible peels whenever possible. The peels of apples, pears and most fruits with pits add interesting texture to recipes and contain healthy nutrients and fiber.

fruit serving size

Many fruits need little preparation to become a healthy part of a meal or snack. Like vegetables, they’re packed with fiber, potassium and magnesium and are typically low in fat — coconuts are an exception. Examples of one serving include one medium fruit, 1/2 cup fresh, frozen or canned fruit, or 4 ounces of juice.

If you choose canned fruit or juice, make sure no sugar is added.

Leave on edible peels whenever possible. The peels of apples, pears and most fruits with pits add interesting texture to recipes and contain healthy nutrients and fiber.

Remember that citrus fruits and juices, such as grapefruit, can interact with certain medications, so check with your doctor or pharmacist to see if they’re OK for you.

D) Dairy: 2 to 3 servings a day (Note: A standard dairy serve is about 500-600kJ).

Milk, yogurt, cheese and other dairy products are major sources of calcium, vitamin D and protein. But the key is to make sure that you choose dairy products that are low fat or fat-free because otherwise they can be a major source of fat and most of it is saturated. Examples of one serving include 1 cup skim or 1 percent milk, 1 cup low fat yogurt, or 1 1/2 ounces part-skim cheese.

serving size of dairy, yogurt and cheese

Low-fat or fat-free frozen yogurt can help you boost the amount of dairy products you eat while offering a sweet treat. Add fruit for a healthy twist. If you have trouble digesting dairy products, choose lactose-free products or consider taking an over-the-counter product that contains the enzyme lactase, which can reduce or prevent the symptoms of lactose intolerance.

Go easy on regular and even fat-free cheeses because they are typically high in sodium.

E) Lean meat, poultry and fish: 6 servings or fewer a day (Note: A standard lean meat, poultry and fish serve is about 500-600kJ).

Meat can be a rich source of protein, B vitamins, iron and zinc. Choose lean varieties and aim for no more than 6 ounces a day. Cutting back on your meat portion will allow room for more vegetables.

serving size of chicken

Trim away skin and fat from poultry and meat and then bake, broil, grill or roast instead of frying in fat.
Eat heart-healthy fish, such as salmon, herring and tuna. These types of fish are high in omega-3 fatty acids, which can help lower your total cholesterol.

F) Nuts, seeds and legumes: 4 to 5 servings a week

Almonds, sunflower seeds, kidney beans, peas, lentils and other foods in this family are good sources of magnesium, potassium and protein. They’re also full of fiber and phytochemicals, which are plant compounds that may protect against some cancers and cardiovascular disease.

Serving sizes are small and are intended to be consumed only a few times a week because these foods are high in calories. Examples of one serving include 1/3 cup nuts, 2 tablespoons seeds, or 1/2 cup cooked beans or peas.

Nuts sometimes get a bad rap because of their fat content, but they contain healthy types of fat — monounsaturated fat and omega-3 fatty acids. They’re high in calories, however, so eat them in moderation. Try adding them to stir-fries, salads or cereals.
Soybean-based products, such as tofu and tempeh, can be a good alternative to meat because they contain all of the amino acids your body needs to make a complete protein, just like meat.

G) Fats and oils: 2 to 3 servings a day

Fat helps your body absorb essential vitamins and helps your body’s immune system. But too much fat increases your risk of heart disease, diabetes and obesity. The DASH diet strives for a healthy balance by limiting total fat to less than 30 percent of daily calories from fat, with a focus on the healthier monounsaturated fats.

Examples of one serving include 1 teaspoon soft margarine, 1 tablespoon mayonnaise or 2 tablespoons salad dressing.

Saturated fat and trans fat are the main dietary culprits in increasing your risk of coronary artery disease. DASH helps keep your daily saturated fat to less than 6 percent of your total calories by limiting use of meat, butter, cheese, whole milk, cream and eggs in your diet, along with foods made from lard, solid shortenings, and palm and coconut oils.

Avoid trans fat, commonly found in such processed foods as crackers, baked goods and fried items.
Read food labels on margarine and salad dressing so that you can choose those that are lowest in saturated fat and free of trans fat.

H) Sweets: 5 servings or fewer a week

You don’t have to banish sweets entirely while following the DASH diet — just go easy on them. Examples of one serving include 1 tablespoon sugar, jelly or jam, 1/2 cup sorbet, or 1 cup lemonade.

When you eat sweets, choose those that are fat-free or low-fat, such as sorbets, fruit ices, jelly beans, hard candy, graham crackers or low-fat cookies.

Artificial sweeteners such as aspartame (NutraSweet, Equal) and sucralose (Splenda) may help satisfy your sweet tooth while sparing the sugar. But remember that you still must use them sensibly. It’s OK to swap a diet cola for a regular cola, but not in place of a more nutritious beverage such as low-fat milk or even plain water.
Cut back on added sugar, which has no nutritional value but can pack on calories.

DASH diet: Alcohol and caffeine

Drinking too much alcohol can increase blood pressure. The Dietary Guidelines for Americans recommends that men limit alcohol to no more than two drinks a day and women to one or less.

The DASH diet doesn’t address caffeine consumption. The influence of caffeine on blood pressure remains unclear. But caffeine can cause your blood pressure to rise at least temporarily. If you already have high blood pressure or if you think caffeine is affecting your blood pressure, talk to your doctor about your caffeine consumption.

Your Guide to Lowering Your Blood Pressure and Weight Loss With DASH Diet— A Week With the DASH Eating Plan

Here is a week of menus from the DASH eating plan. The menus allow you to have a daily sodium level of either 2,300 mg or, by making the noted changes, 1,500 mg. You’ll also find that the menus sometimes call for you to use lower sodium, low-fat, fat-free, or reduced fat versions of products.

The menus are based on 2,000 calories a day—serving sizes should be increased or decreased for other calorie levels. To ease the calculations, some of the serving sizes have been rounded off. Also, some items may be in too small a quantity to have a listed food group serving. Recipes for starred items are given on the later pages. Some of these recipes give changes that can be used to lower their sodium level. Use the changes if you want to follow the DASH eating plan at 1,500 milligrams of sodium per day.

Abbreviations:
oz = ounce
tsp = teaspoon
Tbsp = tablespoon
g = gram
mg = milligram

Table 8. A Week With the DASH Eating Plan

Day One Breakfast
Number of Servings by DASH Food Group
2,300 mg Sodium MenuSodium (mg)Substitution To Reduce Sodium to 1,500 mgSodium (mg)GrainsVegetablesFruitsMilk ProductsMeats, fish, and poultryNuts, seeds, and legumesFats and oilsSweets and added sugars
3/4 cup bran flakes cereal:2203/4 cup shredded wheat cereal11
1 medium banana11
1 cup low-fat milk1071
1 slice whole wheat bread:1491
1 tsp soft (tub) margarine261 tsp unsalted soft (tub) margarine01
1 cup orange juice52
Lunch
3/4 cup chicken salad:179Remove salt from the recipe1203
2 slices whole wheat bread2992
1 Tbsp Dijon mustard3731 Tbsp regular mustard1751
salad:
1/2 cup fresh cucumber slices11
1/2 cup tomato wedges51
1 Tbsp sunflower seeds01/2
1 tsp Italian dressing, low calorie43
1/2 cup fruit cocktail, juice pack51
Dinner
3 oz beef, eye of the round:353
2 Tbsp beef gravy, fat-free165
1 cup green beans, sautéed with:122
1/2 tsp canola oil01/2
1 small baked potato:141
1 Tbsp sour cream, fat-free21
1 Tbsp grated natural cheddar cheese, reduced fat671 Tbsp natural cheddar cheese, reduced fat, low sodium1
1 Tbsp chopped scallions1
1 small whole wheat roll:1481
1 tsp soft (tub) margarine261 tsp unsalted soft (tub) margarine01
1 small apple11
1 cup low-fat milk1071
Snacks
1/3 cup almonds, unsalted01
1/4 cup raisins41
1/2 cup fruit yogurt, fat-free,
no sugar added
861/2
Totals
Totals2,1011,5075562 1/261 1/23 1/20
Sodium Level
Nutrients Per Day2,300 mg1,500 mg
Calories2,0622,037
Total fat63 g59 g
Calories from fat28%26 %
Saturated fat13 g12 g
Calories from saturated fat6 %5 %
Cholesterol155 mg155 mg
Sodium2,101 mg1,507 mg
Carbohydrate284 g284 g
Protein114 g115 g
Calcium1,220 mg1,218 mg
Magnesium594 mg580 mg
Potassium4,909 mg4,855 mg
Fiber37 g36 g
Day Two

Breakfast
Number of Servings by DASH Food Group
2,300 mg Sodium MenuSodium (mg)Substitution To Reduce Sodium to 1,500 mgSodium (mg)GrainsVegetablesFruitsMilk ProductsMeats, fish, and poultryNuts, seeds, and legumesFats and oilsSweets and added sugars
1/2 cup instant oatmeal541/2 cup regular oatmeal with
1 tsp cinnamon
51
1 mini whole wheat bagel:841
1 Tbsp peanut butter811/2
1 medium banana11
1 cup low-fat milk1071
Lunch
chicken breast sandwich:
3 oz chicken breast, skinless653
2 slices whole wheat bread2002
1 slice (3/4 oz) natural cheddar cheese, reduced fat2021 slice (3/4 oz) natural Swiss cheese, low sodium31/2
1 large leaf romaine lettuce11/4
2 slices tomato21/2
1 Tbsp mayonnaise, low-fat1011
1 cup cantaloupe chunks262
1 cup apple juice212
Dinner
1 cup spaghetti:12
3/4 cup vegetarian spaghetti sauce479Substitute low-sodium tomato paste (6 oz)2531 1/2
3 Tbsp Parmesan cheese2871/2
spinach salad:
1 cup fresh spinach leaves241
1/4 cup fresh carrots, grated191/2
1/4 cup fresh mushrooms, sliced11/2
1 Tbsp vinaigrette dressing11/2
1/2 cup corn, cooked from frozen11
1/2 cup canned pears, juice pack51
Snacks
1/3 cup almonds, unsalted01
1/4 cup dried apricots31
1 cup fruit yogurt, fat-free,
no sugar added
1731
Totals
Totals2,0351,56065 1/47331 1/21 1/20
Sodium Level
Nutrients Per Day2,300 mg1,500 mg
Calories2,0272,078
Total fat64 g68 g
Calories from fat28%30 %
Saturated fat13 g16 g
Calories from saturated fat6 %7 %
Cholesterol114 mg129 mg
Sodium2,035 mg1,560 mg
Carbohydrate288 g290 g
Protein99 g100 g
Calcium1,370 mg1,334 mg
Magnesium535 mg542 mg
Potassium4,715 mg4,721 mg
Fiber34 g34 g
Day Three

Breakfast
Number of Servings by DASH Food Group
2,300 mg Sodium MenuSodium (mg)Substitution To Reduce Sodium to 1,500 mgSodium (mg)GrainsVegetablesFruitsMilk ProductsMeats, fish, and poultryNuts, seeds, and legumesFats and oilsSweets and added sugars
3/4 cup bran flakes cereal:2202 cups puffed wheat cereal11
1 medium banana11
1 cup low-fat milk1071
1 slice whole wheat bread:1491
1 tsp soft (tub) margarine261 tsp unsalted soft (tub) margarine01
1 cup orange juice62
Lunch
beef barbeque sandwich:
2 oz beef, eye of round262
1 Tbsp barbeque sauce156
2 slices (11/2 oz) natural cheddar cheese, reduced fat40511/2 oz natural cheddar cheese,
reduced fat, low sodium
91
1 hamburger bun1832
1 large leaf romaine lettuce11/4
2 slices tomato21/2
1 cup new potato salad172
1 medium orange01
Dinner
3 oz cod:703
1 tsp lemon juice1
1/2 cup brown rice51
1 cup spinach, cooked from frozen, sautéed with:1842
1 tsp canola oil01
1 Tbsp almonds, slivered01/4
1 small cornbread muffin, made
with oil:
1191
1 tsp soft (tub) margarine261 tsp unsalted soft (tub) margarine01
Snacks
1 cup fruit yogurt, fat-free,
no added sugar:
1731
1 Tbsp sunflower seeds, unsalted01/2
2 large graham cracker rectangles:156
1 Tbsp peanut butter811/2
Totals
Totals2,1141,44774 3/44351 1/430
Sodium Level
Nutrients Per Day2,300 mg1,500 mg
Calories1,9971,995
Total fat56 g52 g
Calories from fat25 %24 %
Saturated fat12 g11 g
Calories from saturated fat6 %5 %
Cholesterol140 mg140 mg
Sodium2,114 mg1,447 mg
Carbohydrate289 g283 g
Protein103 g104 g
Calcium1,537 mg1,524 mg
Magnesium630 mg598 mg
Potassium4,676 mg4,580 mg
Fiber34 g31 g
Day Four

Breakfast
Number of Servings by DASH Food Group
2,300 mg Sodium MenuSodium (mg)Substitution To Reduce Sodium to 1,500 mgSodium (mg)GrainsVegetablesFruitsMilk ProductsMeats, fish, and poultryNuts, seeds, and legumesFats and oilsSweets and added sugars
1 slice whole wheat bread:1491
1 tsp soft (tub) margarine261 tsp unsalted soft (tub) margarine01
1 cup fruit yogurt, fat-free, no added sugar1731
1 medium peach01
1/2 cup grape juice41
Lunch
ham and cheese sandwich:
2 oz ham, low-fat, low sodium5492 oz roast beef tenderloin232
1 slice (3/4 oz) natural cheddar cheese, reduced fat2021 slice (3/4 oz) natural cheddar cheese, reduced fat, low sodium41/2
2 slices whole wheat bread2992
1 large leaf romaine lettuce11/4
2 slices tomato21/2
1 Tbsp mayonnaise, low-fat1011
1 cup carrot sticks842
Dinner
chicken and Spanish rice341substitute low-sodium tomato sauce (4 oz)21513
1 cup green peas, sautéed with:1152
1 tsp canola oil01
1 cup cantaloupe chunks262
1 cup low-fat milk1071
Snacks
1/3 cup almonds, unsalted01
1 cup apple juice212
1/4 cup apricots31
1 cup low-fat milk1071
Totals
Totals2,3121,43644 3/473 1/25130
Sodium Level
Nutrients Per Day2,300 mg1,500 mg
Calories2,0242,045
Total fat59 g59 g
Calories from fat26%26 %
Saturated fat12 g12 g
Calories from saturated fat5%5 %
Cholesterol148 mg150 mg
Sodium2,312 mg1,436 mg
Carbohydrate279 g278 g
Protein110 g116 g
Calcium1,417 mg1,415 mg
Magnesium538 mg541 mg
Potassium4,575 mg4,559 mg
Fiber35 g35 g
Day Five

Breakfast
Number of Servings by DASH Food Group
2,300 mg Sodium MenuSodium (mg)Substitution To Reduce Sodium to 1,500 mgSodium (mg)GrainsVegetablesFruitsMilk ProductsMeats, fish, and poultryNuts, seeds, and legumesFats and oilsSweets and added sugars
1 cup whole grain oat rings cereal:2731 cup frosted shredded wheat41
1 medium banana11
1 cup low-fat milk1071
1 medium raisin bagel:2722
1 Tbsp peanut butter811 Tbsp peanut butter, unsalted31/2
1 cup orange juice52
Lunch
tuna salad plate:
1/2 cup tuna salad1713
1 large leaf romaine lettuce11/4
1 slice whole wheat bread1496 whole wheat crackers, low sodium531
cucumber salad:
1 cup fresh cucumber slices22
1/2 cup tomato wedges51
1 Tbsp vinaigrette dressing1332 Tbsp yogurt dressing, fat-free661
1/2 cup cottage cheese, low-fat:4591/4
1/2 cup canned pineapple, juice pack11
1 Tbsp almonds, unsalted01/4
Dinner
3 oz turkey meatloaf205substitute low-sodium ketchup743
1 small baked potato:141
1 Tbsp sour cream, fat-free211
1 Tbsp natural cheddar cheese, reduced fat, grated671 Tbsp natural cheddar cheese, reduced fat, and low sodium1
1 scallion stalk, chopped1
1 cup collard greens, sautéed with:852
1 tsp canola oil0
1 small whole wheat roll1486 small melba toast crackers, unsalted11
1 medium peach01
Snacks
1 cup fruit yogurt, fat-free, no added sugar1731
2 Tbsp sunflower seeds, unsalted01
Totals
Totals2,3731,51956 1/452 1/461 3/420
Sodium Level
Nutrients Per Day2,300 mg1,500 mg
Calories1,9762,100
Total fat57 g52 g
Calories from fat26%22%
Saturated fat11 g11 g
Calories from saturated fat5%5%
Cholesterol158 mg158 mg
Sodium2,373 mg1,519 mg
Carbohydrate275 g314 g
Protein111 g114 g
Calcium1,470 mg1,412 mg
Magnesium495 mg491 mg
Potassium4,769 mg4,903 mg
Fiber30 g31 g
Day Six

Breakfast
Number of Servings by DASH Food Group
2,300 mg Sodium MenuSodium (mg)Substitution To Reduce Sodium to 1,500 mgSodium (mg)GrainsVegetablesFruitsMilk ProductsMeats, fish, and poultryNuts, seeds, and legumesFats and oilsSweets and added sugars
1 low-fat granola bar811
1 medium banana11
1/2 cup fruit yogurt, fat-free,
no sugar added
861/2
1 cup orange juice52
1 cup low-fat milk1071
Lunch
turkey breast sandwich:
3 oz turkey breast483
2 slices whole wheat bread2992
1 large leaf romaine lettuce11/4
2 slices tomato21/2
2 tsp mayonnaise, low-fat672/3
1 Tbsp Dijon mustard3731 Tbsp regular mustard175
1 cup steamed broccoli, cooked from frozen112
1 medium orange01
Dinner
3 oz spicy baked fish503
1 cup scallion rice182
spinach sauté:
1/2 cup spinach, cooked from frozen,
sautéed with:
921
2 tsp canola oil02
1 Tbsp almonds, slivered, unsalted01/4
1 cup carrots, cooked from frozen842
1 small whole wheat roll:1481
1 tsp soft (tub) margarine261
1 small cookie601
Snacks
2 Tbsp peanuts, unsalted1/2
1 cup low-fat milk
1/4 cup dried apricots
Totals
Totals1,6711,47265 3/452 1/263/43 2/31
Sodium Level
Nutrients Per Day2,300 mg1,500 mg
Calories1,9391,935
Total fat58 g57 g
Calories from fat27%27 %
Saturated fat12 g12 g
Calories from saturated fat6%6%
Cholesterol171 mg171 mg
Sodium1,671 mg1,472 mg
Carbohydrate268 g268 g
Protein105 g105 g
Calcium1,210 mg1,214 mg
Magnesium548 mg545 mg
Potassium4,710 mg4,710 mg
Fiber36 g36 g
Day Seven

Breakfast
Number of Servings by DASH Food Group
2,300 mg Sodium MenuSodium (mg)Substitution To Reduce Sodium to 1,500 mgSodium (mg)GrainsVegetablesFruitsMilk ProductsMeats, fish, and poultryNuts, seeds, and legumesFats and oilsSweets and added sugars
1 cup whole grain oat rings:2731 cup regular oatmeal5
1 medium banana1
1 cup low-fat milk107
1 cup fruit yogurt, fat-free, no sugar added173
Lunch
tuna salad sandwich:
1/2 cup tuna, drained, rinsed39
1 Tbsp mayonnaise, low-fat101
1 large leaf romaine lettuce1
2 slices tomato2
2 slices whole wheat bread299
1 medium apple1
1 cup low-fat milk107
Dinner
1/6 recipe zucchini lasagna:368substitute cottage cheese, low-fat, no salt added165
salad:
1 cup fresh spinach leaves24
1 cup tomato wedges9
2 Tbsp croutons, seasoned62
1 Tbsp vinaigrette dressing, reduced calorie1331 Tbsp low-sodium vinaigrette dressing1
1 Tbsp sunflower seeds0
1 small whole wheat roll:148
1 tsp soft (tub) margarine451 tsp unsalted soft (tub) margarine0
1 cup grape juice8
Snacks
1/3 cup almonds, unsalted0
1/4 cup dry apricots3
6 whole wheat crackers166
Totals
Totals2,0691,421
Sodium Level
Nutrients Per Day2,300 mg1,500 mg
Calories1,9931,988
Total fat64 g60 g
Calories from fat29 %27 %
Saturated fat13 g13 g
Calories from saturated fat6%6%
Cholesterol71 mg72 mg
Sodium2,069 mg1,421 mg
Carbohydrate283 g285 g
Protein93 g97 g
Calcium1,616 mg1,447 mg
Magnesium537 mg553 mg
Potassium4,693 mg4,695 mg
Fiber32 g33 g
[Source 28 ]

Summary

The DASH diet eating plan is just one key part of a heart-healthy lifestyle, and combining it with other lifestyle changes such as physical activity can help you control your blood pressure and LDL-cholesterol for life.

To help prevent and control high blood pressure:

  • Be physically active.
  • Maintain a healthy weight.
  • Limit alcohol intake.
  • Manage and cope with stress.

Other lifestyle changes can improve your overall health, such as:

  • If you smoke, quit.
  • Get plenty of sleep (7-9 hours/day).

To help make lifelong lifestyle changes, try making one change at a time and add another when you feel that you have successfully adopted the earlier changes. When you practice several healthy lifestyle habits, you are more likely to achieve and maintain healthy blood pressure, healthy body weight and cholesterol levels.

References
  1. Journal of the American College of Cardiology Volume 45, Issue 9, 3 May 2005, Pages 1379-1387. Diets and Cardiovascular Disease: An Evidence-Based Assessment. http://www.sciencedirect.com/science/article/pii/S0735109705003670
  2. National Institutes of Health. National Heart, Blood and Lung Institute. Description of the DASH Eating Plan. https://www.nhlbi.nih.gov/health/health-topics/topics/dash
  3. National Institutes of Health. National Heart, Blood and Lung Institute. Your Guide To Lowering Your Blood Pressure With DASH. https://www.nhlbi.nih.gov/files/docs/public/heart/dash_brief.pdf
  4. Sacks FM, Svetkey LP, Vollmer WM, Appel LJ, Bray GA, Harsha D, Obarzanek E, Conlin PR, Miller ER 3rd, Simons-Morton DG, Karanja N, Lin PH; DASH-Sodium Collaborative Research Group. Effects on blood pressure of reduced dietary sodium and the Dietary Approaches to Stop Hypertension (DASH) diet. DASH-Sodium Collaborative Research Group. N Engl J Med. 2001 Jan 4;344(1):3-10. doi: 10.1056/NEJM200101043440101
  5. Salehi-Abargouei A, Maghsoudi Z, Shirani F, Azadbakht L. Nutrition. 2013 Apr;29(4):611-8. doi: 10.1016/j.nut.2012.12.018. Effects of Dietary Approaches to Stop Hypertension (DASH)-style diet on fatal or nonfatal cardiovascular diseases–incidence: a systematic review and meta-analysis on observational prospective studies. http://www.nutritionjrnl.com/article/S0899-9007(13)00007-5/fulltext
  6. Fung TT, Chiuve SE, McCullough ML, Rexrode KM, Logroscino G, Hu FB. Adherence to a DASH-style diet and risk of coronary heart disease and stroke in women. Arch Intern Med. 2008 Apr 14;168(7):713-20. PMID: 18413553. http://jamanetwork.com/journals/jamainternalmedicine/fullarticle/414155
  7. National Institutes of Health. National Heart, Blood and Lung Institute. Your Guide to Lowering Blood Pressure. https://www.nhlbi.nih.gov/files/docs/public/heart/hbp_low.pdf
  8. L.J. Appel, T.J. Moore, E. Obarzenek, et al.A clinical trial of the effects of dietary patterns on blood pressure. N Engl J Med, 336 (1997), pp. 1117-1124
  9. J.P. Midgley, A.G. Matthew, C.M. Greenwood, A.G. Logan. Effect of reduced dietary sodium on blood pressure: a meta-analysis of randomized controlled trials. JAMA, 275 (1996), pp. 1590-1597
  10. National Institutes of Health. National Heart, Blood and Lung Institute. Your Guide to Lowering Blood Pressure with DASH. https://www.nhlbi.nih.gov/files/docs/public/heart/new_dash.pdf
  11. F.M. Sacks, L.P. Svetkey, W.M. Vollmer, et al.Effects on blood pressure of reduced dietary sodium and the Dietary Approaches to Stop Hypertension (DASH) DietN Engl J Med, 344 (2001), pp. 3-10
  12. P.K. Whelton, J. He, L.J. Appel, et al.Primary prevention of hypertension: clinical and public health advisory from the National High Blood Pressure ProgramJAMA, 288 (2002), pp. 1882-1888
  13. National Institutes of Health. National Heart, Blood and Lung Institute. NHLBI Study Finds DASH Diet And Reduced Sodium Lowers Blood Pressure For All. https://www.nhlbi.nih.gov/news/press-releases/2001/nhlbi-study-finds-dash-diet-and-reduced-sodium-lowers-blood-pressure-for-all
  14. National Institutes of Health. National Heart, Lung and Blood Institute. PREMIER Study. https://www.nhlbi.nih.gov/research/resources/obesity/completed/premier.htm
  15. Appel LJ, Champagne CM, Harsha DW, et al. Effects of comprehensive lifestyle modification on blood pressure control: main results of the PREMIER clinical trial. JAMA 2003;289:2083-93.
  16. Blumenthal JA, Babyak MA, Hinderliter A, Watkins LL, Craighead L, Lin PH, Caccia C, Johnson J, Waugh R, Sherwood A. Effects of the DASH diet alone and in combination with exercise and weight loss on blood pressure and cardiovascular biomarkers in men and women with high blood pressure: the ENCORE study. Arch Intern Med. 2010 Jan 25;170(2):126-35. PMID: 20101007. https://www.ncbi.nlm.nih.gov/pubmed/20101007
  17. de Koning L, Chiuve SE, Fung TT, Willett WC, Rimm EB, Hu FB. Diet-quality scores and the risk of type 2 diabetes in men. Diabetes Care. 2011 May;34(5):1150-6. PMID: 21464460. https://www.ncbi.nlm.nih.gov/pubmed/21464460
  18. BMI Calculator Adults. https://www.cdc.gov/healthyweight/assessing/bmi/adult_BMI/english_bmi_calculator/bmi_calculator.html
  19. BMI Calculator Children. https://nccd.cdc.gov/dnpabmi/Calculator.aspx
  20. Body Weight Planner. https://www.supertracker.usda.gov/bwp/index.html
  21. ChooseMyPlate. https://www.choosemyplate.gov/
  22. https://supertracker.usda.gov/
  23. U.S. National Library of Medicine. Medline Plus. Understanding the DASH diet. https://medlineplus.gov/ency/patientinstructions/000784.htm
  24. National Institutes of Health. National Heart, Blood and Lung Institute. Following the DASH Eating Plan. https://www.nhlbi.nih.gov/health/health-topics/topics/dash/followdash
  25. SuperTracker: https://www.supertracker.usda.gov/
  26. National Institutes of Health. National Heart, Blood and Lung Institute. Your Guide to Lowering Your Blood Pressure With DASH. https://www.nhlbi.nih.gov/health/resources/heart/hbp-dash-how-to
  27. National Institutes of Health. National Heart, Lung and Blood Institute. Your Guide to Lowering Your Blood Pressure With DASH. https://www.nhlbi.nih.gov/health/resources/heart/hbp-dash-how-to
  28. National Institutes of Health. National Heart, Lung and Blood Institute. Your Guide to Lowering Your Blood Pressure With DASH — A Week With the DASH Eating Plan. https://www.nhlbi.nih.gov/health/resources/heart/hbp-dash-week-dash-html
read more
Diet PlanDiet, Food & Fitness

What is Weight Watchers Weight Loss Program ?

weight wathers weight loss program
Weight Watchers weight loss program

The Weight Watchers Weight Loss Program

Founded in 1963 by Jean Nidetch, Weight Watchers Weight-Loss Program:  the basis around this program helps promote the members to engage in regular meetings, and sessions promoting group support, alongside of a point system based off of the foods you eat.

Weight Watchers isn’t so much a diet, but it’s a lifestyle-change program. It can help you learn how to eat healthier and get more physical activity, so you can lose the weight for good. A backbone of the weight watchers weight loss program is multi-model access (via in-person meetings, online chat or phone) to support you from people who lost weight using Weight Watchers, kept it off and have been trained in behavioral weight management techniques.

In the review conducted by U.S. News & World Report with the help of a panel of 22 experts to make their choices to find the nation’s best overall diets for 2013 1. U.S. News evaluated and ranked the 38 diets, to be top-rated, a diet had to be relatively easy to follow, nutritious, safe, effective for weight loss and protective against diabetes and heart disease. The US government-endorsed Dietary Approaches to Stop Hypertension (DASH) diet took the number 1 spot, while the Mediterranean diet came in second and Mediterranean-DASH Intervention for Neurodegenerative Delay (MND) Diet came in 3rd. The Weight Watchers Diet came in 4th tie with Therapeutic Lifestyle Changes (TLC), Mayo Clinic Diet and The Flexitarian Diet (casual vegetarian) 1.

In general, Weight Watchers Weight-Loss Program consists of tracking daily points (each point is about 50 kcal) based on your current weight and weight loss goals. Though a recommended macronutrient intake was not clearly specified, this program is generally consistent with the National Academy of Sciences acceptable macronutrient distribution ranges for adults, which are 45-65% carbohydrates, 10-35% protein and 20-35% fats 2. Thirty minutes of exercise on most days of the week was encouraged. You can earn FitPoints for walking, cleaning, gardening.

Participants were typically provided with access to weekly group meetings and support, behavioral counseling, individual contact with the dietitian
and educational resources such as recipes and meal ideas, as well as community discussion boards.

In December 2015, Weight Watchers introduced a new plan called SmartPoints 3. It tries to help people make smarter food choices and build a better relationship with food. Similar to their other points-based plans, every food and drink is assigned a points value. SmartPoints is calculated using calories, saturated fat, sugar and protein. No food is off-limits, but the plan assigns higher points values to foods higher in sugar or saturated fat, and lower points values to lean proteins. Most fruits and vegetables are zero points, similar to the old PointsPlus plan. Some condiments are no longer free, such as ketchup, due to the sugar content.

In short, the foods you choose to eat are converted into points. Each day, you’re allotted a certain number of points, with exercise giving you the option to earn more points. The number of points you’re allowed depends on your current weight, your weight loss goals, and so on. You get to eat a certain amount of points per day with a bank of extra points each week for days when you want to eat or drink more.

You also get activity points, which you can dip into if you’re out of weekly points and daily points. The idea is for this to happen very rarely. There are going to be days or weeks where you just consume more than allotted. The idea is to just keep track of it all.

As you lose weight, you are given fewer daily points, which aids your weight loss. Once you get to your goal weight, your daily points allotment goes up.

In addition, most Weight Watchers weight loss programs include a day or so a week in which you can eat whatever you want. This is rooted in an understanding of how the metabolism works – if you’re consistently making healthy choices, your body can easily recover from a splurge every now and then. It’s a good program because it’s not about denying yourself the foods you love. Rather, it’s about making sure that you’re eating well enough to indulge every now and then.

Additionally, Weight Watchers is well integrated with technology such as smart-phones. WeightWatchers.com is a great resource. While the in-person groups work for many, other people want a more private experience.The Online Plus plan allows this. If you opt for the Online Plus plan, you’ll get the chance to work to lose weight at your own pace. It features an 8-week crash course in making better choices, including a 24/7 chat line.

Both the online plan and the in-person group plan feature great integration with iPhone and Android, as well as your regular internet browser. Track your points, read about exercise routines or recipes, and more.

You can follow the plan online on your own. You’ll track your food choices and exercise, chart progress, and find recipes and workouts. There’s a coaching option if you prefer one-on-one consultations by phone, email, and text. Or you can go to in-person group meetings, where you’ll weigh in.

  • Although the Weight Watchers program is heavily supported with meetings, it can also be expensive. The start of the meetings is around $13.00 per meeting depending on the area that you live.
  • Group meetings are not for everyone. This is another reason why the online version works for many people, but you are not going to get the full experience.
  • Weekly weigh ins are required, and this may not be for everyone. Some people will be intimidated, and discouraged by weekly weigh ins.
  • Not as structured as most programs, which causes problems for some people.
  • If you don’t know your way around the kitchen, the premade meals and snacks make it easy. They’re a quick and easy way to control portion sizes and calories.
  • Unhealthy foods are allowed within this program, which do not promote health and long-term success.

Here are the key principles of Weight Watchers weight loss program

1) Talk and Plan

  • Establish goals
  • Start a basic document/spreadsheet
    > Record goals
    > Record BMI
  • Discuss weight loss methods : Start a discussion on what each of you would like to achieve and document this. You may want to drop down to a specific weight, target fat percentage or fit into certain size clothing. Throw around some ideal but realistic dates based on the idea that healthy weight loss is no more than 2 pounds (0.9kg) per week.
  • Document your starting weight and we strongly recommend you measure your body fat percentage. We think this is the best measure of performance as your overall weight is determined by muscle and fat weight amongst other things. We are concerned with fat lost above all things, losing muscle is not the ideal way to lose weight.
  • Motivate and get excited. It sounds silly to suggest you get motivated and excited. But just remember, you are going to be working as a team to achieve your goals to be healthier, better looking and happier people, it’s not hard to be motivated and excited by this prospect.

Food

  • Discuss dietary habits
  • Establish foods to avoid or eliminate
  • With your team you can have discussions about your diet. The types of foods you like to eat and eat regularly and consequently what foods you need to be more conscience about cutting down or avoiding altogether. Run past each other what meals you are eating throughout the day and during conversations you will naturally start to share ideas and tips.
  • Know Your Calories
  • Have a points system like SmartPoints used by Weight Watchers where every food gets a value as a way of evaluating food based on kilojoules, saturated fat, sugar and protein. Stick to your personalised budget and start seeing results. In order to keep this points system simple and easy to use, choose low carbohydrates and low ‘bad’ fat healthy foods. Calorie charts and understanding the calorie content of the foods you are ingesting became crucial to your diets also. This calorie calculator is an excellent tool that will help you understand how many calories you need to consume in order to keep losing weight for the duration of your goal.
  • Enjoy your food. If you do not enjoy your food then your efforts to eat better will fail. There are many foods to choose from and you will need to find the foods that you enjoy.
  • Don’t starve yourself. Not eating is one of the worst things you can do. You will feel physically and emotionally unbalanced. You will crave bad food, your metabolism will slow down and your body will go into starvation mode holding onto fat stores.
  • Drink plenty of water.
  • Listed the foods we would eliminate or enjoy only occasionally
    > Soft drink
    > Milk tea
    > Roast duck
    > Oily or fatty foods at restaurants
    > Buttered popcorn
    > Baked pastries
    > Dark chocolate instead of milk chocolate
    > Fried chips
    > Potato crisps
    > Sugar as an ingredient
    > White rice and bread
  • Listed the foods that we would eat more of and incorporate into our diets
    > Brown rice
    > Vegetables
    > Fruit
    > Yoghurt
    > Rice Cakes
    > Drink more water
    > Salmon and Sashimi
    > Whole grain bread with seeds
    > Oats for breakfast
    > Clear soups
    > Tuna – from a can, in a pasta dish (click here for recipe), in a salad, or with brown rice and vegetables just to name a few examples
    > Honey as a sweetener
    > Tea – even better without sugar, herbal such as green

2) Meeting (Support)

  • One Meeting
  • Same Time
  • Every Week

Decide on a day each week to put aside to meet, discuss your weight loss efforts and for the all important weigh in. The day of the week should be chosen carefully to ensure the meetings will occur every single week of the competition. Make the meeting a high priority, just as losing weight and being at your healthiest weight is a high priority itself. It’s also a fantastic excuse to get together.

Try to mimic the exact same conditions for the weigh in each week. Preferably the same time of the day and before you have a main meal to ensure that results from the weigh in are more accurate.

Fundamental to the Weight Watchers meeting experience is a weekly weigh-in to track progress. Many people find the accountability of being weighed by another person helpful to their weight-loss efforts.

Group System

One of the main appeals to the Weight Watchers system is that it involves regular group meetings. Now, maybe you’re thinking that the last thing you’d want to do is meet up and talk about losing weight. Weight loss is intensely personal and a lot of your self-esteem and sense of yourself is wound up in how attractive you think you are.

However, it’s for exactly this reason that the group meetings are so important. Meeting regularly with other people working hard to get – and stay – healthy is one of the reasons why the program boasts such success. Not only do you have a group of peers (even friends) to stay accountable to, you also can see what works and doesn’t work for others, and learn that you’re not in it alone.

3) Psychological (Behavior)

Despite knowing the logic behind weight loss and the nature of fluctuations, it is still all too easy to become discouraged. Having your friends there to support and reaffirm the nature of weight loss is extremely important.

  • Encouragement
  • Motivation
  • Reward
  • Penalty: Discouragement is one of the key setbacks for weight loss which is a main reason why having the support of friends who are sharing the weight loss experience is so beneficial. Having people to motivate and encourage you to do your best and to pick you up during moments when you feel discouraged will help keep you on track.
  • Reward and penalty. Friendly competition is a common motivator for many people (not so much for others) and for many participants the thought of beating each other was sweet while the thought of being left behind, not so much. A competition can be set up with rewards and even penalties if you wish. Of course there are other ways of rewarding yourself for healthy consistent weight loss. Indulging in fatty or sugary foods should not be one of them.
  • Tracking. Tracking your progress is very important. It will show your team if you are moving in the right direction and whether you need to change your approach.
  • Weekly Weigh In. The main event of your meeting will be your weigh-in which can be an intimidating experience, even amongst friends. Losing weight will make you feel ecstatic, but not losing weight or putting it on is a completely different story.

4) Exercise

Once you start to exercise it will raise your metabolism and losing weight will be easier. You will also feel much better. Burn more then you eat. In order to lose weight you must burn more calories than you are putting in, so the need to exercise to lose weight is very important. Not only that, it is of enormous benefit to your overall physical and mental health. Have Fun!

The more active you are, the more calories you can consume. Remember, you don’t want your body going into starvation mode. (you can specify your level of physical activity on this calorie counter). It is the same as using exercise to increase your Weight Watchers point allowance.

Some form of exercise every day.

Intense exercise a few times a week.

Being active with your team mates or on your own are both fantastic. Exercising by yourself is a nice way to relieve stress and to clear your thoughts while exercising with your team is a lot of fun and motivating.

Cardio and Strength training

Both Cardio and strength training contribute to weight loss with muscle helping you to burn more calories throughout the day and just doing wonders for your overall health.
The same rule applies to exercise as it does with diet. If you hate it, don’t bother. There are many ways of being active and exercising; you just have to find the one you enjoy. It might seem unlikely for some people that they will find a physical activity they will enjoy, but once you get started, give it ago and start to feel healthier and more capable, you will be very surprised.

Give cycling, jogging or cycling a try on routes that you find interesting or scenic, preferably close to your home. Many people find walking or jogging with music very enjoyable. Give group activities like mountain climbing, tennis, kayaking etc ago. It could become a very enjoyable weekly event.

Here are some exercises you can tryout:

  • Walked or cycled to and from work.
  • Intensive boxing lessons in the park with your own trainer.
  • Changed the intensity of our workouts often relating it to your diet.
  • Try different sports such as squash and mountain climbing.
  • Do both Cardio AND Strength training for females also !
  • Established a list of the exercises that you enjoyed, ensuring they covered the different parts of your bodies.
  • Changed the exercises you did regularly so that we would be pushed and tested in different ways. This maximizes the efficiency of exercise.
  • Made an effort to do 2 cardio and 2 strength training sessions per week.
  • If you do not like the gym, do all your cardio at the park and your strength training at home with free weights and other exercises that don’t require equipment.

Average Weight Loss on Weight Watchers Per Week

The average weight loss on the Weight Watchers Weight Loss Programs vary between individuals, some people are more successful and others are less successful and may even regain the weight they have lost and then some extra pounds.

Members who dutifully track their points can lose quite a few pounds the first week. Generally, people lose about 1-2 pounds a week.

Participants lose weight by creating a calorie deficit.[4] Weight Watchers is generally compatible with other diet approaches and/or food intake restrictions, provided participants use the Weight Watchers framework to measure and limit the quantity of food consumed while using the other diet plan to dictate the range of acceptable food choices.

If you plateau, the app gives you tips or changes your daily point count in order to help you keep losing. The company also has blog posts and message boards where you can seek out tips.

If you are wondering what is the best weight loss programs there are out there, you want to read the most comprehensive review (meta-analysis) conducted to date, a team of researchers 4, analyse all available articles and randomised trials on all popular branded diets including macronutrient composition diets (low carbohydrate, low fat, high protein, high fat).

Summary:

  • Weight loss differences between individual brand named diets were small with likely little importance to those seeking weight loss. For example, the Atkins diet resulted in a 1.71 kg greater weight loss than the Zone diet at 6-month follow-up.
  • The largest and most significant weight loss was associated with low-carbohydrate diets (8.73 kg at 6-month follow-up and 7.25 kg at 12-month follow-up) and low-fat diets (7.99 kg at 6-month follow-up and 7.27 kg at 12-month follow-up) than no dietary intervention over a 12-month period.
  • Behavioral support and exercise enhanced weight loss.

This study supports the practice of recommending any diet that a person will adhere to in order to lose weight 5.

Conclusion

Weight Watchers is good for anyone. Its focus on nutritious, low-calorie foods makes it great for people with high blood pressure or cholesterol, diabetes, and even heart disease.

In addition to Weight Watchers membership plans, other products (such as packaged foods, exercise equipment and DVDs, food preparation and storage tools, cookbooks, etc.) are available for purchase. Be prepared to spend some cash to get the full benefits of the robust program. It can be a bit costly, but it’s well worth it to reap the health perks of losing weight and keeping it off.

The key to successful weight loss is developing healthy diet and exercise habits. Diet just means eating healthy, lower calorie meals. Exercise means being more physically active.

Although people appropriately focus on diet when they’re trying to lose weight, being active also is an essential component of a weight-loss program. When you’re active, your body uses energy (calories) to move, helping to burn the calories you take in with food you eat.

References
  1. U.S. News & World Report L.P. Best Diets Overall. http://health.usnews.com/best-diet/best-diets-overall
  2. http://www.weightwatchers.com/util/art/index_art.aspx?art_id=20921&tabnum=1&sc=805&subnav=Science+Library%3a+Health
  3. Weight Watchers. Our Approach. https://www.weightwatchers.com/us/our-approach
  4. Johnston BC, Kanters S, Bandayrel K, Wu P, Naji F, Siemieniuk RA, Ball GDC, Busse JW, Thorlund K, Guyatt G, Jansen JP, Mills EJ. Comparison of Weight Loss Among Named Diet Programs in Overweight and Obese Adults. A Meta-analysis. JAMA. 2014;312(9):923-933. doi:10.1001/jama.2014.10397. http://jamanetwork.com/journals/jama/fullarticle/1900510
  5. Johnston BC, Kanters S, Bandayrel K, Wu P, Naji F, Siemieniuk RA, Ball GDC, Busse JW, Thorlund K, Guyatt G, Jansen JP, Mills EJ. Comparison of Weight Loss Among Named Diet Programs in Overweight and Obese AdultsA Meta-analysis. JAMA. 2014;312(9):923-933. doi:10.1001/jama.2014.10397. http://jamanetwork.com/journals/jama/fullarticle/1900510
read more
Diet PlanDiet, Food & Fitness

Does a High Fiber Diet Help With Weight Loss ?

high fiber diet foods

High Fiber Diet

Dietary fiber, also known as roughage or bulk, is the part of a plant that the body doesn’t absorb during digestion. Fibre is the part of food that is not digested in the small intestine. Dietary fibre moves largely unchanged into the large intestine or colon where it is fermented by friendly bacteria that live there. The scientific community define dietary fibre as intrinsic plant cell wall polysaccharides of vegetables, fruits and whole-grains, the health benefits of which have been clearly established, rather than synthetic, isolated or purified oligosaccharides and polysaccharides with diverse, and in some cases unique, physiological effects 1. Generally speaking, dietary fiber is the edible parts of plants or similar carbohydrates, that are resistant to digestion and absorption in the small intestine. Fiber can be soluble, which means it dissolves in water, or insoluble.

Eating a range of dietary fiber can:

  • Improve the diversity of your microbiota
  • Improve constipation and lactose intolerance
  • Enhance immunity
  • Reduce inflammation in your gut

Benefits of a high-fiber diet:

  • Normalizes bowel movements. Dietary fiber increases the weight and size of your stool and softens it. A bulky stool is easier to pass, decreasing your chance of constipation. If you have loose, watery stools, fiber may help to solidify the stool because it absorbs water and adds bulk to stool.
  • Helps maintain bowel health. A high-fiber diet may lower your risk of developing hemorrhoids and small pouches in your colon (diverticular disease). Studies have also found that a high-fiber diet likely lowers the risk of colorectal cancer. Some fiber is fermented in the colon. Researchers are looking at how this may play a role in preventing diseases of the colon.
  • Lowers cholesterol levels. Soluble fiber found in beans, oats, flaxseed and oat bran may help lower total blood cholesterol levels by lowering low-density lipoprotein, or “bad,” cholesterol levels. Studies also have shown that high-fiber foods may have other heart-health benefits, such as reducing blood pressure and inflammation.
  • Helps control blood sugar levels. In people with diabetes, fiber — particularly soluble fiber — can slow the absorption of sugar and help improve blood sugar levels. A healthy diet that includes insoluble fiber may also reduce the risk of developing type 2 diabetes.
  • Aids in achieving healthy weight. High-fiber foods tend to be more filling than low-fiber foods, so you’re likely to eat less and stay satisfied longer. And high-fiber foods tend to take longer to eat and to be less “energy dense,” which means they have fewer calories for the same volume of food.
  • Helps you live longer. Studies suggest that increasing your dietary fiber intake — especially cereal fiber — is associated with a reduced risk of dying from cardiovascular disease and all cancers.

Fiber includes carbohydrates called polysaccharides and resistant oligosaccharides. Recent research suggests that fiber should be categorized by its physical characteristics; how well it dissolves (solubility), how thick it is (viscosity) and how well it breaks down (fermentability). Some commonly known terms are described below:

  • Soluble fiber including pectins and beta glucans is found in foods like oats, peas, beans, apples, citrus fruits, carrots, barley and psyllium. Soluble fiber dissolves in water to form a gel-like material. It can help lower blood cholesterol and glucose levels. Foods high in soluble fiber can help you feel full. They also help reduce constipation by speeding up the time it takes for feces (poop) to pass through your body.
  • Insoluble fiber including cellulose is found in wheat bran and nuts. Insoluble fiber is a type of fibre that doesn’t dissolve in water. Because insoluble fiber absorbs water, it helps to soften the contents of your bowel, contributing to keep the bowels regular. Insoluble fiber promotes the movement of material through your digestive system and increases stool bulk, so it can be of benefit to those who struggle with constipation or irregular stools. Whole-wheat flour, wheat bran, nuts, beans and vegetables, such as cauliflower, green beans and potatoes, are good sources of insoluble fiber.
  • Resistant starch is a soluble fiber that is highly fermentable in the gut. It gets broken down by good bacteria to produce short chain fatty acids (SCFAs). Resistant starch is naturally present in some foods such as bananas, potatoes, grains and pulses. Freekeh, a Middle Eastern grain available in some supermarkets, is another good source. In general, foods that are less highly processed contain more resistant starch. Different ways of cooking can create different amounts of resistant starch. For example, resistant starch is found in slightly undercooked (‘al dente’) pasta, cooked but cooled potatoes (including potato salad), under-ripe bananas, beans, lentils and a product called Hi-maize used in some breads and breakfast cereals.
  • Prebiotics are types of carbohydrate that only our gut bacteria can feed upon. Some examples are onions, garlic, asparagus and banana

The amount of soluble and insoluble fiber varies in different plant foods. To receive the greatest health benefit, eat a wide variety of high-fiber foods.

Good sources of dietary fiber include:

  • Pulses (like lentils and peas) and beans and legumes (think navy beans, small white beans, split peas, chickpeas, lentils, pinto beans)
  • Fruits and vegetables, vegetables such as carrots, broccoli, green peas, and collard greens; fruits especially those with edible skin (like pears and apples with the skin on) and those with edible seeds (like berries)
  • Nuts—try different kinds (pumpkin seeds, almonds, sunflower seeds, pistachios and peanuts are a good source of fiber and healthy fats, but be mindful of portion sizes, because they also contain a lot of calories in a small amount!)
  • Whole grains such as:
    • Quinoa, barley, bulgur, oats, brown rice and farro
    • Whole wheat pasta
    • Whole grain cereals, including those made from whole wheat, wheat bran and oats

Choose fiber rich foods from a variety of sources including wholegrains, fruit and vegetable, nuts and seeds, beans and pulses. When you read food labels check for the grams of fiber per serving or per 100g. Foods that are naturally high in fiber and contain at least 3 grams per 100 gram are often labeled as a “good source,” and foods labeled as “excellent source” contain more than 5 grams of fiber per serving.

Depending on your age and sex, adults should get 25 to 31 grams of fiber a day 2. Older adults sometimes don’t get enough fiber because they may lose interest in food.

  • Men over the age of 50 should get at least 38 grams of fiber per day.
  • Women over the age of 50 should get 25 grams per day.
  • Children ages 1 to 3 should get 19 grams of fiber per day.
  • Children between 4 and 8 years old should get 25 grams per day.
  • Girls between 9 and 18 should get 26 grams of fiber each day. Boys of the same age range should get between 31 and 38 grams of fiber per day.

High-fiber foods are good for your health. But adding too much fiber too quickly can promote intestinal gas, abdominal bloating and cramping. Increase fiber in your diet gradually over a period of a few weeks. This allows the natural bacteria in your digestive system to adjust to the change.

Also, drink plenty of water. Fiber works best when it absorbs water, making your stool soft and bulky.

Tips for fitting in more fiber into your diet:

  • For breakfast choose a high-fiber breakfast cereal — 5 or more grams of fiber a serving. Opt for cereals with “whole grain,” “bran” or “fiber” in the name. Or add a few tablespoons of unprocessed wheat bran to your favorite cereal.
  • Switch to whole grains. Consume at least half of all grains as whole grains. Look for breads that list whole wheat, whole-wheat flour or another whole grain as the first ingredient on the label and have least 2 grams of dietary fiber a serving. Experiment with brown rice, wild rice, barley, whole-wheat pasta and bulgur wheat.
  • Bulk up baked goods. Substitute whole-grain flour for half or all of the white flour when baking. Try adding crushed bran cereal, unprocessed wheat bran or uncooked oatmeal to muffins, cakes and cookies.
  • Lean on legumes. Beans, peas and lentils are excellent sources of fiber. Add kidney beans to canned soup or a green salad. Or make nachos with refried black beans, lots of fresh veggies, whole-wheat tortilla chips and salsa.
  • Eat more fruit and vegetables. Fruits and vegetables are rich in fiber, as well as vitamins and minerals. Try to eat five or more servings daily.
  • Make snacks count. Fresh fruits, raw vegetables, low-fat popcorn and whole-grain crackers are all good choices. An occasional handful of nuts or dried fruits also is a healthy, high-fiber snack — although be aware that nuts and dried fruits are high in calories.

Today more than 80 percent of the U.S. population eats less than the recommended amount of vegetables, about 70 percent of the population eats more saturated fat, sodium and added sugar than is recommended. That is because the top three sources of calories in the U.S. are burgers, sandwiches and tacos; followed by desserts, sweet snacks and sugar-sweetened beverages, according to the most recent data from the National Health and Nutrition Examination Survey 3. Poor diet is classified as a diet high in saturated fat, low dietary fiber and high simple carbohydrates. This diet would be consistent with a high glycemic index and high glycemic load being higher in easily digestible and rapidly absorbable carbohydrates. In a supportive, eight year study of over 90,000 female nurses, Shuzle et al. 4 found a positive correlation between glycemic index and risk of type two diabetes. This association was significant even after adjusting for age, body mass index (BMI) and family history. Several means have been proposed to understand the physiology behind the relationship of glycemic index and diabetes. First, carbohydrates with a higher glycemic index produce higher blood glucose levels. This chronic hyperglycemia is suggested to lead to the dysfunction of beta cells in the pancreas thus decreasing insulin release. Second, due to an over abundance of energy (i.e., high glycemic load) tissues such as skeletal muscle, liver and adipose become resistant to insulin.

Although a majority of studies show a positive correlation between high glycemic foods and type 2 diabetes, several studies disagree with these findings. Meyer et al. 5 found that glycemic index had no effect on the prevalence of type 2 diabetes in older aged women. However, there was a strong inverse relationship between dietary fiber intake and type 2 diabetes when adjusted for age and BMI. Women consuming an average of 26 g/day of dietary fiber had a 22% lower risk of developing diabetes when compared to women only consuming 13 g/d. Schulze et al. 4 agreed with these findings with men and women showing a decreased risk of diabetes with the consumption of an additional 12 g of dietary fiber per day. According to these findings, it may be more significant to focus on an increased consumption of dietary fiber to prevent diabetes than glycemic index/load. It is also important to note that the inverse relationship between dietary fiber and diabetes observed by Meyer et al. 6 and Schulze et al. 4 was independent of age and body weight. Hu et al. 7 supported these findings while correcting for age, fat intake, smoking, alcohol, family history, exercise, and body weight. Therefore, it seems that dietary fiber is associated with type two diabetes, independent of other compounding factors.

According to recent research, the soluble versus insoluble fraction of fiber may give some insight on the efficacy of dietary fiber on diabetes and its mechanisms. Although some studies have been contradictory, showing no differentiation between soluble and insoluble fiber on diabetes 4, a majority of the research demonstrates a strong inverse relationship between insoluble fiber and the risk of type two diabetes. Meyer et al. 5 using healthy middle aged women, observed a strong inverse relationship between insoluble fiber and the risk of type two diabetes while soluble fiber had no effect. Montonen et al. 8 also found the same results in healthy middle aged men and women consuming increased levels of whole rye bread. Interestingly, fiber from fruits and vegetables had no effect on the risk of developing type two diabetes. Earlier studies have agreed with these findings. A large epidemiological study of 42,000 men found that dietary fiber from fruits or vegetables had no effect on the risk of diabetes. However, dietary fiber from whole cereal grains showed a significant decrease in diabetes occurrence 9. Daily intakes of fiber among all groups were similar.

high fiber diet foods

Insoluble fiber only has a small effect on macronutrient absorption 10. Therefore, another mode of action must be present and several hypotheses should be discussed. Some suggest that insoluble fiber increases the passage rate of foodstuff through the gastrointestinal tract thus resulting in a decreased absorption of nutrients, namely simple carbohydrates. However, Weicket et al. 11 found that an increased intake of cereal fiber significantly improved whole body glucose disposal resulting in an 8% improvement of insulin sensitivity. This suggests that the mechanisms behind insoluble fiber are more peripheral and not limited to nutrient absorption. First, an accelerated secretion of glucose-dependent insulintropic polypeptide was observed directly after the ingestion of an insoluble fiber in healthy women 12. Glucose-dependent insulintropic polypeptide is an incretin hormone which stimulates postprandial insulin release. Second, insoluble fiber can result in a reduced appetite and food intake 13. This may lead to a decreased caloric intake and BMI. Third, short chain fatty acids, via fermentation, have been shown to reduce postpandrial glucose response 14, 15. Early research demonstrated that lipid infusions impaired glucose utilization 16 and oral acetate could decrease free fatty acids in the blood 17. According to Kelley and Mandarino 18, increases in free fatty acid in the blood can inhibit glucose metabolism through the inhibition of GLUT 4 transporters. Therefore, short chain fatty acids, by way of decreasing serum free fatty acids, may reduce blood glucose levels through competition in insulin–sensitive tissues.

As a result of the poor diet, many Americans are not getting adequate amount of nutrients. These include potassium, dietary fiber, choline, magnesium, calcium, and vitamins A, D, E, and C. Iron also is under consumed by adolescent girls and women ages 19 to 50 years. Low intakes for most of these nutrients occur within the context of unhealthy overall eating patterns, due to low intakes of the food groups—vegetables, fruits, whole grains, and dairy—that contain these nutrients. Low intakes of dietary fiber are due to low intakes of vegetables, fruits, and whole grains. Low intakes of potassium are due to low intakes of vegetables, fruits, and dairy. Low intakes of calcium are due to low intakes of dairy. 19.

Dietary fiber and whole grains contain a unique blend of bioactive components including resistant starches, vitamins, minerals, phytochemicals and antioxidants. As a result, research regarding their potential health benefits has received considerable attention in the last several decades. Epidemiological and clinical studies demonstrate that consumption of dietary fiber and whole grain intake is inversely related to obesity 20, type two diabetes 5, cancer 21 and cardiovascular disease 22.

  • Eating fibre and wholegrain foods is linked to a lower risk of obesity, type 2 diabetes and heart disease, and may also reduce the risk of bowel cancer.
  • Eating high fibre foods can also help prevent constipation – this in turn can help to prevent hemorrhoids.
  • Because high fibre foods are filling they may also make it easier to stay at a healthy weight.
  • Foods high in fibre are generally good sources of vitamins and minerals, as well as other important nutrients.

The Food and Drug Administration (FDA) has approved two health claims for dietary fiber. The first claim states that, along with a decreased consumption of fats (<30% of calories), an increased consumption of dietary fiber from fruits, vegetables and whole grains may reduce some types of cancer 23. “Increased consumption” is defined as six or more one ounce equivalents, with three ounces derived from whole grains. A one ounce equivalent would be consistent with one slice of bread, ½ cup oatmeal or rice, or five to seven crackers. The second FDA claim supporting health benefits of dietary fiber states that diets low in saturated fat (<10% of calories) and cholesterol and high in fruits, vegetables and whole grain, have a decreased risk of leading to coronary heart disease 24. For most, an increased consumption of dietary fiber is considered to be approximately 25 to 35 g/d, of which 6 g are soluble fiber.

Dietary fiber and whole grains are an abundant source of nutrients including vitamins, minerals, and a slowly digestible energy. In addition, they contain phytochemicals such as phenolics, carotenoids, lignans, beta-glucan and inulin. These chemicals, secreted by plants, are not currently classified as essential nutrients but may be important factors in human health 25. The synergistic effect of phytochemicals, increased nutrient content and digestive properties, are believed to be the mechanism behind dietary fibers beneficial effects on the treatment and prevention of obesity and diabetes 26, 27, reduced cardiovascular disease 28 and decreased incidence of certain types of cancer 29, 30.

Recent studies support this inverse relationship between dietary fiber and the development of several types of cancers including colorectal, small intestine, oral, larynx and breast 21, 31, 32. Although most studies agree with these findings, the mechanisms responsible are still unclear. Several modes of actions however have been proposed. First, dietary fiber resists digestion in the small intestine, thereby allowing it to enter the large intestine where it is fermented to produce short chain fatty acids, which have anti-carcinogenic properties 33. Second, since dietary fiber increases fecal bulking and viscosity, there is less contact time between potential carcinogens and mucosal cells. Third, dietary fiber increases the binding between bile acids and carcinogens. Fourth, increased intake of dietary fiber yield increased levels of antioxidants. Fifth, dietary fiber may increase the amount of estrogen excreted in the feces due to an inhibition of estrogen absorption in the intestines 34. Obviously, many studies support the inverse relationship of dietary fiber and the risk for coronary heart disease. However, more recent studies found interesting data illustrating that for every 10 g of additional fiber added to a diet the mortality risk of coronary heart disease decreased by 17–35% 35, 22. Risk factors for CHD include hypercholesterolemia, hypertension, obesity and type two diabetes. It is speculated that the control and treatment of these risk factors underlie the mechanisms behind dietary fiber and coronary heart disease prevention. First, soluble fibers have been shown to increase the rate of bile excretion therefore reducing serum total and LDL “bad” cholesterol 36. Second, short chain fatty acid production, specifically propionate, has been shown to inhibit cholesterol synthesis 37. Third, dietary fiber demonstrates the ability to regulate energy intake thus enhancing weight loss or maintenance of a healthier body weight. Fourth, either through glycemic control or reduced energy intake, dietary fiber has been shown to lower the risk for type two diabetes. Fifth, dietary fiber has been shown to decrease pro-inflammatory cytokines such as interleukin-18 which may have an effect on plaque stability 38. Sixth, increasing dietary fiber intake has been show to decrease circulating levels of C-Reactive protein, a marker of inflammation and a predictor for coronary heart disease 39.

Fiber supplements and fortified foods

Whole foods rather than fiber supplements are generally better. Fiber supplements — such as Metamucil, Citrucel and FiberCon — don’t provide the variety of fibers, vitamins, minerals and other beneficial nutrients that foods do.

Another way to get more fiber is to eat foods, such as cereal, granola bars, yogurt, and ice cream, with fiber added. The added fiber usually is labeled as “inulin” or “chicory root.” Inulin, a plant compound commonly extracted from chicory root that can make low-fat foods taste creamier and add sweetness. Inulin also is derived from byproducts of sugar production from beets. Soluble corn fiber, which replaces traditional sweeteners as well as adding fiber, is also turning up on ingredient lists.

However be vigilant and cautious about eating certain foods with added fiber, especially if they come with lots of calories with added sugar, salt, or fat.

Some people complain of gassiness after eating foods with added fiber.

However, some people may still need a fiber supplement if dietary changes aren’t sufficient or if they have certain medical conditions, such as constipation, diarrhea or irritable bowel syndrome. Check with your doctor before taking fiber supplements.

What is Dietary Fiber?

Dietary fiber is found mainly in plant-based foods including fruits, vegetables, wholegrains and legumes — is probably best known for its ability to prevent or relieve constipation. Dietary fiber also known as roughage or bulk, includes the parts of plant foods your body can’t digest or absorb. Generally speaking, dietary fiber is the edible parts of plants, or similar carbohydrates, that are resistant to digestion and absorption in the small intestine. Unlike other food components, such as fats, proteins or carbohydrates — which your body breaks down and absorbs — fiber isn’t digested by your body. Instead, it is completely or partially broken down (fermented) by bacteria in your large intestine. Once broken down in your large intestine, it has been suggested that dietary fibers increase the good bacteria in your gut. This improves your immune system and supports your immunity against inflammatory disorders and allergies. Furthermore, a high fiber diet can provide other health benefits as well, such as helping you to maintain a healthy weight and lowering your risk of type 2 diabetes, heart disease and some types of cancer including bowel cancer. For example, high quality randomized controlled trials have shown that eating oat bran leads to lower blood pressure and lower total cholesterol.

Dietary fiber can be separated into many different fractions. Recent research has begun to isolate these components and determine if increasing their levels in a diet is beneficial to human health. These fractions include arabinoxylan, inulin, pectin, bran, cellulose, β-glucan and resistant starch. The study of these components may give us a better understanding of how and why dietary fiber may decrease the risk for certain diseases 40.

Over the years, the definition of dietary fibre has been subject to much discussion. The most recent definitions, from about 2008 41, have general global agreement. Dietary fibre is made up of carbohydrate polymers with three or more monomeric units (MU), which are neither digested nor absorbed in the human intestine and includes: (1) Non Starch Polysaccharides (NSP) from fruits, vegetables, cereals and tubers whether intrinsic or extracted, chemically, physically and/or enzymically modified or synthetic (MU≥10); (2) resistant (non-digestible) oligosaccharides (RO) (MU 3–9); and (3) resistant starch (RS) (MU≥10). When extracted, chemically, physically and/or enzymically modified or synthetic, generally accepted scientific evidence of benefits for health must be demonstrated to consider the polymer as dietary fibre. Most definitions also include ‘associated substances’, which are non-carbohydrate such as lignin and substances which are present in cell walls linked to polysaccharides and quantified as dietary fibre by the accepted analytical methods (Table 1).

Dietary fiber is often subdivided into oligosaccharides (monosaccharide units number 3–9) resistant oligosaccharides (RO) and polysaccharides, including non-starch polysaccharides (NSP) and resistant starch (RS), with a minimum MU number of 10 42, provided in an overview in Figure 1. Dietary fiber also comprises ‘associated substances’.

Table 1. Principal definitions of dietary fiber

fiber definitions

[Source 43 ]

Footnote: MU = monosaccharide units; DF = dietary fiber; RS = resistant starch; RO = resistant oligosaccharides; DP = degree of polymerisation; NDC = non-digestible carbohydrates; NSP = Non Starch Polysaccharides. The minimum number of carbohydrate monosaccharide units to be included; the European Union (EU) definition prescribes a minimum monosaccharide units number (sometimes called ‘degree of polymerisation’) of 3, while Codex Alimentarius prescribes a minimum of 10 but leaves to the local authority the decision on whether or not to include carbohydrates with an monosaccharide units number of 3 to 9. Since many countries outside the EU have no local regulatory definition, the default is to adopt the Codex definition of monosaccharide units number≥10. As a consequence, in these countries, resistant oligosaccharides (RO) are or are not considered as dietary fibre, independently from the demonstration of a beneficial effect.

Figure 1. Some examples of potential fiber sources.

fiber sources

Footnote: NSP = Non Starch Polysaccharides

[Source 43 ]

Unlike other food components, such as fats, proteins or carbohydrates — which your body breaks down and absorbs — fiber isn’t digested by your body. Instead, it passes relatively intact through your stomach, small intestine and colon and out of your body.

The American Association of Cereal Chemists 44, define “dietary fiber is the edible parts of plants or analogous carbohydrates that are resistant to digestion and absorption in the human small intestine with complete or partial fermentation in the large intestine. Dietary fiber includes polysaccharides, oligosaccharides, lignin, and associated plants substances. Dietary fibers promote beneficial physiological effects including laxation, and/or blood cholesterol attenuation, and/or blood glucose attenuation” 45. The World Health Organization (WHO) and Food and Agriculture Organization (FAO) agree with the American Association of Cereal Chemists International (AACCI) definition but with a slight variation. They state “Dietary fibre means carbohydrate polymers1 with ten or more monomeric units, which are not hydrolysed by the endogenous enzymes in the small intestine of humans and belong to the following categories: that dietary fiber is a polysaccharide with ten or more monomeric units which is not hydrolyzed by endogenous hormones in the small intestine” 46.

Recent research has begun to isolate these components and determine if increasing their levels in a diet is beneficial to human health. The separation of these fractions may give us a better understanding of how and why dietary fiber may decrease the risk for certain diseases.

Table 2. Components of dietary fiber according to the American Association of Cereal Chemists

Non Starch Polysaccharides and Oligosaccharides
Cellulose
Hemicellulose
Arabinoxylans
Arabinogalactans
Polyfructoses
Inulin
Oligofructans
Galacto-oligosaccharides
Gums
Mucilages
Pectins
Analagous carbohydrates
Indigestible dextrins
Resistant maltodextrins
Resistant potato dextrins
Synthesized carbohydrates compounds
Polydextrose
Methyl cellulose
Hydroxypropylmethyl cellulose
Resistant starches
Lignin substances associated with the Non Starch Polysaccharides (NSP) and lignin complex
Waxes
Phytate
Cutin
Saponins
Suberin
Tannin
[Source: American Association of Cereal Chemists 44 ].

Table 3. Authorized health claims related to dietary fibre in the European Union (EU) (European Commission 2014), in the USA (Food and Drug Administration 2013) and in Australia/New Zealand (Food Standards Australia New Zealand 2013)

dietary fiber health claims

[Source 43]

Table 4. Recommended for intake amount of specific fibers (subtypes of fibres) based on health claims

fiber intake amount based on health claims

[Source 43]

Arabinoxylan

Arabinoxylan, a constituent of hemicelluloses, is comprised of a xylose backbone with arabinose side chains. Arabinoxylan is a major component of dietary fiber in whole grains having considerable inclusions in both the endosperm and bran. In wheat, Arabinoxylan account for around 64–69% of the structural carbohydrates (complex carbohydrates, non-starch polysaccharide are resistant to digestion in the small intestine and require bacterial fermentation located in the large intestine) in the bran and around 88% in the endosperm 47. During normal wheat flour processing, a majority of the arabinoxylan is removed as a by-product. In the GI tract, arabinoxylan acts much like a soluble fiber being rapidly fermented by the microflora of the colon.

Lu et al. 48, observed an inverse relationship between the intake level of an arabinoxylan rich bread and postprandial glucose response in healthy adult subjects. When compared to the control, postprandial glucose levels were significantly lower with only 6 g of arabinoxylan rich fiber supplementation while 12 g produced the greatest benefit. Breads high in arabinoxylan also appear to control blood glucose and insulin in adults with an already impaired glucose tolerance 49. Fasting blood glucose, postprandial blood glucose and insulin were all significantly lower when adults with type two diabetes were supplemented with 15 g/d of an arabinoxylan rich fiber. The mode of action behind arabinoxylan on improving glucose tolerance is unknown. However, it is thought to be due to the high viscosity of the fiber inside the lumen of the GI tract, thereby slowing the rate of glucose absorption.

The lower glycemic index of arabinoxylan may also play a role. Breads made with a flour rich in arabinoxylan have a relatively low glycemic index of around 59. Whole wheat flour, although high in fiber, has a glycemic index of around 99 48. Arabinoxylan rich bread has a similar glycemic index to that of whole grain bread but offers some distinct advantages such as improved mouth feel and tenderness. There was no significant difference in the sensory analysis between the control and a bread containing 14% arabinoxylan rich fiber 48.

Inulin

Inulin is a polymer of fructose monomers and is present in such foods as onions, garlic, wheat, artichokes and bananas and is used to improve taste and mouthfeel in certain applications. It is also used as a functional food ingredient due to its nutritional properties. Because of this, inulin products can be used as a replacement for fat or soluble carbohydrates without affecting the taste and texture and still contribute to a foods nutritional value.

Enzymatic hydrolyses in the small intestine is minimal (<10%) since inulin consists of beta bonds. Therefore, it enters the large intestine and is almost completely metabolized by the microflora. When fermented, they tend to favor propionate production which, in turn, decreases the acetate to propionate ratio leading to decreased total serum cholesterol and LDL 37, which are important risk factors for coronary heart disease.

Inulin has also demonstrated the ability to contribute to the health of the human large intestine as a prebiotic 50. They demonstrated that inulin stimulated the growth of bifidobacteria while restricting the growth of potential pathogenic bacteria such as E. coli, Salmonella, and Listeria. This could prove to be beneficial in such disorders as ulcerative colitis and C. difficile infections. Rafter et al. 51 agreed with these findings and suggested they were the underlying mechanisms behind the observation that inulin decreased biological compounds associated with colonic cancer, including reduced colorectal cell proliferation and water induced necrosis, decreased exposure to genotoxins, and decreased interleukin-2 release.

Increased mineral absorption may also contribute to the functionality of inulin. Increased calcium absorption, by approximately 20%, was reported in adolescent girls supplemented with inulin 52. Results from Abrams et al. 53, support these findings in a longer (one year) study of pubertal boys and girls consuming an inulin supplement. Subjects in the treatment group also experienced increased bone mineral density when compared to the control. The mechanisms behind these findings are still unclear but may be due to increased calcium absorption from the colon or possibly an increased solubility in the lumen of the GI tract due to short chain fatty acids. Finally, it may increase absorption through an enhancement of vitamin D.

Inulin may also provide a way to prevent and treat obesity. Cani et al. 54 demonstrated that oligofructose, a subgroup of inulin, increased satiety in adults which led to a decrease in total energy intake. This is thought to be due to short chain fatty acids and their ability to increase appetite suppressing hormones such as glucagon-like peptide 1 (GLP-1).

Beta-glucan

Beta-glucan (β-glucan) is a linear polysaccharide of glucose monomers with β(1→4) and β(1→3) linkages and found in the endosperm of cereal grains, primarily barley and oats. β-glucan concentrations in North American oat cultivars range from 3.9% to 6.8% 55. β-glucan is water soluble and highly viscous at low concentrations 55.

The physiological benefits due to β-glucan seem to stem from their effect on lipid metabolism and postprandial glucose metabolism. Many studies agree an inverse relationship exists between consumption levels of β-glucan and cholesterol levels. Several recent studies, in both hypercholesterolemic 56 and healthy 57 subjects, found that the daily consumption of 5 g of β–glucan significantly decreased serum total and LDL cholesterol. Davidson et al. 58 found that only a daily consumption of 3.6 g β-glucan was needed to produce the same significant effects. The same relationship also has been reported to occur between β-glucan and postprandial glucose and insulin responses in both diabetic and healthy subjects. Biorklund et al. 59 found that 5 g of β-glucan from oats significantly decreased postprandial glucose and insulin levels in healthy adults. Tappy et al. 60 reported the same results in adult subjects diagnosed with type two diabetes who consumed 4.0, 6.0 or 8.4 g of β-glucan.

Most authors agree that β-glucan’s viscosity in the GI tract is the most probable mechanism in which it decreases serum cholesterol levels as well as improves post prandial glucose metabolism. This gellation property may decrease bile acid absorption by increasing intestinal viscosity and increase bile acid excretion. This subsequently results in a higher hepatic cholesterol synthesis because of the higher need for bile acid synthesis 61. The same viscosity may also delay glucose absorption into the blood thus lowering post prandial glucose and insulin levels. Nazare et al. 62 observed that 5 g of oat β–glucan added to an oat concentrate cereal significantly delayed, but did not reduce, total glucose absorption.

The production of short chain fatty acids from β-glucan may also be a probable mechanism behind its observed metabolic effects. Fermentation of oat β-glucan has been shown to yield larger amounts of propionate 63, 64. Propionate has been shown to significantly inhibit cholesterol synthesis in humans 37 and is thought to be due to the inhibition of the rate limiting enzyme HMG CoA reductase 65.

Not all research however, agrees that β-glucan can affect lipid and glucose absorption/metabolism. Keogh et al. 66 observed that treatments of 8.1 to 11.9 g/d of barley β-glucan had no effect on total or LDL cholesterol in mildly hyperlipidemic adults. Cugent-Anceau et al. 67 not only observed that 3.5 g of oat β-glucan added to soup did not alter serum lipid profiles, but also produced no change in postprandial glucose levels.

Pectin

Pectin is a linear polymer of galacturonic acid connected with α (1→4) bonds. Regions of this backbone are substituted with α (1→2) rhamnopyranose units from which side chains of neutral sugars such as galactose, mannose, glucose and xylose occur. Pectin is a water soluble polysaccharide that bypasses enzymatic digestion of the small intestine but is easily degraded by the microflora of the colon. Citrus fruit contains anywhere from 0.5% to 3.5% pectin with a large concentration located in the peel. Commercially extracted pectins are also available and are typically used in food applications which require a gelling or a thickening agent.

Inside the GI tract, pectin maintains this ability to form a gel or thicken a solution. This is thought to be the likely mechanism behind its many beneficial effects on health including dumping syndrome, improved cholesterol and lipid metabolism and diabetes prevention and control. However, pectin also contains some unique abilities that may treat or prevent other diseases/disorders such as intestinal infections, atherosclerosis, cancer and obesity.

Several recent clinical studies, demonstrated that oral pectin supplementation to children and infants reduced acute intestinal infections and significantly slowed diarrhea. This is thought to be due to a reduction in pathogenic bacteria such as Shigella, Salmonella, Klebsiella, Enterobacter, Proteus and Citrobacter. This is supported by Olano–Martin et al. 68 who observed that pectin stimulated the growth of certain strains of Bifidobacteria and Lactobacillus in vitro. These bacteria are considered to be directly related to the health of the large intestine and their concentrations depict a healthy microflora population.

The quality of fibrin is thought to be an important risk factor for atherosclerosis, stroke and coronary heart disease. Pectin has been shown to increase fibrin permeability and decrease fibrin tensile strength in hyperlipidaemic men. Although the mechanism behind this is unknown, it is thought to be due in part to acetate production. Pectin yields predominantly acetate in the colon which is thought to enter peripheral circulation and alter fibrin architecture.

Pectin may also have a potential role in the complicated area of cancer prevention. Nangia–Makker et al. 69 found that pectin was able to bind to and decrease tumor growth and cancerous cell migration in rats fed modified citrus pectin. This is thought to be a result of pectin binding to galectin-3 and inhibiting some of its functions.

Bran

Bran is the outer most layer of a cereal grain and consists of the nucellar epidermis, seed coat, pericarp and aleurone. The aleurone consists of heavy walled, cube shaped cells which are composed primarily of cellulose. It is low in starch and high in minerals, protein, and fat. However, due to its thick cellulosic walls, these nutrients are virtually unavailable for digestion in monogastric species. The AACC defines oat bran as “the food which is produced by grinding clean oat groats or rolled oats and separating the resulting oat flour by sieving bolting, and/or other suitable means into fractions such that the oat bran fraction is not more than 50% of the original starting material and has a total betaglucan content of at least 5.5% (dry-weight basis) and a total dietary fiber content of at least 16.0% (dry-weight basis), and such that at least one-third of the total dietary fiber is soluble fiber.”

Bran from a wide array of cereal grains have been shown to have an effect on postprandial glucose levels, serum cholesterol, colon cancer, and body mass. Although the efficacy of bran may change due to its source, the purpose of this section will just evaluate bran’s general effect on the parameters listed above.

In a recent study of healthy adults, 31 g of rye bran decreased peak postprandial glucose levels by 35% when compared to the control 70. This effect may be due to the high arabinoxylan content in rye bran. Arabinoxylan, as discussed previously, may increase intestinal viscosity and slow nutrient absorption. In a more lengthy study, Qureshi et al. 71 found that subjects suffering type one and two diabetes decreased their fasting glucose levels due to the daily consumption of 10 g of stabilized rice bran over two months. The results may arise due to an increased intestinal viscosity, but is more likely a result of a decreased carbohydrate/caloric intake. Koh-Banerjee et al. 72, in a larger clinical study, supports this theory in their finding that for every 20 g/d increase in consumption of bran, body weight decreased by 0.80 lbs. It should be noted that this data remained significant even after adjustment for fat and protein intake, daily activity, caloric intake and baseline weight. In an earlier study, Zhang et al. 73 observed that adults with ileostomies, consuming bread rich in rye bran, significantly increased the ileal excretion of fat, nitrogen and energy. This study suggests bran did not delay nutrient absorption in the small intestine but hindered it.

In addition to a possible effect on carbohydrate absorption and metabolism, bran also seems to have the same effect on lipids. In a long term clinical study, Jensen et al. 74 reported that an increased daily consumption of bran significantly decreased the risk of coronary heart disease in healthy adult men. This is most likely due to the data reported by Qureshi et al. 71 who found that 10 g of rice bran consumed for eight weeks was able to decrease serum total cholesterol, LDL cholesterol and triglycerides. The mechanisms behind these effects may be two fold. The reduction in cholesterol levels is likely due to an increase in bile acid synthesis. Andersson et al. 75 found that oat bran doubled the serum concentration of 7α-hydroxy-4-cholesten-3-one (α-HC), which is a metabolite in the synthesis of bile acids that is oxidized from 7α-hydroxycholesterol. The reduction in serum triglyceride levels may be a result of a decreased absorption of fat from the small intestine.

Cellulose

Cellulose is a linear chain of β(1→4) linked glucose monomers and is the structural component of cell walls in green plants and vegetables. It is water insoluble and inert to digestive enzymes in the small intestine. However, it can go through microbial fermentation to a certain degree in the large intestine in turn producing short chain fatty acid.

Natural cellulose can be divided into two groups: Crystalline and amorphous. The crystalline component, which is made up of intra and intermolecular non covalent hydrogen bonds, make cellulose insoluble in water. However, many modified celluloses such as powdered cellulose, microcrystalline cellulose and hydroxypropylmethyl cellulose have been developed and are used as food ingredients. The difference between natural and modified celluloses is the extent of crystallization and hydrogen bonding. When these hydrogen bonds are disrupted and the crystallinity is lost, the cellulose derivative becomes water soluble 75.

Little research has been conducted evaluating the effects of cellulose in humans. Therefore, studies in other models such as the rat will be discussed. The translation to human relevance is poorly understood and debatable. Cellulose pills have been made available for human consumption with the theory that cellulose may decrease a person’s caloric intake. Although no human studies could be found to support this, several animal studies using cats, dogs and rats have shown that increasing dietary cellulose can reduce daily energy intake. This is most likely a dilution factor since cellulose is virtually undigested in the small intestine and only 51% metabolized by the microflora of the colon.

Many studies have evaluated the effect of cellulose on blood glucose and insulin levels in many different models. However, the data is extremely contradictory and may depend on the subject, type of cellulose and other unknown factors. Using the rat, dog and cat, natural cellulose was shown to decrease postprandial glucose and insulin levels. However, similar studies in pigs and humans 76 demonstrated that natural cellulose had no effect on these parameters. Studies using modified celluloses showed more consistent data. Microcrystalline cellulose has shown the ability to decrease blood glucose levels in the pig and rat. Complimenting this, methylcellulose had demonstrated the same effects in humans. Lightowler and Henry 77 found that adding only 1% high viscosity hydroxypropylmethylcellulose (HV-HPMC) to mashed potatoes decreased postprandial glucose levels by 37% in healthy adults. Also, Maki et al. 78 reported an acute 35% reduction in postprandial blood glucose due to 4 g of HV-HPMC in overweight subjects.

Modified cellulose has also been reported to effect lipid metabolism. Maki et al. 79, 80 both observed a significant reduction in total and LDL cholesterol in hypercholesterolemic adults consuming 5 g/d of HV-HPMC for four weeks. Interestingly, in subjects already receiving statin drugs, HV-HPMC was able to further reduce total and LDL cholesterol.

According to this, modified celluloses may be more beneficial than natural cellulose. These modified celluloses, as described above, act like soluble fiber thus adding to the viscosity of the GI tract. Therefore, it is assumed that increased intestinal viscosity delays nutrient absorption and increases bile acid excretion.

How dietary fiber is digested

It is now well-established that dietary fibre reaches the large intestine and is fermented by the colonic microflora with the production of short chain fatty acids, hydrogen, carbon dioxide and biomass. This fermentative process dominates human large bowel function and provides a means whereby energy is obtained from carbohydrates not digested in the small bowel, through absorption of short chain fatty acids 81.

Fermentation of fiber in the colon (large intestine)

Polysaccharides (a carbohydrate (e.g. starch, cellulose) whose molecules consist of a number of sugar molecules bonded together) cannot penetrate in the bacterial cells. They are first hydrolysed (broken down by chemical reaction with water) in monosaccharides (simple sugar molecule e.g. glucose), by membranous or extra-cellular enzymes secreted by bacteria. Metabolism of these monomeric sugars continue in the bacterial cells using the Embden-Meyerhoff pathway which leads to pyruvate. Pyruvate does not appear in the large bowel because it is immediately converted in end-products. These are short chain fatty acids, mainly acetate, propionate and butyrate, and gases: carbon dioxide (CO2), hydrogen (H2), and methane (CH4) 81.

Colonic fermentation is an efficient digestive process since starch is almost totally degraded, as well as lactose, alcohol-sugars and fructans if the intake of these sugars is not too high. More than half of the usually consumed fibres are degraded in the large intestine, the rest being excreted in the stool (see Table 2). A number of factors are likely to affect the utilization of fermentable carbohydrates in the colon. Among these is solubility. The more soluble substrates, being more accessible to hydrolytic enzymes, are likely to be degraded more rapidly. Nevertheless, some soluble fibres such as alginates or carragheenans are poorly fermented. Other factors involving digestive motility and individual differences in microflora could also modulate fermentation. Furthermore, certain metabolic pathways can be modified by the repeated occurrence of some sugars (lactose, lactulose, fructans) in the colon. The mechanisms and the physiological consequences of this adaptation are not completely identified.

Table 5. Colonic fermentability of dietary fibres in humans

Dietary fibre

Fermentability (%)

Cellulose

20-80

Hemicelluloses

60-90

Pectins

100

Guar gum

100

Ispaghula

55

Wheat bran

50

Resistant starch

100

Inulin, oligosaccharides

100 (if they are not in excess)

(Source 81).

Absorption and metabolism of dietary fiber end-products

Reducing the rate of digestion of carbohydrate spreads the absorption of carbohydrate along a longer portion of the small intestine and tends to increase the amount of carbohydrate which escapes digestion in the small intestine). For example, the amount of carbohydrate from lentils entering the colon is 2.5 times as great as carbohydrate from bread. Increasing the delivery of starch to the colon has many implications which include those on the health of the colon itself and on systemic metabolism. It is believed that starch entering the colon is completely and rapidly fermented, mostly in the cecum. The fermentation of starch produces relatively more butyrate than the fermentation of dietary fibre and resistant starch produces somewhat different fermentation products than readily digested starch.

A part of the products of fermentation are utilized by bacteria yielding energy and carbon necessary for synthesis and growth of the flora. Another part is eliminated in the stool or rectal gases, but the major part is absorbed by the colonic mucosa. Absorption of short chain fatty acids is rapid and leads to accumulation of bicarbonates and increase of pH in the lumen. Butyrate is considered to be the primary nutrient for the epithelial cells lining the colon and short chain fatty acids stimulate proliferation of colonic epithelial cells and growth of the colon in general. Butyrate is the preferred substrate of colonocytes. Short chain fatty acids which are not metabolized in the mucosa are oxidized in the liver, a part of acetate being also metabolised in the peripheric tissues.

Only a fraction of gases produced during fermentation is available for absorption. Hydrogen and methane are excreted in the breath gases. A large part of gases are consumed in the colonic lumen by ‘bacteria. Acetogenic bacteria produce acetate from CO2 and H2. Methanogenic bacteria produce CH4 by reduction of CO2 with H2. Finally, sulfate reducing bacteria utilise H2 to reduce sulfates and produce sulfites or hydrogen sulfide. Unused gases are excreted through the anus.

Effects of dietary fibre on gut microflora

The composition of microflora appears to be influenced to some degree by diet, age and geographic considerations, but these factors are not thought to be particularly significant, at least as far as the commonly studied bacterial groups are concerned. Recent studies have shown, however, that the ingestion of certain oligosaccharides, such as fructo-oligosaccharides, could modify bacterial composition of the dominant flora by increasing bifidobacteria. Some studies suggest that these bifidobacteria, which are saccharolytic bacteria naturally occurring in the normal colonic flora, might be beneficial to host health. At the present time, however, this has not been conclusively established.

Ingestion of fructo-oligosaccharides have increased faecal counts of endogenous bifidobacteria by a factor of 10, without changing the total anaerobes concentration. The similarity of effects of chemically different substrates is likely due to the capacity of bifidobacteria to hydrolyze all these substrates and to metabolize the produced monomeric sugars (glucose, galactose, fructose). The exact mechanisms whereby only some substrates could stimulate preferentially the growth of bifidobactria are not known. A recent in vitro study suggested that the polymerization degree could be more determinant than the chemical nature of oligosaccharides. The metabolic consequences of the changes in faecal flora composition are unknown. Ingestion of oligosaccharides had no effect on stool weight and pH.

Effects of dietary fibre on gut function

In the gastrointestinal tract, some fibres form a matrix with fibrous characteristics. That is, some fibres, because of their ability to swell within the aqueous medium, can trap water and nutrients, especially water-soluble ones such as sugars. The physical characteristics of the gastric and small intestinal contents are altered by fibre sources. The bulk or amount of material in the gastrointestinal tract is greater because fibre is not digestible and hence remains during the transit of digesta through the small intestine. The volume increase is due to the water-holding capacity of certain fibres. The viscosity of the intestinal contents increases due to the presence of fibre sources containing viscous polysaccharides.

The changes in the physical characteristics of the intestinal contents may influence gastric emptying, dilute enzymes and absorbable compounds in the gut, prevent starch from hydrolyzing, and slow the diffusion or mobility of enzymes, substrates and nutrients to the absorptive surface. These effects result in the slower appearance of nutrients such as glucose and some lipid molecules in the plasma following a meal.

The effects of purified dietary fibres on bowel function may or may not be similar to those of intact fibres in whole foods. This is presumably due, at least in part, to interactions between fibre and starch, and the presence of fibre associated substances such as phytate and lectins which are present in the whole food. This makes it very difficult to make valid generalizations about the physiologic effects of fibre based simply on fibre analysis. For example, when considering the effect of fibre on postprandial blood glucose responses, purified viscous fibres have been found to produce a significant reduction in glycemic response in 33 of 50 studies (66%) reviewed in 1992, compared to only 3 of 14 (21%) studies with insoluble fibre (166). The effects of purified fibres appear to be directly related to their viscosity. This would suggest that the blood glucose responses of foods should be more closely related to their soluble than insoluble fibre content, however the opposite is the case. For 52 foods, the food glycemic index (as the indicator of rise in blood glucose) was weakly related to the amount of total fibre per 50g carbohydrate, and insoluble fibre explained a larger proportion of the variance in glycemic index, 17%, than soluble fibre, 9%.

Effects on carbohydrate digestion and absorption

  • Gastric emptying

Dietary fibres may affect gastric emptying in several ways. First, they may slow gastric filling, due to their bulking and energetic dilution capacity, which might in turn slow gastric emptying. Secondly, when certain soluble fibres are mixed in liquid meals or in liquid/solid meals, they delay emptying of gastric liquids by increasing viscosity of gastric contents. Such an increase in the viscosity of chyma could also slow the gastric emptying of solid components of the meal. On this issue, results are very controversial. Moreover, by acting as an emulsifier, viscous fibre can stabilize the gastric chyma and prevent separation of the solid from the liquid phase, impairing selective retention of the largest particles, and thereby increasing their rate of passage into the small intestine. Besides the effects of soluble fibres, insoluble fractions may also alter gastric emptying by mechanisms depending on their water retention capacity or size of particles.

  • Enzyme-substrate interaction

Available evidence suggests that fibre has little, if any, direct acute effect on the secretory function of the exocrine pancreas suggesting that the primary effect of fibre on carbohydrate digestion is exerted in the intestinal lumen. In the lumen, enzymes and substrates may be diluted with the addition of non-digestible material. Evidence from in vitro studies and from duodenal aspirates suggest that most of the tested fibres can alter the activity of pancreatic amylase (88). The inhibitory effects of fibre on pancreatic enzyme activities have been attributed to various factors including pH changes, ion-exchange properties, enzyme inhibitors and adsorption. Rather than a chemical enzyme-fibre interaction, the presence of fibre, through its particulate or viscous nature, probably impedes enzyme-substrate interaction.

The presence of fibre in a form that restricts starch gelatinization or access of the hydrolytic enzymes to starch can slow the rate of digestion of the starch. For instance, the slow rate of digestion of legumes may be related to the entrapment of starch in fibrous thick-walled cells, which prevents its complete swelling during cooking. In addition, resistance of starch to pancreatic hydrolysis may result from the presence of intact cell walls, which survive processing and cooking and insulate starch in such a manner that portions of it cannot be digested or absorbed.

  • Small intestinal motility

There is evidence that viscous fibres can influence accessibility of available carbohydrates to the mucosal surface and slow their absorption. One of the major mechanisms of this action is related to the effects of dietary fibre on small intestinal motility. Small intestinal contractions create turbulences and convective currents which cause fluid circulation and mixing of luminal contents. These movements allow glucose to be brought from the centre of the lumen close to the epithelium. When it reaches proximity to the epithelium, glucose must then diffuse across the unstirred water layer. This layer is created by a gradient of progressively poorer stirring as the mucosa is approached and forms an aqueous diffusion barrier separating mixed bulk luminal contents from the brush border. Thickness of the unstirred water layer depends on small intestinal contractions and is inversely related to the magnitude of the stir rate. When there is no contraction, fluid moves through the small intestine with laminar flow comparable to that occurring in a pipe. In this flow, there is no movement in the radial direction (from the centre of the lumen toward the epithelium), and consequently the stirring is very poor and the unstirred water layer very thick. On the contrary, normal motility generates both longitudinal and radial convection currents, hence creating turbulences and stirring of luminal fluid. Beside the effects of mixing contractions on glucose movement, small intestinal motility may alter absorption by influencing transit rate which determines area and time of contact between glucose and the epithelium.

Dietary fibres which alter small intestinal motility could thus influence glucose absorption by this mechanism. Viscous fibres, such as guar gum, stimulate motility but decrease transit rate, because they resist propulsive contractions. However, though guar gum slows transit it does not affect the distribution of glucose in the human upper small intestine. It is thus unlikely that guar gum delays glucose absorption by reducing contact area. As they resist propulsion, viscous fibres should similarly resist mixing contractions, hence inhibiting the effects of motility on fluid stirring. This is probably the mechanism by which they increase thickness of the unstirred water layer, and diminish passage of glucose across the epithelium.

  • Effects of dietary fibre on large bowel function

The major effects of dietary fibre occur in the colon. Here each type of dietary fibre interacts with the microflora, and the colonic mucosa and muscle to produce several possible effects. The actions of an individual fibre source depends to a large extent on its fermentability. The range of fermentability of different fibre is great and difficult to predict. Dietary fibre, however, can be roughly divided into those which are rapidly fermented, such as oligosaccharides, those which are more slowly fermented, such as gums, and those which are hardly fermented at all, such as wheat bran. The least fermentable fibres are the most likely to increase stool output. Dietary fibre which is highly fermentable is unlikely to have much effect on stool output but will affect bacterial fermentation products in the proximal colon and hence colonic and systemic physiology. Fibres which are slowly fermented may have a major influence in the distal colon even if they do not increase stool output significantly. Furthermore, the effect of each type of fibre is determined by dose.

  • Stool output

The dietary fibres which have the greatest effects on stool output are in general the least fermentable. These fibres probably act by virtue of their water holding capacity. The relationship between water holding capacity and stool output is not simple. Dietary fibres with high water holding capacity are those which are the most fermentable and are lost before they reach the rectum. There are exceptions such as ispaghula which has high water holding capacity but resists fermentation. Moreover, one of the most reliable stool bulkers is wheat bran which has a water holding capacity that is as low as the rest of faecal contents on a normal low fibre diet. It appears that the most important factor for a large effect on stool output is simply for the fibre to appear in stool. The effect is then dependent on the amount of fibre present as well as its residual water holding capacity. The contribution of bacterial cells to faecal mass should not be forgotten, as the water content of bacteria is high. The effects of fibre are not restricted to increasing output. Dietary fibre has also a role in changing the consistency of the stool by increasing the water content and the plasticity, and increasing stool frequency.

  • Colonic motility and transit time

Certain fibres are known to have a laxative effect, in that their presence in the colon affects its motility and modifies colonic transit time. Two major mechanisms to explain this effect depend on the physicochemical properties and fermentative fate of fibre. These mechanisms refer to stimulation by the bulking effect of fibre as well as changes in the contractile activity and secretion of the colon.

Increasing the volume of colonic contents distends the colon wall and stimulates propulsion of digesta through the activation of intramuscular mechanoreceptors. Dietary fibre can increase the faecal bulk by several mechanisms. First, the volume occupied by undegraded fibres adds to the volume of the rest of contents. This explains why the least fermentable fibres, such as wheat and corn bran, ispaghula or some algal polysaccharides, are particularly efficient laxatives. Also, these residues can trap water within their matrix, thus leading to a greater bulk. A third possible mechanism to increase intraluminal volume and stretch colonic muscle is the production of gases occurring during the fermentation of fibre.

In addition to their bulking effects, dietary fibre can reduce transit time by modulating contractile activity and water movements in the colon. Here again, they can act in several ways. First, the edges of solid particles can stimulate mechanoreceptors located in the submucosa and by that, modify the contractile pattern of the colon in favour of a greater propulsion of digesta, as has been shown with plastic particles. Fibre could also release compounds trapped in the small intestine (such as biliary salts or fatty acids) into the colon during fermentation. Such compounds have been shown to stimulate secretion and rectosigmoid motility.

Finally, a large part of fibre is fermented by microflora yielding several metabolites which can themselves influence colonic motility. For instance, short chain fatty acids stimulate contractions in the terminal ileum of humans and may also affect colonic motility as has been demonstrated with rats.

It has recently been appreciated that dietary starch bulks the stool, presumably because undigested starch provides energy for colonic bacterial growth. Thus, some of the faecal bulking effect of dietary fibre, at least in intact foods, could be due to the associated increase in starch delivery to the colon.

Types of Dietary Fiber

Recent research suggests that fiber should be categorized by its physical characteristics; how well it dissolves (solubility), how thick it is (viscosity) and how well it breaks down (fermentability). Some commonly known terms are described below:

  1. Soluble fiber including pectins and beta glucans is found in foods like oats, peas, beans, apples, citrus fruits, carrots, barley and psyllium. Soluble fiber dissolves in water to form a gel-like material. It can help lower blood cholesterol and glucose levels. Foods high in soluble fiber can help you feel full. They also help reduce constipation by speeding up the time it takes for feces (poop) to pass through your body. Soluble dietary fiber has been associated with lower postprandial glucose levels and increased insulin sensitivity in diabetic and healthy subjects; these effects were generally attributed to the viscous and/or gelling properties of soluble fiber 82. Soluble dietary fiber exerts physiological effects on the stomach and small intestine that modulate postprandial glycemic responses, including delaying gastric emptying 10, which accounts for ~35% of the variance in peak glucose concentrations following the ingestion of oral glucose 83, modulating gastrointestinal myoelectrical activity and delaying small bowel transit 84, 85, reducing glucose diffusion through the unstirred water layer 86, and reducing the accessibility of α-amylase to its substrates due to the increased viscosity of gut contents 87. Notably, the increased viscosity and gel-forming properties of soluble fiber are predominantly responsible for its glycemic effect, since the hypoglycemic effect can be reversed by the hydrolysis of guar gum or following ultra-high heating and homogenization 10. In addition, the intestinal absorption of carbohydrates was prolonged by soluble dietary fiber, which was partially due to altered incretin levels, including increased glucagon-like peptide 1 levels 87. In experimental clamp studies, soluble dietary fiber also influenced peripheral glucose uptake mechanisms 88, 89, including increasing skeletal muscle expression of the insulin-responsive glucose transporter type 4 (GLUT-4), which enhances skeletal muscle uptake, augments insulin sensitivity and normalizes blood glucose 89. In humans, various fatty acids stimulate the expression of peroxisome proliferator-activated receptor-γ, which increases adipocyte GLUT-4 levels 90. A more recent study to find out the health benefits of soluble fiber on type 2 diabetes 91. A total of 117 patients with type 2 diabetes between the ages of 40 and 70 were assessed. Patients were randomly assigned to one of two groups, and administered extra soluble dietary fiber (10 or 20 g/day), or to a control group (0 g/day) for one month. The 20 g/day soluble dietary fiber group exhibited significantly improved fasting blood glucose and low-density (LDL) lipoprotein “bad cholesterol” levels, as well as a significantly improved insulin resistance index. In addition, 10 and 20 g/day soluble dietary fiber significantly improved the waist and hip circumferences and levels of triglycerides and apolipoprotein A. The results of the present study suggested that increased and regular consumption of soluble dietary fiber led to significant improvements in blood glucose levels, insulin resistance and metabolic profiles 91.
  2. Insoluble fiber including cellulose is found in wheat bran and nuts. Insoluble fiber is a type of fibre that doesn’t dissolve in water. Because insoluble fiber absorbs water, it helps to soften the contents of your bowel, contributing to keep the bowels regular. Insoluble fiber promotes the movement of material through your digestive system and increases stool bulk, so it can be of benefit to those who struggle with constipation or irregular stools. Whole-wheat flour, wheat bran, nuts, beans and vegetables, such as cauliflower, green beans and potatoes, are good sources of insoluble fiber. Diverticulitis, an inflammation of the intestine, is one of the most common age-related disorders of the colon in Western society. Among male health professionals in a long-term follow-up study, eating dietary fiber, particularly insoluble fiber, was associated with about a 40 percent lower risk of diverticular disease 92.
  3. Resistant starch is a soluble fiber that is highly fermentable in the gut. While most starch is digested in the upper part of the gut, resistant starch resists digestion in the small intestine and so goes all the way to the large intestine 93. Once in the large intestine, good bacteria ferment resistant starch. This process produces short chain fatty acids (SCFAs) and gasses that help to keep the lining of the bowel healthy. Resistant starch is starch that is not easily absorbed. Different ways of cooking can create different amounts of resistant starch. For example, resistant starch is found in slightly undercooked (‘al dente’) pasta, cooked but cooled potatoes (including potato salad), cooked and cooled grains like rice, quinoa, barley and buckwheat, under-ripe bananas, beans, lentils and a product called Hi-maize used in some breads and breakfast cereals. Freekeh, a Middle Eastern grain available in some supermarkets, is another good source. In general, foods that are less highly processed contain more resistant starch. An important benefit of resistant starch is that it ferments, which produces substances that help to keep the lining of the bowel healthy. Resistant starch has been classified into five basic “types” 94.
    • Type 1 (resistant starch 1) is made up of starch granules surrounded by an indigestible plant matrix.
    • Type 2 (resistant starch 2) occurs in its natural form such as in an uncooked potato and high amylose maize.
    • Type 3 (resistant starch 3) are crystallized starches made by unique cooking and cooling processes.
    • Type 4 (resistant starch 4) is a starch chemically modified by esterification, crosslinking, or transglycosylation and is not found in nature.
    • Type 5 (resistant starch 5) is a starch consisting of amylose-lipid complex.
  4. Prebiotics are types of carbohydrate that only our gut bacteria can feed upon. Some examples are onions, garlic, asparagus and banana.

Table 6. Types of resistant starches

DesignationDescriptionExampleReference
Type 1 (resistant starch 1)Physically inaccessible starchCoarsely ground or whole-kernel grains95
Type 2 (resistant starch 2)Granular starch with the B- or C-polymorphHigh-amylose maize starch, raw potato, raw banana starch95
Type 3 (resistant starch 3)Retrograded starchCooked and cooled starchy foods96
Type 4 (resistant starch 4)Chemically modified starchesCross-linked starch and octenyl succinate starch97
Type 5 (resistant starch 5)Amylose-lipid complexStearic acid-complexed high-amylose starch98

Footnote: 1RSI, type I resistant starch; (RS); RSII, type II resistant starch; RSIII, type III resistant starch; RSIV, type IV resistant starch; RSV; type V resistant starch.

[Source 94 ]

Few studies have compared types, but one recent study by Haub et al. 99 reported that cross-linked resistant starch 4 elicited a greater glucose lowering effect than the more commonly tested resistant starch 2.

A majority of human studies involving resistant starch have shown a decrease in postprandial blood glucose and insulin levels. However, it is difficult to completely understand these effects due to differences in study design and the type of resistant starch used. Behall et al. 100 found that women consuming 0.71 g, 2.57 g or 5.06 g of resistant starch had significantly lower postprandial glucose and insulin levels when compared to the control. However, this study failed to maintain an equal amount of available carbohydrate between the treatments and control. Therefore, it is difficult to determine whether the attenuation of glucose and insulin was due to the resistant starch or the fact that there was less available carbohydrate in the meal. Similarly, Reader et al. 101 reported that 7.25 g of resistant starch added to an energy bar decreased blood glucose and insulin levels in healthy adults. But, ingredients, amount of ingredients and nutrient levels were different for each treatment. A recent study by Al-Tamimi et al. 102 on Glucose and Insulin Responses in Humans. Al-Tamimi EK, Seib PA, Snyder BS, Haub MD. J Nutr Metab. 2010; 2010. https://www.ncbi.nlm.nih.gov/pubmed/20798767/)), however removed these variables by controlling for non starch ingredients and available carbohydrates. It was reported that postprandial blood glucose and insulin levels were significantly reduced with the supplementation of 30 g of resistant starch 4.

Several studies report that longer term consumption of a resistant starch may decrease fasting cholesterol and triglyceride levels. In a five week study, Behall et al. 103 found that men consuming 34% of their energy from high amylose maize, when compared to a high amylopectin carbohydrate, had significantly reduced fasting cholesterol and triglyceride levels. Resier et al. 104 reported similar results in an isocaloric and isonutrient diet with either high amylose maize or fructose. Porikos and Van Itallie 105 suggest that an interaction exists between sucrose, and therefore most likely fructose, and saturated fatty acids in turn promoting serum triglyceride levels. Interestingly, the relationship does not seem to exist for polyunsaturated fatty acids. The likely mechanism behind the ability of resistant starch to decrease cholesterol levels is an increased intestinal viscosity. However, some studies, such as Jenkins et al. 106, report conflicting data as  resistant starch 2 and resistant starch 3 had no effect on serum lipid profiles. While using the same type of resistant starch, subjects were only tested for two weeks. It may be that the resistant starch requires a longer period of time to promote an effect.

Research has also been conducted which evaluates the effect of resistant starch on fat oxidation and storage. However, data between studies are contradictory with no clear conclusions. Tagliabue et al. 107 reported that resistant starch 2, obtained from raw potatoes, was able to increase fat oxidation 5 h postprandial. However, the test diet, consisting of the resistant starch 2, had significantly less gross and metabolizable energy. Therefore, it is difficult to determine if the increased fat oxidation was due to the resistant starch 2 or a decreased caloric intake. A 10 week study by Howe et al. 108 may suggest the latter. High amylose starch, compared to a high amylopectin, produced no change on fat oxidation when an isocaloric diet was consumed. Conversely, Robertson et al. 109 reported that 30 g of resistant starch 2 added to healthy subjects habitual diet resulted in a significant decrease in subcutaneous abdominal adipose tissue non-esterfied fatty acid and glycerol release. This may be a result of increased peripheral short chain fatty acid metabolism or ghrelin secretions.

How much fiber do you need?

Depending on your age and sex, adults should get 25 to 31 grams of fiber a day 2. Older adults sometimes don’t get enough fiber because they may lose interest in food.

  • Men over the age of 50 should get at least 38 grams of fiber per day.
  • Women over the age of 50 should get 25 grams per day.
  • Children ages 1 to 3 should get 19 grams of fiber per day.
  • Children between 4 and 8 years old should get 25 grams per day.
  • Girls between 9 and 18 should get 26 grams of fiber each day. Boys of the same age range should get between 31 and 38 grams of fiber per day.

The recommendations for fibre intake for adults for most European countries and for countries like Australia, New Zealand and the USA are in the order of 30–35 g/day for men and 25–32 g/day for women. Overall average intakes do not reach this level of intake for any country.

For children, recommendations vary quite markedly from country to country; for example, for those aged 10–12 years, France recommends 5+age, equivalent to 15–17 g/d, for Poland, 19 g/d, for Australia and New Zealand, 20 g/d for girls and 24 g/d for boys (for 9–13 years) and for the USA, 26 g/d for girls and 31 g/d for boys (for 9–13 years). Other countries have no official recommendation for children. Hence it is difficult to say if recommendations are being met overall, although for most countries, intakes are lower than the recommendation, with few reaching an average intake of 20 g/d for boys or 18 g/d for girls. For teenagers, recommendations are similar or slightly higher than for younger children.

Most Americans eat less than this. Getting sufficient fibre isn’t just about adding unprocessed wheat bran to breakfast cereal – it’s important to include different types of fibre from a variety of plant foods.

Sources of Dietary Fiber

The amount of soluble and insoluble fiber varies in different plant foods. To receive the greatest health benefit, eat a wide variety of high-fiber foods.

Good sources of dietary fiber include:

  • Pulses (like lentils and peas) and beans and legumes (think navy beans, small white beans, split peas, chickpeas, lentils, pinto beans)
  • Fruits and vegetables, vegetables such as carrots, broccoli, green peas, and collard greens; fruits especially those with edible skin (like pears and apples with the skin on) and those with edible seeds (like berries)
  • Nuts—try different kinds (pumpkin seeds, almonds, sunflower seeds, pistachios and peanuts are a good source of fiber and healthy fats, but be mindful of portion sizes, because they also contain a lot of calories in a small amount!)
  • Whole grains such as:
    • Quinoa, barley, bulgur, oats, brown rice and farro
    • Whole wheat pasta
    • Whole grain cereals, including those made from whole wheat, wheat bran and oats

Choose fiber rich foods from a variety of sources including wholegrains, fruit and vegetable, nuts and seeds, beans and pulses. When you read food labels check for the grams of fiber per serving or per 100g. Foods that are naturally high in fiber and contain at least 3 grams per 100 gram are often labeled as a “good source,” and foods labeled as “excellent source” contain more than 5 grams of fiber per serving.

There are relatively few publications which provide detail on the types of dietary fibre consumed. In adults, grain products were the largest source of fibre in all countries, providing from 32–33 % of fibre intake in the USA and Spain to 48–49 % in Ireland, the Netherlands and Sweden. Some countries provided greater breakdown of grain sources, and, in these, bread was the major source, ranging from 11 to 30 % of total fibre, with much smaller contributions from breakfast cereals, from 5 to 8 %, biscuits and pastries, from 3 to 11 %, and pasta from 1 to 4 %. Vegetables, potatoes and fruit were the next highest sources, but these varied considerably, vegetables contributing from 12 to 21 % of fibre intake, potatoes from 6 to 19 % and fruit from 8 to 23 %.

In children, a report of the National Health and Nutrition Examination Survey (NHANES) for 2003–2006 indicated that grains provided 44 % of fibre intake, while another of 2009–2010 found 33 %.

To get enough fibre every day, the U.S. Department of Health and Human Services 19 recommends that an individual eats:

  • at least 4 serves of wholegrain or wholemeal foods every day (or ensure about half of your daily serves of breads and cereals are wholegrain or wholemeal varieties)
  • at least 2 serves of fruit daily
  • 5 serves of vegetables daily including legumes (also known as ‘pulses’)
  • wholefoods rather than dietary fibre supplements as the benefits of fibre from food may be from the combination of nutrients in food working together.

Table 7. Below is an example of how an adult may meet their daily dietary fibre requirements:

FoodFibre Content
3/4 cup whole grain breakfast cereal4.5g
2 slices wholemeal bread4.5g
1 apple (with skin) and 1 orange5.5g
2 cups mixed raw vegetables10g
1/4 cup legumes eg. baked beans3g
Total27.5g
[Source 110 ]

daily fiber requirement

Note: Daily recommended fiber intake are highlighted in pink. (Source: U.S. Department of Health and Human Services and U.S. Department of Agriculture: Dietary Guidelines for Americans 2015-2020 19).

Tips for including more fibre in your diet

  • Know which packaged foods are high in fibre by reading the nutrient panel on the pack. A food with at least 4g fibre per serve is a good source; food with at least 7g fibre per serve is an excellent source.
  • Enjoy wholegrain, wholemeal or mixed grain toast instead of white.
  • Use wholegrain pasta instead of white pasta.
  • Try brown rice or quinoa instead of white rice with casseroles or curries.
  • Use wholemeal flour to thicken sauces, gravies and stews.
  • Try wholegrain or wholemeal crisp breads with toppings such as creamed corn or salsa dip.
  • For breakfast choose a high-fiber breakfast cereal — 5 or more grams of fiber a serving. Opt for cereals with “whole grain,” “bran” or “fiber” in the name. Or add a few tablespoons of unprocessed wheat bran to your favorite cereal.
  • Switch to whole grains. Consume at least half of all grains as whole grains. Look for breads that list whole wheat, whole-wheat flour or another whole grain as the first ingredient on the label and have at least 2 grams of dietary fiber a serving. Experiment with brown rice, wild rice, barley, whole-wheat pasta and bulgur wheat.
  • Bulk up baked goods. Substitute whole-grain flour for half or all of the white flour when baking. Try adding crushed bran cereal, unprocessed wheat bran or uncooked oatmeal to muffins, cakes and cookies.
  • Lean on legumes. Beans, peas and lentils are excellent sources of fiber. Add kidney beans to canned soup or a green salad. Or make nachos with refried black beans, lots of fresh veggies, whole-wheat tortilla chips and salsa.
  • Eat more fruit and vegetables. Fruits and vegetables are rich in fiber, as well as vitamins and minerals. Try to eat five or more servings daily.
  • Make snacks count. Fresh fruits, raw vegetables, low-fat popcorn and whole-grain crackers are all good choices. A handful of nuts or dried fruits also is a healthy, high-fiber snack — although be aware that nuts and dried fruits are high in calories.

Keep in mind that if you haven’t been eating a lot of foods high in fiber on a daily basis, it’s important to increase your intake slowly to allow your body to adjust. A sudden increase in eating foods high in fiber (especially foods with added fiber or when using supplements) can cause gas, bloating or constipation. Be sure you are drinking enough water too, because fiber needs water to move through your body, making your stool soft and bulky.

Eat more fiber. You’ve probably heard it before. But do you know why fiber is so good for your health ?

Dietary Fiber and Health Benefits

The Food and Drug Administration (FDA) has approved two health claims for dietary fiber. The first claim states that, along with a decreased consumption of fats (<30% of calories), an increased consumption of dietary fiber from fruits, vegetables and whole grains may reduce some types of cancer 23. “Increased consumption” is defined as six or more one ounce equivalents, with three ounces (85 grams) derived from whole grains. A one ounce equivalent (~ 28.35 grams) would be consistent with one slice of bread, ½ cup oatmeal or rice, or five to seven crackers.

Recent survey data indicate that more than 50% of all adult Americans are overweight or obese. In parallel with this epidemic of weight gain in the general population, the incidence rate of type 2 diabetes mellitus is rapidly rising. Recent epidemiological data indicate that diets rich in high-fiber whole grains are associated with lower risk of coronary heart disease and type 2 diabetes. These data are consistent with results from recent metabolic experiments, suggesting favorable lipid profiles and glycemic control associated with higher intake of whole grains, but not with refined grains 111.

High intake of dietary fiber has been linked to a lower risk of heart disease in a number of large studies that followed people for many years 112. In a Harvard study of over 40,000 male health professionals, researchers found that a high total dietary fiber intake was linked to a 40 percent lower risk of coronary heart disease 113. A related Harvard study of female nurses produced quite similar findings 114.

Higher fiber intake has also been linked to a lower risk of metabolic syndrome, a combination of factors that increases the risk of developing heart disease and diabetes. These factors include high blood pressure, high insulin levels, excess weight (especially around the abdomen), high levels of triglycerides, and low levels of HDL (good) cholesterol. Several studies suggest that higher intake of fiber may offer protective benefits from this syndrome 115, 116.

Dietary fiber is widely prescribed 117, either alone or in combination with lipid-lowering therapies, to reduce cholesterol levels 118. The exact mechanism by which soluble fiber lowers serum levels of low-density lipoprotein (LDL) and cholesterol is not completely understood; however, it has been suggested that soluble fiber may interfere with lipid and/or bile acid metabolism 119. A reasonable increase in dietary fiber intake (20–35 g/day) is recommended by the American Diabetes Association based on the effects of soluble fiber on plasma levels of cholesterol 120. Recent epidemiological findings have suggested that there is an association between high dietary fiber intake and a reduced risk of developing diabetes and coronary heart disease 121, 122. In particular, soluble dietary fiber has been shown to reduce insulin resistance in female non-diabetic patients 123.

In a prospective cohort study involving 74,091 US female nurses, who were free of known cardiovascular disease, cancer, and diabetes at baseline, aged 38-63 y in 1984 and were followed from 1984 to 1996; their dietary habits were assessed in 1984, 1986, 1990, and 1994 124. Women who consumed more whole grains consistently weighed less than did women who consumed less whole grains. Over 12 yrs, those with the greatest increase in intake of dietary fiber gained an average of 1.52 kg less than did those with the smallest increase in intake of dietary fiber independent of body weight at baseline and age. Women in the highest quintile of dietary fiber intake had a 49% lower risk of major weight gain than did women in the highest quintile. The researchers concluded that weight gain was inversely associated with the intake of high-fiber, whole-grain foods but positively related to the intake of refined-grain foods, which indicated the importance of distinguishing whole-grain products from refined-grain products to aid in weight control 124. This is because refined-grain products have a higher starch content but a lower fiber content (ie, greater energy density) than do whole grains. Concentrations of vitamins, minerals, essential fatty acids, and phytochemicals that are important in carbohydrate metabolism are also lower in refined grains 111.

  • Serving Size

The following count as 1 ounce-equivalent (or 1 serving) of whole grains:

  • 1 slice whole-grain bread (such as 100% whole-wheat bread)
  • 1 cup ready-to-eat, whole-grain cereal
  • 1⁄2 cup cooked whole-grain cereal, brown rice, or whole-wheat pasta
  • 5 whole-grain crackers
  • 3 cups unsalted, air-popped popcorn
  • 1 6-inch whole-wheat tortilla

The second FDA claim supporting health benefits of dietary fiber states that diets low in saturated fat (<10% of calories) and cholesterol and high in fruits, vegetables and whole grain, have a decreased risk of leading to coronary heart disease 24. For most, an increased consumption of dietary fiber is considered to be approximately 25 to 35 g/d, of which 6 g are soluble fiber.

  • Epidemiological and clinical studies demonstrate that intake of dietary fiber and whole grain is inversely related to obesity 26, type 2 diabetes 125, cancer 126 and cardiovascular disease 127.
  • A study published in the Annals of Internal Medicine suggests that something as simple as aiming to eat 30 grams of fiber each day can help you lose weight, lower your blood pressure, and improve your body’s response to insulin just as effectively as a more complicated diet.

Dietary Fiber and Weight Loss

Although there are multiple factors that could contribute to obesity, the primary cause is due to an increase in the energy intake over energy expenditure (Calorie IN/Calorie OUT ratio). Therefore, limiting energy absorption is critical when treating obesity. Scientists have taken this a step further and studied the effect of other dietary aspects that may serve in weight regulation, including dietary fiber. Increasing dietary fiber consumption may decrease energy absorption by way of diluting a diet’s energy availability while maintaining other important nutrients 40.

Substantial research has been conducted to evaluate the effect of dietary fiber and body weight, most all of which show an inverse relationship between dietary fiber intake and change in body weight. Tucker and Thomas 128 supported this statement in a study consisting of 252 middle aged women. They observed that over a 20 month period participants lost an average of 4.4 lbs due to an 8 g increase in dietary fiber per 1000 kcal. This weight loss was primarily due to decreased body fat. It should be recognized that the correlation between dietary fiber and weight change was independent of many other potential factors including age, baseline fiber and fat intakes, activity level, and baseline energy intake 128.

Koh-Banerjee et al. concur with the above findings and also suggest a dose-response relationship. They reported that for every 40 g/d increase in whole grain intake, weight gain decreased by 1.1 lbs. Moreover, bran seemed to play an important role in the reduction of weight gain by 0.8 lbs per 20 g/d intake.

Dietary fiber’s ability to decrease body weight or attenuate weight gain could be contributed to several factors. First, soluble fiber, when fermented in the large intestine, produces glucagon-like peptide (GLP-1) and peptide YY (PYY) 128. These two gut hormones play a role inducing satiety. Second, dietary fiber may significantly decrease energy intake 128. Women who consumed increased levels of fiber tended to also have a decreased consumption of dietary fat. Third, dietary fiber may decrease a diets metabolizable energy, which is gross energy minus the energy lost in the feces, urine and combustible gases. Baer et al. 129 observed that an increased consumption of dietary fiber resulted in a decrease in the metabolizable energy of the diet. This may be attributed to the fact that fat digestibility decreased as dietary fiber increased. Also, as dietary fiber intake increases, the intake of simple carbohydrates tends to decrease. Although, dietary fiber still contributes to the total caloric content of a diet, it is much more resistant to digestion by the small intestine and even somewhat resistant in the large intestine.

It should also be noted that the inverse relationship between dietary fiber and metabolizable energy was independent of dietary fat. Therefore, metabolizable energy decreased as dietary fiber increased in both high and low fat diets. However, when dietary fiber was split into soluble and insoluble fiber, the results were much more inconclusive. Soluble fiber decreased metabolizable energy when added to a low fat diet but increased metabolizable energy when added to a high fat diet 129. It is not really known how dietary fat changes the effects of soluble fiber. Isken et al. 130 showed supportive data in mice consuming a high fat diet. Mice showed an increased weight gain when soluble fiber was added to a high fat diet. There are several mechanisms that may explain how soluble fiber could increase metabolizable energy or weight gain. First, bacterial populations in the large intestine increase due to an increase in soluble fiber consumption 58. This could result in increased fermentation and utilization of short chain fatty acids thereby increasing energy absorption. Second, soluble fiber enlarges in the gastrointestinal tract and forms a viscous material which delays intestinal transit time 131. Subsequently, this increase time in the gastrointestinal tract may allow for more complete digestion and absorption. Conversely, some believe this increase viscosity has an opposite effect and retards absorption 132. More research is needed in this area.

Insoluble fiber seems to have the opposite effect to that of soluble. When insoluble fiber intake was increased in mice consuming a high fat diet, body weight decreased 130. Research in sows demonstrated that insoluble fiber decreased energy digestibility while it increased with soluble fiber intake 133. The mode of action behind these findings may be due to the fact that insoluble fiber causes an increased rate of passage through the gastrointestinal tract 134. This would be expected to result in diminished digestion and absorption of nutrients.

According to the data presented above, both soluble and insoluble fiber may lead to weight loss. However, there seems to be a relationship between the type of diet (high or low fat) and the type of fiber consumed. Insoluble fiber may play a more important role for weight loss during consumption of a high fat diet. Since resistant starch is a constituent of dietary fiber and undergoes the same digestion as insoluble fiber, comparing resistant starch and insoluble fiber may give us a better understanding of how dietary fiber can be used to treat and prevent obesity. Adding resistant starch to a diet dilutes its metabolizable energy, but not to the degree of insoluble fiber 135.

Numerous studies 72, 136 have found the same inverse relationship between dietary fiber and weight gain. However, the data are more inconsistent when comparing soluble and insoluble. Thus, although increasing dietary fiber in general has a favorable effect on body weight, more research is warranted to determine the optimal dietary fibers for the purpose of weight management.

Dietary Fiber and Cholesterol

In 1999, Brown et al. 137 undertook a meta-analysis of sixty-seven trials that demonstrated a reduction of total cholesterol by 0·047 mmol/l, and LDL-cholesterol by 0·057 mmol/l with daily consumption of fibre isolates or fibre-enriched products containing 2–10 g of soluble fibre provided by pectin, guar gum, psyllium and oat bran. Similar findings, albeit using narrower trials inclusion criteria, were reported in the evidence reviews prepared for the Scientific Advisory Committee on Nutrition Carbohydrate Working Group 138. Total and LDL-cholesterol were lowered by supplementation with mixed, soluble types of dietary fibre, and total and LDL-cholesterol and fasting TAG levels were significantly lowered by supplementation with oats, oat bran or β-glucan-supplemented diets. Other types of dietary fibre supplementation did not consistently reduce blood lipids in these trials of normolipidaemic individuals. Some of this evidence forms the basis for the authorised health claims that certain fibre types, including β-glucans from oats and barley, pectin, guar gum and chitosan, may contribute to the maintenance of normal blood cholesterol concentrations.

Eating more Whole Grains linked with Lower Risk of Death

Eating at least three servings of whole grains every day could lower your risk of death, according to new research in the American Heart Association’s journal Circulation 139. Whole grains, such as whole wheat, oats and brown rice, contain dietary fiber, which may help improve blood cholesterol levels, and lower the risk of heart disease, stroke, obesity and type 2 diabetes. Dietary fiber can also make you feel full longer, so you may eat fewer calories.

Although dietary guidelines around the world have included whole grains as an essential component of healthy eating patterns, people aren’t eating enough, according to the analysis.

This analysis included 12 studies published through February 2016 and unpublished results from the National Health and Nutrition Examination Survey (NHANES) III, conducted from 1988 to 1994, and NHANES 1999-2004. Of the reviewed studies, 10 were conducted in U.S. populations, three in Scandinavian countries and one in the United Kingdom.

The combined studies involved 786,076 men and women with 97,867 total deaths, 23,597 deaths from cardiovascular disease, and 37,492 deaths from cancer.

In the first meta-analysis review of studies reporting associations between whole grain consumption and death, researchers noted that for about every serving (16 grams) of whole grains there was a:

  • 7 percent decreased risk in total deaths;
  • 9 percent decline in cardiovascular disease-related deaths; and
  • 5 percent decline in cancer-related deaths.

The more whole grains consumed, the lower the death rate. According to researchers, when three servings (48 grams) were consumed daily the rates declined:

  • 20 percent for total deaths;
  • 25 percent for cardiovascular deaths; and
  • 14 percent for cancer-related deaths.

Study Highlights

  • Eating at least three servings of whole grains a day was associated with lower risk of death from cardiovascular disease, cancer and all causes in an analysis of nutrition studies.
  • These findings further support the U.S. government’s current Dietary Guidelines for Americans, which recommends at least three daily servings of whole grains.

The American Heart Association recommends a heart-healthy dietary pattern emphasizing fruits, vegetables, whole grains and other nutritious foods and specifically that at least half of grain consumption should be whole grains. Whole grains provide many nutrients, such as fiber, B vitamins, and minerals, which are removed during the refining process.

In another recent meta-analysis using seven prospective cohort studies on high fiber diet and all-cause of death, observed an 11 % reduction in mortality risk for each 10 g/day increment of dietary fibre consumed 140. When comparing the highest (mean approximately 27 g/d) and lowest (mean approximately 15 g/d) fibre intake groups, the pooled estimate indicated a 23 % lower risk in the highest dietary fiber (cereal fibre, vegetable fibre and fruit fibre) consumers. Overall, the strongest inverse associations were observed with increasing cereal fibre consumption (8 % reduction in risk per 10 g/d), with weaker associations being observed for vegetable and fruit sources 140.high fiber rich foods

High Fiber Diets and Cancer Prevention

Recent studies support this inverse relationship between dietary fiber and the development of several types of cancers including colorectal, small intestine, oral, larynx and breast cancer 141, 142, 143. Although most studies agree with these findings, the mechanisms responsible are still unclear.

A large-scale 2016 study 144 led by researchers at Harvard School of Public Health showed findings that higher fiber intake reduces breast cancer risk, suggesting that fiber intake during adolescence and early adulthood may be particularly important. Women who eat more high-fiber foods during adolescence and young adulthood, including vegetables and fruit, may have significantly lower breast cancer risk than those who eat less dietary fiber when young 144.

Several modes of actions however have been proposed. First, dietary fiber resists digestion in the small intestine, thereby allowing it to enter the large intestine where it is fermented to produce short chain fatty acids, which have anti-carcinogenic properties 145. Second, since dietary fiber increases fecal bulking and viscosity, there is less contact time between potential carcinogens and mucosal cells. Third, dietary fiber increases the binding between bile acids and carcinogens. Fourth, increased intake of dietary fiber yield increased levels of antioxidants. Fifth, dietary fiber may increase the amount of estrogen excreted in the feces due to an inhibition of estrogen absorption in the intestines 34.

In contrary to the above positive results, several studies have largely failed to show a link between fiber and colon cancer. One of these—a Harvard study that followed over 80,000 female nurses for 16 years—found that dietary fiber was not strongly associated with a reduced risk for either colon cancer or polyps (a precursor to colon cancer) 146.

High Fiber Diets in the Treatment of Diabetes Mellitus

These data 147, 148 indicate that substantial changes in fiber content of the diabetic diet may lead to marked changes in diabetic control and that increasing dietary fiber may be a useful means of lowering plasma glucose in some diabetic patients. There is sufficient evidence to support a number of authorised health claims that certain types of dietary fibre, including arabinoxylan, β-glucans from oats and barley, and pectins if consumed within a meal, may contribute to the reduction of the blood glucose rise after that meal. Furthermore, two systematic reviews of prospective cohort studies, with dose–response meta-analyses, of the association between dietary fibre and risk of type 2 diabetes mellitus have been published recently that indicate a reduction in long-term risk 149, 150. Both reviews concluded that there is clear evidence of diminishing risk of type 2 diabetes mellitus with increasing consumption of dietary fiber (approximately 6 % reduction in risk with each additional 7 g daily consumption that fibre from cereals was associated with reduced diabetes risk. With each 7 g/d consumed, Threapleton et al. 149 reported that risk was reduced by 21 %. Both insoluble and soluble fibres were separately associated with lower risk but no associations were observed when studies reporting fibre from fruits or from vegetables were separately examined.

The high plant fiber content may be responsible for the reduction in serum cholesterol and triglyceride values. Fasting blood glucose, cholesterol and triglyceride values were significantly lower on high fiber diets than on control diets despite significantly lower insulin doses on the high fiber diets. High fiber diets were accompanied by increased insulin sensitivity and by binding of insulin by monocytes. These studies suggest that high fiber diets may have an important place in the management of patients with the maturity-onset type of diabetes. (Source 151, 152).

Diets low in fiber and high in foods that cause sudden increases in blood sugar may increase the risk of developing Type 2 Diabetes. Both Harvard studies—of female nurses and of male health professionals—found that this type of diet more than doubled the risk of type 2 diabetes when compared to a diet high in cereal fiber and low in high-glycemic-index foods 153, 154, 155. A diet high in cereal fiber was linked to a lower risk of type 2 diabetes. Other studies, such as the Black Women’s Health Study 156 and the European Prospective Investigation Into Cancer and Nutrition–Potsdam, have shown similar results.

These results suggest that in Insulin Dependent Diabetes Mellitus patients, high-carbohydrate (70%) with high-fiber (70 g) (HCHF) diets enhance peripheral glucose disposal, decrease basal insulin requirements, and lower total cholesterol without altering glycemic control or triglycerides. (Source 157).

A more recent study to find out the health benefits of soluble fiber on type 2 diabetes 91. A total of 117 patients with type 2 diabetes between the ages of 40 and 70 were assessed. Patients were randomly assigned to one of two groups, and administered extra soluble dietary fiber (10 or 20 g/day), or to a control group (0 g/day) for one month. The 20 g/day soluble dietary fiber group exhibited significantly improved fasting blood glucose and low-density (LDL) lipoprotein “bad cholesterol” levels, as well as a significantly improved insulin resistance index. In addition, 10 and 20 g/day soluble dietary fiber significantly improved the waist and hip circumferences and levels of triglycerides and apolipoprotein A. The results of the present study suggested that increased and regular consumption of soluble dietary fiber led to significant improvements in blood glucose levels, insulin resistance and metabolic profiles 91.

A high-fiber diet has many benefits, including normalizing bowel movements, helping maintain bowel integrity and health, lowering blood cholesterol levels, and helping control blood sugar levels. A high-fiber diet may also aid in achieving and maintaining a healthy weight.

High Fiber Diets in the Reducing Mortality from Cardiovascular Disease

Risk factors for cardiovascular disease include hypercholesterolemia (high cholesterol), hypertension (high blood pressure), obesity and type 2 diabetes. Recent studies found interesting data illustrating that for every 10 g of additional fiber added to a diet the mortality risk of cardiovascular disease (coronary heart disease, heart failure, peripheral vascular disease and stroke) is decreased by 17–35% 158, 159.

Increasing dietary fiber intake, which is one of the goals of nutritional counseling, deserves greater attention due to its ability to reduce total cholesterol levels and hyperglycemia in patients with impaired glucose tolerance and type 2 diabetes 100. In addition, increased fiber intake was shown to improve insulin sensitivity and reduce systemic inflammation 160, 161. Previous studies have demonstrated that high-fiber diets (30 g/day) altered biochemical parameters, reduced the severity of type 2 diabetes mellitus and decreased the occurrence of risk factors associated with cardiovascular disease 160, 162. According to Weickert et al 160, nutritional educational studies involving dietary restrictions are typically met with poor treatment compliance. Participants in a previous study were encouraged to progressively alter their eating behaviors, including increasing the frequency of meals and increasing the intake of complex carbohydrates, dietary fiber, fruits, and vegetables, as well as polyunsaturated and monounsaturated fatty acids, including fish and olive oils, respectively 160.

It is speculated that the control and treatment of these risk factors (hypercholesterolemia (high cholesterol), hypertension (high blood pressure), obesity and type 2 diabetes) underlie the mechanisms behind dietary fiber and cardiovascular disease prevention.

First, soluble fibers have been shown to increase the rate of bile excretion therefore reducing serum total cholesterol and LDL “bad” cholesterol 163. Second, short chain fatty acid production, specifically propionate, has been shown to inhibit cholesterol synthesis 37. Third, dietary fiber demonstrates the ability to regulate energy intake thus enhancing weight loss or maintenance of a healthier body weight. Fourth, either through glycemic control or reduced energy intake, dietary fiber has been shown to lower the risk for type two diabetes. Fifth, dietary fiber has been shown to decrease pro-inflammatory cytokines such as interleukin-18 which may have an effect on plaque stability 164. Sixth, increasing dietary fiber intake has been show to decrease circulating levels of C-Reactive protein, a marker of inflammation and a predictor for cardiovascular disease 165.

High Fiber Diets and Hypertension (high blood pressure)

Two reviews of randomised controlled trials of fibre and blood pressure were published in 2005 by Streppel et al. 166 and Whelton et al. 167. Both described a significant inverse relationship between fibre consumption and blood pressure, with reductions in blood pressure by 1–2 mmHg with fibre supplementation. Greater reductions were observed in older, more hypertensive populations. Whelton et al. 167 also described some evidence of a greater magnitude of reduction with fruit and vegetable sources of dietary fibre rather than grain sources, although this finding was based on a very limited number of studies (four and nine trials, respectively). More recently, randomised controlled trials with blood pressure outcomes that were of at least of 6 weeks’ duration were identified by Evans et al. 168, and pooled in random-effects meta-analyses. No overall reduction in blood pressure was found when the results of all eighteen trials were pooled, comparing high- and low-fibre intervention groups regardless of dietary fibre type. However, diets rich in β-glucans were found to reduce systolic blood pressure by 2·9 mmHg and diastolic blood pressure by 1·5 mmHg for a median difference in β-glucans of 4 g/d.

High Fiber Diets May Reduce Stroke Risk

New research in the American Heart Association journal Stroke March 28, 2013 169, 170 shows that eating more fiber may decrease your risk of first-time stroke.

Among the study’s key highlights:

  • Eating foods with more fiber was linked to a lower risk of first-time stroke.
  • Every seven-gram increase in total dietary fiber was associated with a 7 percent lower risk of first-time stroke.
  • The results reinforce the importance of a diet that includes at least 25 grams of fiber daily.

Previous research has shown that dietary fiber may help reduce risk factors for stroke, including high blood pressure and high blood levels of low-density lipoprotein (LDL) “bad” cholesterol.

In the new study, researchers found that each seven-gram increase in total daily fiber intake was associated with a 7 percent decrease in first-time stroke risk. One serving of whole-wheat pasta, plus two servings of fruits or vegetables, provides about 7 grams of fiber, researchers said.

Greater intake of fiber-rich foods – such as whole-grains, fruits, vegetables and nuts – are important for everyone, and especially for those with stroke risk factors like being overweight, smoking and having high blood pressure.

The results were based on total dietary fiber. Researchers did not find an association with soluble fiber and stroke risk, and lacked enough data on insoluble fiber to make any conclusions.

The average daily fiber intake among U.S. adults is lower than the American Heart Association’s recommendation of at least 25 grams per day. Six to eight servings of grains and eight to 10 servings of fruits and vegetables can provide the recommended amount.

Most people do not get the recommended level of fiber, and increasing fiber may contribute to lower risk for strokes.

Whole Grains Intake and Mortality From All Causes, Cardiovascular Disease, and Cancer

Eating at least three servings of whole grains a day was associated with lower risk of death from cardiovascular disease, cancer and all causes in an analysis of nutrition studies. A Meta-Analysis of Prospective Cohort Studies  171 demonstrated inverse associations of whole grains intake with total and cause-specific mortality, and findings were particularly strong and robust for cardiovascular disease mortality.

Whole Grains consumption was inversely associated with mortality in a dose-response manner, and the association with cardiovascular disease mortality was particularly strong and robust. Further dose-response analysis showed a strong monotonic association of whole grains with total and cause-specific mortality. These observations endorse current dietary guidelines that recommend increasing whole grains intake to replace refined grains to facilitate long-term health and to help prevent premature death.

The relationship between whole grains intake and cancer outcomes is less clear. In their meta-analysis, significantly lower cancer mortality was observed only when daily whole grains consumption exceeded 30 g/d.

Huang et al 172 found an inverse association between whole grains intake and mortality from respiratory diseases, infections, and other unknown causes. Johnsen et al 173 also reported that whole grains intake was associated with lower mortality resulting from causes other than cardiovascular, cancer, diabetes mellitus and respiratory diseases. Clearly, more data are required to further elucidate the potential benefits of whole grains on other health conditions.

These findings support current dietary guidelines for whole grains consumption that recommends ≥3 servings per day for long-term health and longevity. These findings further support current Dietary Guidelines for Americans, which recommends at least 3 servings per day of whole grains intake.

high fiber rich foods 2

Dietary fiber summary

In a simplified definition, dietary fiber is a carbohydrate that resists digestion and absorption and may or may not undergo microbial fermentation in the large intestine. This definition is essentially the basis to its correlation between consumption levels and possible health benefits. Dietary fiber consists of many different constituents, however; some are of particular interest and include arabinoxylan, inulin, β-glucan, pectin, bran and resistant starches. These individual components of dietary fiber have been shown to significantly play an important role in improving human health. Current research is paying particular attention to these elements; although further research is needed to better understand particular health claims and the mechanisms involved.

A large amount of research has reported an inverse relationship between high fiber consumption and the risk for coronary heart disease and several types of cancer. For that reason, the FDA has adopted and published the claim that increased consumption of dietary fiber can reduce the prevalence of coronary heart diseases and cancer. The mechanisms behind these findings are still unclear. However, it is thought to be attributed to several factors including increasing bile acid excretion, decreased caloric intake, increased short chain fatty acid production, carcinogen binding effects, increased antioxidants, and increased vitamins and minerals.

A heart-healthy dietary pattern emphasizing fruits, vegetables, whole grains and other nutritious foods and specifically that at least half of grain consumption should be whole grains. Whole grains provide many nutrients, such as fiber, B vitamins, and minerals, which are removed during the refining process. Based on the solid evidence from numerous previous studies that collectively document beneficial effects of whole grains, we unanimously recommend whole grain consumption to the general population as well as to people with certain diseases to help achieve better health and perhaps reduce death.

Although not as yet adopted by the FDA, dietary fiber is suggested to play a role in other conditions such as obesity and diabetes. Although some data are contradictory, a majority of studies regarding dietary fiber report a decrease of these two conditions with increased consumption of fiber.

The digestive and viscosity characteristics of dietary fiber are the likely modes of action which affect diabetes and obesity risk. These mechanisms appear to decrease nutrient absorption, therefore, decreasing metabolizable energy. Dietary fiber may also be able to decrease gross energy of a food due to its lower energy density.

Further studies are needed in certain areas of dietary fiber research. Those of particular interest are in the components of fiber such as β-glucan, arabinoxylan, resistant starches, etc. These sub fractions may give a better understanding of the health benefits of dietary fiber as well as the mechanisms behind them 174.

References
  1. European Journal of Clinical Nutrition (2007) 61 (Suppl 1), S132–S137; doi:10.1038/sj.ejcn.1602943. FAO/WHO Scientific Update on carbohydrates in human nutrition: conclusions. http://www.nature.com/ejcn/journal/v61/n1s/full/1602943a.html
  2. U.S. Department of Agriculture and U.S. Department of Health and Human Services. Dietary Guidelines for Americans, 2015-2020. https://health.gov/sites/default/files/2019-09/2015-2020_Dietary_Guidelines.pdf
  3. American Heart Association Scientific Statement October 27, 2016 – Statement provides blueprint for healthcare providers to translate nutrition recommendations into practical food choices – http://newsroom.heart.org/news/statement-provides-blueprint-for-healthcare-providers-to-translate-nutrition-recommendations-into-practical-food-choices
  4. Glycemic index, glycemic load, and dietary fiber intake and incidence of type 2 diabetes in younger and middle-aged women. Schulze MB, Liu S, Rimm EB, Manson JE, Willett WC, Hu FB. Am J Clin Nutr. 2004 Aug; 80(2):348-56. https://www.ncbi.nlm.nih.gov/pubmed/15277155/
  5. Carbohydrates, dietary fiber, and incident type 2 diabetes in older women. Meyer KA, Kushi LH, Jacobs DR Jr, Slavin J, Sellers TA, Folsom AR. Am J Clin Nutr. 2000 Apr; 71(4):921-30. https://www.ncbi.nlm.nih.gov/pubmed/10731498/
  6. Carbohydrates, dietary fiber, and incident type 2 diabetes mellitus in older women. Meyer KA, Kushi LH, Jacobs DR Jr, Slavin J, Sellers TA, Folsom AR. Am J Clin Nutr. 2000 Apr; 71(4):921-30. https://www.ncbi.nlm.nih.gov/pubmed/10731498/
  7. Diet, lifestyle, and the risk of type 2 diabetes mellitus in women. Hu FB, Manson JE, Stampfer MJ, Colditz G, Liu S, Solomon CG, Willett WC. N Engl J Med. 2001 Sep 13; 345(11):790-7. https://www.ncbi.nlm.nih.gov/pubmed/11556298/
  8. Whole-grain and fiber intake and the incidence of type 2 diabetes. Montonen J, Knekt P, Järvinen R, Aromaa A, Reunanen A. Am J Clin Nutr. 2003 Mar; 77(3):622-9. https://www.ncbi.nlm.nih.gov/pubmed/12600852/
  9. Dietary fiber, glycemic load, and risk of NIDDM in men. Salmerón J, Ascherio A, Rimm EB, Colditz GA, Spiegelman D, Jenkins DJ, Stampfer MJ, Wing AL, Willett WC. Diabetes Care. 1997 Apr; 20(4):545-50. https://www.ncbi.nlm.nih.gov/pubmed/9096978/
  10. Dietary fibres, fibre analogues, and glucose tolerance: importance of viscosity. Jenkins DJ, Wolever TM, Leeds AR, Gassull MA, Haisman P, Dilawari J, Goff DV, Metz GL, Alberti KG. Br Med J. 1978 May 27; 1(6124):1392-4. https://www.ncbi.nlm.nih.gov/pubmed/647304/
  11. Metabolic effects of dietary fiber consumption and prevention of diabetes. Weickert MO, Pfeiffer AF. J Nutr. 2008 Mar; 138(3):439-42. https://www.ncbi.nlm.nih.gov/pubmed/18287346/
  12. Impact of cereal fibre on glucose-regulating factors. Weickert MO, Mohlig M, Koebnick C, Holst JJ, Namsolleck P, Ristow M, Osterhoff M, Rochlitz H, Rudovich N, Spranger J, Pfeiffer AF. Diabetologia. 2005 Nov; 48(11):2343-53. https://www.ncbi.nlm.nih.gov/pubmed/16172868/
  13. Insoluble cereal fiber reduces appetite and short-term food intake and glycemic response to food consumed 75 min later by healthy men. Samra RA, Anderson GH. Am J Clin Nutr. 2007 Oct; 86(4):972-9. https://www.ncbi.nlm.nih.gov/pubmed/17921373/
  14. Effect of neutralized and native vinegar on blood glucose and acetate responses to a mixed meal in healthy subjects. Brighenti F, Castellani G, Benini L, Casiraghi MC, Leopardi E, Crovetti R, Testolin G. Eur J Clin Nutr. 1995 Apr; 49(4):242-7. https://www.ncbi.nlm.nih.gov/pubmed/7796781/
  15. Barley bread containing lactic acid improves glucose tolerance at a subsequent meal in healthy men and women. Ostman EM, Liljeberg Elmståhl HG, Björck IM. J Nutr. 2002 Jun; 132(6):1173-5. https://www.ncbi.nlm.nih.gov/pubmed/12042429/
  16. Effect of fatty acids on glucose production and utilization in man. Ferrannini E, Barrett EJ, Bevilacqua S, DeFronzo RA. J Clin Invest. 1983 Nov; 72(5):1737-47. https://www.ncbi.nlm.nih.gov/pubmed/6138367/
  17. Role of acetate in the reduction of plasma free fatty acids produced by ethanol in man. Crouse JR, Gerson CD, DeCarli LM, Lieber CS. J Lipid Res. 1968 Jul; 9(4):509-12. https://www.ncbi.nlm.nih.gov/pubmed/5725882/
  18. Fuel selection in human skeletal muscle in insulin resistance: a reexamination. Kelley DE, Mandarino LJ. Diabetes. 2000 May; 49(5):677-83. https://www.ncbi.nlm.nih.gov/pubmed/10905472/
  19. U.S. Department of Health and Human Services and U.S. Department of Agriculture: Dietary Guidelines for Americans 2015-2020. https://health.gov/dietaryguidelines/
  20. Increasing total fiber intake reduces risk of weight and fat gains in women. Tucker LA, Thomas KS. J Nutr. 2009 Mar; 139(3):576-81. https://www.ncbi.nlm.nih.gov/pubmed/19158230/
  21. Dietary fiber intake and risk of breast cancer in postmenopausal women: the National Institutes of Health-AARP Diet and Health Study. Park Y, Brinton LA, Subar AF, Hollenbeck A, Schatzkin A. Am J Clin Nutr. 2009 Sep; 90(3):664-71. https://www.ncbi.nlm.nih.gov/pubmed/19625685/
  22. Dietary fiber intake in relation to coronary heart disease and all-cause mortality over 40 y: the Zutphen Study. Streppel MT, Ocké MC, Boshuizen HC, Kok FJ, Kromhout D. Am J Clin Nutr. 2008 Oct; 88(4):1119-25. https://www.ncbi.nlm.nih.gov/pubmed/18842802/
  23. FDA, authors. Code of Federal Regulations. Vol. 2 Food and Drug Administration; Silver Spring, MD, USA: 2008. Health claims: Fiber-contaning grain products, fruits and vegetables and cancer.
  24. FDA, authors. Code of Federal Regulations. Vol. 2 Food and Drug Administration; Silver Spring, MD, USA: 2008. Health claims: fruits, vegetables, and grain products that contain fiber, particularly soluble fiber, and risk of coronary heart disease.
  25. Liu R.H. Health benefits of fruit and vegetables are from additive and synergistic combinations of phytochemicals. Am. J. Clin. Nutr. 2003;78:517S–520S. – https://www.ncbi.nlm.nih.gov/pubmed/12936943
  26. Tucker L.A., Thomas K.S. Increasing total fiber intake reduces risk of weight and fat gains in women. J. Nutr. 2009;139:576–581. – https://www.ncbi.nlm.nih.gov/pubmed/19158230
  27. Weickert M.O., Pfeiffer A.F. Metabolic effects of dietary fiber consumption and prevention of diabetes. J. Nutr. 2008;138:439–442. – https://www.ncbi.nlm.nih.gov/pubmed/18287346
  28. Liu S., Stampfer M.J., Hu F.B., Giovannucci E., Rimm E., Manson J.E., Hennekens C.H., Willett W.C. Whole-grain consumption and risk of coronary heart disease: Results from the Nurses’ Health Study. Am. J. Clin. Nutr. 1999;70:412–419. – https://www.ncbi.nlm.nih.gov/pubmed/10479204
  29. Ferguson L.R., Chavan R.R., Harris P.J. Changing concepts of dietary fiber: Implications for carcinogenesis. Nutr. Cancer. 2001;39:155–169. – https://www.ncbi.nlm.nih.gov/pubmed/11759275
  30. Terry P., Giovannucci E., Michels K.B., Bergkvist L., Hansen H., Holmberg L., Wolk A. Fruit, vegetables, dietary fiber, and risk of colorectal cancer. J. Natl. Cancer Inst. 2001;93:525–533. – https://www.ncbi.nlm.nih.gov/pubmed/11287446
  31. Dietary fiber and colorectal cancer risk: the multiethnic cohort study. Nomura AM, Hankin JH, Henderson BE, Wilkens LR, Murphy SP, Pike MC, Le Marchand L, Stram DO, Monroe KR, Kolonel LN. Cancer Causes Control. 2007 Sep; 18(7):753-64. https://www.ncbi.nlm.nih.gov/pubmed/17557210/
  32. Prospective study of dietary fiber, whole grain foods, and small intestinal cancer. Schatzkin A, Park Y, Leitzmann MF, Hollenbeck AR, Cross AJ. Gastroenterology. 2008 Oct; 135(4):1163-7. https://www.ncbi.nlm.nih.gov/pubmed/18727930/
  33. Dietary fibre and colorectal cancer: a model for environment–gene interactions. Young GP, Hu Y, Le Leu RK, Nyskohus L. Mol Nutr Food Res. 2005 Jun; 49(6):571-84. https://www.ncbi.nlm.nih.gov/pubmed/15864783/
  34. Adlercreutz H., Hamalainen E., Gorbach S.L., Goldin B.R., Woods M.N., Brunson L.S., Dwyer J.T. Association of Diet and Sex-Hormones in Relation to Breast-Cancer. Eur. J. Cancer Clin. Oncol. 1987;23:1725–1726.
  35. Dietary fiber and risk of coronary heart disease: a pooled analysis of cohort studies. Pereira MA, O’Reilly E, Augustsson K, Fraser GE, Goldbourt U, Heitmann BL, Hallmans G, Knekt P, Liu S, Pietinen P, Spiegelman D, Stevens J, Virtamo J, Willett WC, Ascherio A. Arch Intern Med. 2004 Feb 23; 164(4):370-6. https://www.ncbi.nlm.nih.gov/pubmed/14980987/
  36. Dietary fiber and bile acid metabolism–an update. Story JA, Furumoto EJ, Buhman KK. Adv Exp Med Biol. 1997; 427():259-66. https://www.ncbi.nlm.nih.gov/pubmed/9361851/
  37. Amaral L., Morgan D., Stephen A.M., Whiting S. Effect of Propionate on Lipid-Metabolism in Healthy-Human Subjects. FASEB J. 1992;6:A1655.
  38. Meal modulation of circulating interleukin 18 and adiponectin concentrations in healthy subjects and in patients with type 2 diabetes mellitus. Esposito K, Nappo F, Giugliano F, Di Palo C, Ciotola M, Barbieri M, Paolisso G, Giugliano D. Am J Clin Nutr. 2003 Dec; 78(6):1135-40. https://www.ncbi.nlm.nih.gov/pubmed/14668275/
  39. Association between dietary fiber and serum C-reactive protein. Ma Y, Griffith JA, Chasan-Taber L, Olendzki BC, Jackson E, Stanek EJ 3rd, Li W, Pagoto SL, Hafner AR, Ockene IS. Am J Clin Nutr. 2006 Apr; 83(4):760-6. https://www.ncbi.nlm.nih.gov/pubmed/16600925/
  40. Lattimer JM, Haub MD. Effects of Dietary Fiber and Its Components on Metabolic Health. Nutrients. 2010;2(12):1266-1289. doi:10.3390/nu2121266. https://www.ncbi.nlm.nih.gov/pmc/articles/PMC3257631/
  41. WHO/FAO (2009) Report of the 30th session of the Codex Committee on Nutrition and Foods for Special Dietary Uses, no. ALINORM 02/32/26. http://www.fao.org/fao-who-codexalimentarius/codex-home/en/
  42. NG Asp (2001) Development of dietary fibre methodology. In Advanced Dietary Fibre Technology, pp. 77–86 [B McCleary and L Prosky, editors]. London: Blackwell Science Ltd.
  43. Stephen, A., Champ, M., Cloran, S., Fleith, M., Van Lieshout, L., Mejborn, H., & Burley, V. (2017). Dietary fibre in Europe: Current state of knowledge on definitions, sources, recommendations, intakes and relationships to health. Nutrition Research Reviews, 1-42. doi:10.1017/S095442241700004X. https://www.cambridge.org/core/journals/nutrition-research-reviews/article/dietary-fibre-in-europe-current-state-of-knowledge-on-definitions-sources-recommendations-intakes-and-relationships-to-health/B263D1D7B3440DC9D6F68E23C2B4212F
  44. American Association of Cereal Chemists (AACC International). Dietary Fiber. http://www.aaccnet.org/initiatives/definitions/Pages/DietaryFiber.aspx
  45. American Association of Cereal Chemists (AACC International). Dietary Fiber. http://www.aaccnet.org/initiatives/definitions/Pages/DietaryFiber.aspx
  46. Food and Agriculture Organization and World Health Organization. CODEX ALIMENTARIUS COMMISSION. Thirty second Session, Rome, Italy, 29 June – 4 July 2009. http://www.fao.org/input/download/report/710/al32_26e.pdf
  47. Ring S.G., Selvendran R.R. Isolation and Analysis of Cell-Wall Material from Beeswing Wheat Bran (Triticum-Aestivum) Phytochemistry. 1980;19:1723–1730.
  48. Arabinoxylan fiber, a byproduct of wheat flour processing, reduces the postprandial glucose response in normoglycemic subjects. Lu ZX, Walker KZ, Muir JG, Mascara T, O’Dea K. Am J Clin Nutr. 2000 May; 71(5):1123-8. https://www.ncbi.nlm.nih.gov/pubmed/10799374/
  49. Arabinoxylan fibre improves metabolic control in people with Type II diabetes. Lu ZX, Walker KZ, Muir JG, O’Dea K. Eur J Clin Nutr. 2004 Apr; 58(4):621-8. https://www.ncbi.nlm.nih.gov/pubmed/15042130/
  50. Selective stimulation of bifidobacteria in the human colon by oligofructose and inulin. Gibson GR, Beatty ER, Wang X, Cummings JH. Gastroenterology. 1995 Apr; 108(4):975-82. https://www.ncbi.nlm.nih.gov/pubmed/7698613/
  51. Dietary synbiotics reduce cancer risk factors in polypectomized and colon cancer patients. Rafter J, Bennett M, Caderni G, Clune Y, Hughes R, Karlsson PC, Klinder A, O’Riordan M, O’Sullivan GC, Pool-Zobel B, Rechkemmer G, Roller M, Rowland I, Salvadori M, Thijs H, Van Loo J, Watzl B, Collins JK. Am J Clin Nutr. 2007 Feb; 85(2):488-96. https://www.ncbi.nlm.nih.gov/pubmed/17284748/
  52. Griffin I.J., Hicks P.M.D., Heaney R.P., Abrams S.A. Enriched chicory inulin increases calcium absorption mainly in girls with lower calcium absorption. Nutr. Res. 2003;23:901–909.
  53. A combination of prebiotic short- and long-chain inulin-type fructans enhances calcium absorption and bone mineralization in young adolescents. Abrams SA, Griffin IJ, Hawthorne KM, Liang L, Gunn SK, Darlington G, Ellis KJ. Am J Clin Nutr. 2005 Aug; 82(2):471-6. https://www.ncbi.nlm.nih.gov/pubmed/16087995/
  54. Oligofructose promotes satiety in healthy human: a pilot study. Cani PD, Joly E, Horsmans Y, Delzenne NM. Eur J Clin Nutr. 2006 May; 60(5):567-72. https://www.ncbi.nlm.nih.gov/pubmed/16340949/
  55. Wood P.J., Weisz J., Fedec P. Potential for Beta-Glucan Enrichment in Brans Derived from Oat (Avena sativa L.) Cultivars of Different (1→3),(1→4)-Beta-D-Glucan Concentrations. Cereal Chem. 1991;68:48–51.
  56. Simultaneous intake of beta-glucan and plant stanol esters affects lipid metabolism in slightly hypercholesterolemic subjects. Theuwissen E, Mensink RP. J Nutr. 2007 Mar; 137(3):583-8. https://www.ncbi.nlm.nih.gov/pubmed/17311944/
  57. Beta-glucan incorporated into a fruit drink effectively lowers serum LDL-cholesterol concentrations. Naumann E, van Rees AB, Onning G, Oste R, Wydra M, Mensink RP. Am J Clin Nutr. 2006 Mar; 83(3):601-5. https://www.ncbi.nlm.nih.gov/pubmed/16522906/
  58. Davidson M.H., McDonald A. Fiber: Forms and functions. Nutr. Res. 1998;18:617–624.
  59. Changes in serum lipids and postprandial glucose and insulin concentrations after consumption of beverages with beta-glucans from oats or barley: a randomised dose-controlled trial. Biörklund M, van Rees A, Mensink RP, Onning G. Eur J Clin Nutr. 2005 Nov; 59(11):1272-81. https://www.ncbi.nlm.nih.gov/pubmed/16015250/
  60. Regulation of hepatic glucose production in healthy subjects and patients with non-insulin-dependent diabetes mellitus. Tappy L. Diabete Metab. 1995 Oct; 21(4):233-40. https://www.ncbi.nlm.nih.gov/pubmed/8529757/
  61. Oat beta-glucan increases bile acid excretion and a fiber-rich barley fraction increases cholesterol excretion in ileostomy subjects. Lia A, Hallmans G, Sandberg AS, Sundberg B, Aman P, Andersson H. Am J Clin Nutr. 1995 Dec; 62(6):1245-51. https://www.ncbi.nlm.nih.gov/pubmed/7491888/
  62. Modulation of the postprandial phase by beta-glucan in overweight subjects: effects on glucose and insulin kinetics. Nazare JA, Normand S, Oste Triantafyllou A, Brac de la Perrière A, Desage M, Laville M. Mol Nutr Food Res. 2009 Mar; 53(3):361-9. https://www.ncbi.nlm.nih.gov/pubmed/18837470/
  63. In vitro bile-acid binding and fermentation of high, medium, and low molecular weight beta-glucan. Kim HJ, White PJ. J Agric Food Chem. 2010 Jan 13; 58(1):628-34. https://www.ncbi.nlm.nih.gov/pubmed/20020684/
  64. In vitro fermentation of oat flours from typical and high beta-glucan oat lines. Kim HJ, White PJ. J Agric Food Chem. 2009 Aug 26; 57(16):7529-36. https://www.ncbi.nlm.nih.gov/pubmed/19572543/
  65. Regulation by dietary fats of 3-hydroxy-3-methylglutaryl-Coenzyme A reductase in rat liver. Ide T, Okamatsu H, Sugano M. J Nutr. 1978 Apr; 108(4):601-12. https://www.ncbi.nlm.nih.gov/pubmed/632948/
  66. Randomized controlled crossover study of the effect of a highly beta-glucan-enriched barley on cardiovascular disease risk factors in mildly hypercholesterolemic men. Keogh GF, Cooper GJ, Mulvey TB, McArdle BH, Coles GD, Monro JA, Poppitt SD. Am J Clin Nutr. 2003 Oct; 78(4):711-8. https://www.ncbi.nlm.nih.gov/pubmed/14522728/
  67. A controlled study of consumption of beta-glucan-enriched soups for 2 months by type 2 diabetic free-living subjects. Cugnet-Anceau C, Nazare JA, Biorklund M, Le Coquil E, Sassolas A, Sothier M, Holm J, Landin-Olsson M, Onning G, Laville M, Moulin P. Br J Nutr. 2010 Feb; 103(3):422-8. https://www.ncbi.nlm.nih.gov/pubmed/19781120/
  68. Olano-Martin E., Gibson G.R., Rastell R.A. Comparison of the in vitro bifidogenic properties of pectins and pectic-oligosaccharides. J. Appl. Microbiol. 2002;93:505–511. doi: 10.1046/j.1365-2672.2002.01719.x. https://www.ncbi.nlm.nih.gov/pubmed/12174051
  69. Nangia-Makker P., Hogan V., Honjo Y., Baccarini S., Tait L., Bresalier R., Raz A. Inhibition of human cancer cell growth and metastasis in nude mice by oral intake of modified citrus pectin. J. Natl. Cancer Inst. 2002;94:1854–1862. https://www.ncbi.nlm.nih.gov/pubmed/12488479
  70. Ulmius M., Johansson A., Onning G. The influence of dietary fibre source and gender on the postprandial glucose and lipid response in healthy subjects. Eur. J. Nutr. 2009;48:395–402. https://www.ncbi.nlm.nih.gov/pubmed/19415409
  71. Qureshi A.A., Sami S.A., Khan F.A. Effects of stabilized rice bran, its soluble and fiber fractions on blood glucose levels and serum lipid parameters in humans with diabetes mellitus Types I and II. J. Nutr. Biochem. 2002;13:175–187. https://www.ncbi.nlm.nih.gov/pubmed/11893482
  72. Koh-Banerjee P., Franz M.V., Sampson L., Liu S.M., Jacobs D.R., Spiegelman D., Willett W., Rimm E. Changes in whole-grain, bran, and cereal fiber consumption in relation to 8-y weight gain among men. Am. J. Clin. Nutr. 2004;80:1237–1245. https://www.ncbi.nlm.nih.gov/pubmed/15531671
  73. Zhang J.X., Lundin E., Hallmans G., Adlercreutz H., Andersson H., Bosaeus I., Aman P., Stenling R., Dahlgren S. Effect of Rye Bran on Excretion of Bile-Acids, Cholesterol, Nitrogen, and Fat in Human-Subjects with Ileostomies. Am. J. Clin. Nutr. 1994;59:389–394. https://www.ncbi.nlm.nih.gov/pubmed/8310990
  74. Jensen M.K., Koh-Banerjee P., Hu F.B., Franz M., Sampson L., Gronbaek M., Rimm E.B. Intakes of whole grains, bran, and germ and the risk of coronary heart disease in men. Am. J. Clin. Nutr. 2004;80:1492–1499. https://www.ncbi.nlm.nih.gov/pubmed/15585760
  75. Andersson M., Ellegard L., Andersson H. Oat bran stimulates bile acid synthesis within 8 h as measured by 7 alpha-hydroxy-4-cholesten-3-one. Am. J. Clin. Nutr. 2002;76:1111–1116. https://www.ncbi.nlm.nih.gov/pubmed/12399287
  76. Schwartz S.E., Levine R.A., Singh A., Scheidecker J.R., Track N.S. Sustained pectin ingestion delays gastric emptying. Gastroenterology. 1982;83:812–817. https://www.ncbi.nlm.nih.gov/pubmed/6286402
  77. Lightowler H.J., Henry C.J. Glycemic response of mashed potato containing high-viscocity hydroxypropylmethylcellulose. Nutr. Res. 2009;29:551–557. https://www.ncbi.nlm.nih.gov/pubmed/19761889
  78. Maki K.C., Davidson M.H., Witchger M.S., Dicklin M.R., Subbaiah P.V. Effects of high‑fiber oat and wheat cereals on postprandial glucose and lipid responses in healthy men. Int. J. Vitam. Nutr. Res. 2007;77:347–356. https://www.ncbi.nlm.nih.gov/pubmed/18453320
  79. Maki K.C., Davidson M.H., Torri S., Ingram K.A., O’Mullane J., Daggy B.P., Albrecht H.H. High-molecular-weight hydroxypropylmethylcellulose taken with or between meals is hypocholesterolemic in adult men. J. Nutr. 2000;130:1705–1710. https://www.ncbi.nlm.nih.gov/pubmed/10867040
  80. Maki K.C., Carson M.L., Anderson W.H.K., Geohas J., Reeves M.S., Farmer M.V., Turowski M., Miller M., Kaden V.N., Dicklin M.R., Rains T.M. Lipid-altering effects of different formulations of hydroxypropylmethylcellulose. J. Clin. Lipidol. 2009;3:159–166. https://www.ncbi.nlm.nih.gov/pubmed/21291811
  81. Food and Agriculture Organization. Physiological Effects of Dietary Fibre. http://www.fao.org/docrep/w8079e/w8079e0l.htm
  82. Therapeutic effects of psyllium in type 2 diabetic patients. Sierra M, García JJ, Fernández N, Diez MJ, Calle AP. Eur J Clin Nutr. 2002 Sep; 56(9):830-42. https://www.ncbi.nlm.nih.gov/pubmed/12209371/
  83. Gastric emptying in early noninsulin-dependent diabetes mellitus. Jones KL, Horowitz M, Carney BI, Wishart JM, Guha S, Green L. J Nucl Med. 1996 Oct; 37(10):1643-8. https://www.ncbi.nlm.nih.gov/pubmed/8862300/
  84. Action of guar gums on the viscosity of digestive contents and on the gastrointestinal motor function in pigs. Cherbut C, Albina E, Champ M, Doublier JL, Lecannu G. Digestion. 1990; 46(4):205-13. https://www.ncbi.nlm.nih.gov/pubmed/2178135/
  85. Effect of viscous fiber (guar) on postprandial motor activity in human small bowel. Schönfeld J, Evans DF, Wingate DL. Dig Dis Sci. 1997 Aug; 42(8):1613-7. https://www.ncbi.nlm.nih.gov/pubmed/9286225/
  86. Effect of gel-forming gums on the intestinal unstirred layer and sugar transport in vitro. Johnson IT, Gee JM. Gut. 1981 May; 22(5):398-403. https://www.ncbi.nlm.nih.gov/pubmed/7250752/
  87. Role of viscous guar gums in lowering the glycemic response after a solid meal. Leclère CJ, Champ M, Boillot J, Guille G, Lecannu G, Molis C, Bornet F, Krempf M, Delort-Laval J, Galmiche JP. Am J Clin Nutr. 1994 Apr; 59(4):914-21. https://www.ncbi.nlm.nih.gov/pubmed/7818627/
  88. Dietary guar gum improves insulin sensitivity in streptozotocin-induced diabetic rats. Cameron-Smith D, Habito R, Barnett M, Collier GR. J Nutr. 1997 Feb; 127(2):359-64. https://www.ncbi.nlm.nih.gov/pubmed/9039840/
  89. Soluble dietary fibre improves insulin sensitivity by increasing muscle GLUT-4 content in stroke-prone spontaneously hypertensive rats. Song YJ, Sawamura M, Ikeda K, Igawa S, Yamori Y. Clin Exp Pharmacol Physiol. 2000 Jan-Feb; 27(1-2):41-5. https://www.ncbi.nlm.nih.gov/pubmed/10696527/
  90. Troglitazone effects on gene expression in human skeletal muscle of type II diabetes involve up-regulation of peroxisome proliferator-activated receptor-gamma. Park KS, Ciaraldi TP, Lindgren K, Abrams-Carter L, Mudaliar S, Nikoulina SE, Tufari SR, Veerkamp JH, Vidal-Puig A, Henry RR. J Clin Endocrinol Metab. 1998 Aug; 83(8):2830-5. https://www.ncbi.nlm.nih.gov/pubmed/9709955/
  91. Chen C, Zeng Y, Xu J, et al. Therapeutic effects of soluble dietary fiber consumption on type 2 diabetes mellitus. Experimental and Therapeutic Medicine. 2016;12(2):1232-1242. doi:10.3892/etm.2016.3377. https://www.ncbi.nlm.nih.gov/pmc/articles/PMC4950069/
  92. Aldoori WH, Giovannucci EL, Rockett HR, Sampson L, Rimm EB, Willett WC. A prospective study of dietary fiber types and symptomatic diverticular disease in men. J Nutr. 1998;128:714-9. https://www.ncbi.nlm.nih.gov/pubmed/9521633
  93. Resistant starch: metabolic effects and potential health benefits. Higgins JA. J AOAC Int. 2004 May-Jun; 87(3):761-8. https://www.ncbi.nlm.nih.gov/pubmed/15287677/
  94. Birt DF, Boylston T, Hendrich S, et al. Resistant Starch: Promise for Improving Human Health. Advances in Nutrition. 2013;4(6):587-601. doi:10.3945/an.113.004325. https://www.ncbi.nlm.nih.gov/pmc/articles/PMC3823506/
  95. Englyst HN, Kingman SM, Cummings JH. Classification and measurement of nutritionally important starch fractions. Eur J Clin Nutr. 1992;46(Supp 2):S33–50. https://www.ncbi.nlm.nih.gov/pubmed/1330528
  96. Woo KS, Seib PA. Cross-linked resistant starch: preparation and properties. Cereal Chem. 2002;79:819–25.
  97. Han J-A, BeMiller JN. Preparation and physical characteristics of slowly digesting modified food starches. Carbohydr Polym. 2007;67:366–74.
  98. Seneviratne HD, Biliaderis CG. Action of α-amylases on amylose-lipid complex superstructures. J Cereal Sci. 1991;13:129–43.
  99. Different types of resistant starch elicit different glucose reponses in humans. Haub MD, Hubach KL, Al-Tamimi EK, Ornelas S, Seib PA. J Nutr Metab. 2010; 2010. https://www.ncbi.nlm.nih.gov/pubmed/20700404/
  100. Consumption of both resistant starch and beta-glucan improves postprandial plasma glucose and insulin in women. Behall KM, Scholfield DJ, Hallfrisch JG, Liljeberg-Elmståhl HG. Diabetes Care. 2006 May; 29(5):976-81. https://www.ncbi.nlm.nih.gov/pubmed/16644623/
  101. Glycemic and insulinemic response of subjects with type 2 diabetes after consumption of three energy bars. Reader DM, O’Connell BS, Johnson ML, Franz M. J Am Diet Assoc. 2002 Aug; 102(8):1139-42. https://www.ncbi.nlm.nih.gov/pubmed/12171462/
  102. Consumption of Cross-Linked Resistant Starch (RS4(XL
  103. Diets containing high amylose vs amylopectin starch: effects on metabolic variables in human subjects. Behall KM, Scholfield DJ, Yuhaniak I, Canary J. Am J Clin Nutr. 1989 Feb; 49(2):337-44. https://www.ncbi.nlm.nih.gov/pubmed/2644803/
  104. Blood lipids, lipoproteins, apoproteins, and uric acid in men fed diets containing fructose or high-amylose cornstarch. Reiser S, Powell AS, Scholfield DJ, Panda P, Ellwood KC, Canary JJ. Am J Clin Nutr. 1989 May; 49(5):832-9. https://www.ncbi.nlm.nih.gov/pubmed/2497634/
  105. Diet-induced changes in serum transaminase and triglyceride levels in healthy adult men. Role of sucrose and excess calories. Porikos KP, Van Itallie TB. Am J Med. 1983 Oct; 75(4):624-30. https://www.ncbi.nlm.nih.gov/pubmed/6624769/
  106. Physiological effects of resistant starches on fecal bulk, short chain fatty acids, blood lipids and glycemic index. Jenkins DJ, Vuksan V, Kendall CW, Würsch P, Jeffcoat R, Waring S, Mehling CC, Vidgen E, Augustin LS, Wong E. J Am Coll Nutr. 1998 Dec; 17(6):609-16. https://www.ncbi.nlm.nih.gov/pubmed/9853541/
  107. The effect of raw potato starch on energy expenditure and substrate oxidation. Tagliabue A, Raben A, Heijnen ML, Deurenberg P, Pasquali E, Astrup A. Am J Clin Nutr. 1995 May; 61(5):1070-5. https://www.ncbi.nlm.nih.gov/pubmed/7733031/
  108. Dietary starch composition and level of energy intake alter nutrient oxidation in “carbohydrate-sensitive” men. Howe JC, Rumpler WV, Behall KM. J Nutr. 1996 Sep; 126(9):2120-9. https://www.ncbi.nlm.nih.gov/pubmed/8814200/
  109. Insulin-sensitizing effects of dietary resistant starch and effects on skeletal muscle and adipose tissue metabolism. Robertson MD, Bickerton AS, Dennis AL, Vidal H, Frayn KN. Am J Clin Nutr. 2005 Sep; 82(3):559-67. https://www.ncbi.nlm.nih.gov/pubmed/16155268/
  110. Dietitians Association of Australia. Dietary fibre: key for a happy, healthy gut. https://daa.asn.au/smart-eating-for-you/smart-eating-fast-facts/nourishing-nutrients/dietary-fibre-a-key-ingredient-in-gut-happiness/
  111. Liu S. Intake of refined carbohydrates and whole grain foods in relation to risk of type 2 diabetes mellitus and coronary heart disease.J Am Coll Nutr 2002;21:298-306. https://www.ncbi.nlm.nih.gov/pubmed/12166526?dopt=Abstract
  112. Pereira MA, O’Reilly E, Augustsson K, et al. Dietary fiber and risk of coronary heart disease: a pooled analysis of cohort studies. Arch Intern Med. 2004;164:370-6. https://www.ncbi.nlm.nih.gov/pubmed/14980987
  113. Rimm EB, Ascherio A, Giovannucci E, Spiegelman D, Stampfer MJ, Willett WC. Vegetable, fruit, and cereal fiber intake and risk of coronary heart disease among men. JAMA. 1996;275:447-51. https://www.ncbi.nlm.nih.gov/pubmed/8627965
  114. Brown L, Rosner B, Willett WW, Sacks FM. Cholesterol-lowering effects of dietary fiber: a meta-analysis. Am J Clin Nutr. 1999;69:30-42. https://www.ncbi.nlm.nih.gov/pubmed/9925120
  115. McKeown NM, Meigs JB, Liu S, Wilson PW, Jacques PF. Whole-grain intake is favorably associated with metabolic risk factors for type 2 diabetes and cardiovascular disease in the Framingham Offspring Study. Am J Clin Nutr. 2002;76:390-8. https://www.ncbi.nlm.nih.gov/pubmed/12145012
  116. McKeown NM, Meigs JB, Liu S, Saltzman E, Wilson PW, Jacques PF. Carbohydrate nutrition, insulin resistance, and the prevalence of the metabolic syndrome in the Framingham Offspring Cohort. Diabetes Care. 2004;27:538-46. https://www.ncbi.nlm.nih.gov/pubmed/14747241
  117. National Cholesterol Education Program (NCEP) Expert Panel on Detection, Evaluation and Treatment of High Blood Cholesterol in Adults (Adult Treatment Panel III): Third report of the national cholesterol education program (ncep) expert panel on detection, evaluation, and treatment of high blood cholesterol in Adults (Adult Treatment Panel III) final report. Circulation. 2002;106:3143–3421. https://www.ncbi.nlm.nih.gov/pubmed/12485966
  118. Ortega RM, Palencia A, López-Sobaler AM. Improvement of cholesterol levels and reduction of cardiovascular risk via the consumption of phytosterols. Br J Nutr. 2006;96(Suppl 1):S89–S93. doi: 10.1079/BJN20061708. https://www.ncbi.nlm.nih.gov/pubmed/16923260
  119. Theuwissen E, Mensink RP. Water-soluble dietary fibers and cardiovascular disease. Physiol Behav. 2008;94:285–292. doi: 10.1016/j.physbeh.2008.01.001. https://www.ncbi.nlm.nih.gov/pubmed/18302966
  120. American Diabetes Association: Nutrition recommendations and principles for people with diabetes mellitus. Diabetes Care. 2000;23(Suppl 1):S43–S46. https://www.ncbi.nlm.nih.gov/pubmed/12017676
  121. Bernaud FS, Rodrigues TC. Dietary fiber-adequate intake and effects on metabolism health. Arq Bras Endocrinol Metabol. 2013;57:397–405. doi: 10.1590/S0004-27302013000600001. https://www.ncbi.nlm.nih.gov/pubmed/24030179
  122. Frankenfeld CL. Cardiometabolic risk factors are associated with high urinary enterolactone concentration, independent of urinary enterodiol concentration and dietary fiber intake in adults. J Nutr. 2014;144:1445–1453. doi: 10.3945/jn.114.190512. https://www.ncbi.nlm.nih.gov/pubmed/24966407
  123. Breneman CB, Tucker L. Dietary fibre consumption and insulin resistance-the role of body fat and physical activity. Br J Nutr. 2013;110:375–383. doi: 10.1017/S0007114512004953. https://www.ncbi.nlm.nih.gov/pubmed/23218116
  124. Am J Clin Nutr November 2003, vol. 78 no. 5 920-927. Relation between changes in intakes of dietary fiber and grain products and changes in weight and development of obesity among middle-aged women. http://ajcn.nutrition.org/content/78/5/920.long
  125. Meyer K.A., Kushi L.H., Jacobs D.R., Jr., Slavin J., Sellers T.A., Folsom A.R. Carbohydrates, dietary fiber, and incident type 2 diabetes in older women. Am. J. Clin. Nutr. 2000;71:921–930. – https://www.ncbi.nlm.nih.gov/pubmed/10731498
  126. Park Y., Brinton L.A., Subar A.F., Hollenbeck A., Schatzkin A. Dietary fiber intake and risk of breast cancer in postmenopausal women: The National Institutes of Health-AARP Diet and Health Study. Am. J. Clin. Nutr. 2009;90:664–671. – https://www.ncbi.nlm.nih.gov/pmc/articles/PMC2728649/
  127. Streppel M.T., Ocke M.C., Boshuizen H.C., Kok F.J., Kromhout D. Dietary fiber intake in relation to coronary heart disease and all-cause mortality over 40 y: The Zutphen Study. Am. J. Clin. Nutr. 2008;88:1119–1125. – https://www.ncbi.nlm.nih.gov/pubmed/18842802
  128. Tucker L.A., Thomas K.S. Increasing total fiber intake reduces risk of weight and fat gains in women. J. Nutr. 2009;139:576–581. https://www.ncbi.nlm.nih.gov/pubmed/19158230
  129. Baer D.J., Rumpler W.V., Miles C.W., Fahey G.C. Dietary fiber decreases the metabolizable energy content and nutrient digestibility of mixed diets fed to humans. J. Nutr. 1997;127:579–586. https://www.ncbi.nlm.nih.gov/pubmed/9109608
  130. Isken F., Klaus S., Osterhoff M., Pfeiffer A.F.H., Weickert M.O. Effects of long-term soluble vs. insoluble dietary fiber intake on high-fat diet-induced obesity in C57BL/6J mice. J. Nutr. Biochem. 2010;21:278–284. doi: 10.1016/j.jnutbio.2008.12.012. https://www.ncbi.nlm.nih.gov/pubmed/19369060
  131. Schneeman B.O. Dietary fiber and gastrointestinal function. Nutr. Res. 1998;18:625–632.
  132. Weickert M.O., Pfeiffer A.F. Metabolic effects of dietary fiber consumption and prevention of diabetes. J. Nutr. 2008;138:439–442. https://www.ncbi.nlm.nih.gov/pubmed/18287346
  133. Renteria-Flores J.A., Johnston L.J., Shurson G.C., Gallaher D.D. Effect of soluble and insoluble fiber on energy digestibility, nitrogen retention, and fiber digestibility of diets fed to gestating sows. J. Anim. Sci. 2008;86:2568–2575. doi: 10.2527/jas.2007-0375. https://www.ncbi.nlm.nih.gov/pubmed/18539846
  134. Anderson J.W. Physiological and Metabolic Effects of Dietary Fiber. Fed. Proc. 1985;44:2902–2906. https://www.ncbi.nlm.nih.gov/pubmed/2996944
  135. Keenan M.J., Zhou J., McCutcheon K.L., Raggio A.M., Bateman H.G., Todd E., Jones C.K., Tulley R.T., Melton S., Martin R.J., Hegsted M. Effects of resistant starch, a non–digestible fermentable fiber, on reducing body fat. Obesity (Silver Spring) 2006;14:1523–1534. https://www.ncbi.nlm.nih.gov/pubmed/17030963
  136. Du H.D., van der A D.L., Boshuizen H.C., Forouhi N.G., Wareham N.J., Halkjaer J., Tjonneland A., Overvad K., Jakobsen M.U., Boeing H., et al. Dietary fiber and subsequent changes in body weight and waist circumference in European men and women. Am. J. Clin. Nutr. 2010;91:329–336. doi: 10.3945/ajcn.2009.28191. https://www.ncbi.nlm.nih.gov/pubmed/20016015
  137. L Brown , B Rosner , WW Willett , et al. (1999) Cholesterol-lowering effects of dietary fiber: a meta-analysis. J Hypertens 69, 30–42.
  138. Scientific Advisory Committee on Nutrition (2015) Carbohydrates and Health Report. London: Public Health England.
  139. American Heart Association – Eating more whole grains linked with lower risk of death – http://newsroom.heart.org/news/eating-more-whole-grains-linked-with-lower-risk-of-death?preview=f77a
  140. Y Kim & Y Je (2014) Dietary fiber intake and total mortality: a meta-analysis of prospective cohort studies. Am J Epidemiol 180, 565–573. https://academic.oup.com/aje/article-lookup/doi/10.1093/aje/kwu174
  141. Park Y., Brinton L.A., Subar A.F., Hollenbeck A., Schatzkin A. Dietary fiber intake and risk of breast cancer in postmenopausal women: The National Institutes of Health-AARP Diet and Health Study. Am. J. Clin. Nutr. 2009;90:664–671. – https://www.ncbi.nlm.nih.gov/pmc/articles/PMC2728649/
  142. Nomura A.M., Hankin J.H., Henderson B.E., Wilkens L.R., Murphy S.P., Pike M.C., Le Marchand L., Stram D.O., Monroe K.R., Kolonel L.N. Dietary fiber and colorectal cancer risk: The multiethnic cohort study. Cancer Causes Control. 2007;18:753–764. – https://www.ncbi.nlm.nih.gov/pubmed/17557210
  143. Schatzkin A., Park Y., Leitzmann M.F., Hollenbeck A.R., Cross A.J. Prospective study of dietary fiber, whole grain foods, and small intestinal cancer. Gastroenterology. 2008;135:1163–1167. – https://www.ncbi.nlm.nih.gov/pmc/articles/PMC3513331/
  144. Farvid MS, Eliassen AH, Cho E, Liao X, Chen WY, Willett WC. Dietary fiber intake in young adults and breast cancer risk. Pediatrics 2016: 137(3). http://pediatrics.aappublications.org/content/early/2016/01/28/peds.2015-1226
  145. Young G.P., Hu Y., Le Leu R.K., Nyskohus L. Dietary fibre and colorectal cancer: A model for environment—gene interactions. Mol. Nutr. Food Res. 2005;49:571–584. – https://www.ncbi.nlm.nih.gov/pubmed/15864783
  146. Fuchs CS, Giovannucci EL, Colditz GA, et al. Dietary fiber and the risk of colorectal cancer and adenoma in women. N Engl J Med. 1999;340:169-76. https://www.ncbi.nlm.nih.gov/pubmed/9895396
  147. Ann Intern Med. 1978 Apr;88(4):482-6. – High-fiber diets in the treatment of diabetes mellitus.- https://www.ncbi.nlm.nih.gov/pubmed/637427
  148. Va Med. 1979 Nov;106(11):852-5. – High-fiber diet: its role in the treatment of diabetes mellitus reviewed. – https://www.ncbi.nlm.nih.gov/pubmed/506434
  149. DE Threapleton , DC Greenwood , C Evans , et al. (2013) Dietary fibre intake and diabetes risk: a systematic review and meta-analysis of prospective studies. Proc Nutr Soc 72, E253.
  150. B Yao , H Fang , W Xu , et al. (2014) Dietary fiber intake and risk of type 2 diabetes: a dose–response analysis of prospective studies. Eur J Epidemiol 29, 79–88.
  151. Adv Exp Med Biol. 1979;119:263-73.- High carbohydrate, high fiber diets for patients with diabetes. – https://www.ncbi.nlm.nih.gov/pubmed/495284
  152. Diabetes Care. 1978 Mar-Apr;1(2):77-82. – Long-term effects of high-carbohydrate, high-fiber diets on glucose and lipid metabolism: a preliminary report on patients with diabetes. – https://www.ncbi.nlm.nih.gov/pubmed/729433
  153. Fung TT, Hu FB, Pereira MA, et al. Whole-grain intake and the risk of type 2 diabetes: a prospective study in men. Am J Clin Nutr. 2002;76:535-40. https://www.ncbi.nlm.nih.gov/pubmed/12197996
  154. Liu S, Willett WC, Stampfer MJ, et al. A prospective study of dietary glycemic load, carbohydrate intake, and risk of coronary heart disease in US women. Am J Clin Nutr. 2000;71:1455-61. https://www.ncbi.nlm.nih.gov/pubmed/10837285
  155. Schulze MB, Liu S, Rimm EB, Manson JE, Willett WC, Hu FB. Glycemic index, glycemic load, and dietary fiber intake and incidence of type 2 diabetes in younger and middle-aged women. Am J Clin Nutr. 2004;80:348-56. https://www.ncbi.nlm.nih.gov/pubmed/15277155
  156. Krishnan S, Rosenberg L, Singer M, et al. Glycemic index, glycemic load, and cereal fiber intake and risk of type 2 diabetes in US black women. Arch Intern Med. 2007;167:2304-9. https://www.ncbi.nlm.nih.gov/pubmed/18039988
  157. Am J Clin Nutr. 1991 Nov;54(5):936-43. – Metabolic effects of high-carbohydrate, high-fiber diets for insulin-dependent diabetic individuals. – https://www.ncbi.nlm.nih.gov/pubmed/1659172
  158. Streppel M.T., Ocke M.C., Boshuizen H.C., Kok F.J., Kromhout D. Dietary fiber intake in relation to coronary heart disease and all-cause mortality over 40 y: The Zutphen Study. Am. J. Clin. Nutr. 2008;88:1119–1125. – https://www.ncbi.nlm.nih.gov/pubmed/18842802
  159. Pereira M.A., O’Reilly E., Augustsson K., Fraser G.E., Goldbourt U., Heitmann B.L., Hallmans G., Knekt P., Liu S.M., Pietinen P., Spiegelman D., Stevens J., Virtamo J., Willett W.C., Ascherio A. Dietary fiber and risk of coronary heart disease—A pooled analysis of cohort studies. Arch. Intern. Med. 2004;164:370–376. – https://www.ncbi.nlm.nih.gov/pubmed/14980987
  160. Cereal fiber improves whole-body insulin sensitivity in overweight and obese women. Weickert MO, Möhlig M, Schöfl C, Arafat AM, Otto B, Viehoff H, Koebnick C, Kohl A, Spranger J, Pfeiffer AF. Diabetes Care. 2006 Apr; 29(4):775-80. https://www.ncbi.nlm.nih.gov/pubmed/16567814/
  161. Whole-grain, bran, and cereal fiber intakes and markers of systemic inflammation in diabetic women. Qi L, van Dam RM, Liu S, Franz M, Mantzoros C, Hu FB. Diabetes Care. 2006 Feb; 29(2):207-11. https://www.ncbi.nlm.nih.gov/pubmed/16443861/
  162. Evidence-based nutrition principles and recommendations for the treatment and prevention of diabetes and related complications. American Diabetes Association. Diabetes Care. 2002 Jan; 25(1):202-12. https://www.ncbi.nlm.nih.gov/pubmed/11772917/
  163. Story J.A., Furumoto E.J., Buhman K.K. Dietary fiber and bile acid metabolism—an update. Adv. Exp. Med. Biol. 1997;427:259–266.- https://www.ncbi.nlm.nih.gov/pubmed/9361851
  164. Esposito K., Nappo F., Giugliano F., Di Palo C., Ciotola M., Barbieri M., Paolisso G., Giugliano D. Meal modulation of circulating interleukin 18 and adiponectin concentrations in healthy subjects and in patients with type 2 diabetes mellitus. Am. J. Clin. Nutr. 2003;78:1135–1140. – https://www.ncbi.nlm.nih.gov/pubmed/14668275
  165. Ma Y.S., Griffith J.A., Chasan-Taber L., Olendzki B.C., Jackson E., Stanek E.J., Li W.J., Pagoto S.L., Hafner A.R., Ockene I.S. Association between dietary fiber and serum C-reactive protein. Am. J. Clin. Nutr. 2006;83:760–766. – https://www.ncbi.nlm.nih.gov/pmc/articles/PMC1456807/
  166. MT Streppel , LR Arends , P Van’t Veer , et al. (2005) Dietary fiber and blood pressure: a meta-analysis of randomized placebo-controlled trials. Arch Intern Med 165, 150–156.
  167. SP Whelton , AD Hyre , B Pedersen , et al. (2005) Effect of dietary fiber intake on blood pressure: a meta-analysis of randomized, controlled clinical trials. J Hypertens 23, 475–481.
  168. CE Evans , DC Greenwood , DE Threapleton , et al. (2015) Effects of dietary fibre type on blood pressure: a systematic review and meta-analysis of randomized controlled trials of healthy individuals. J Hypertens 33, 897–911.
  169. American Heart Association journal Stroke March 28, 2013 – Eating More Fiber May Reduce Stroke Risk – https://www.goredforwomen.org/about-heart-disease/eating-more-fiber-may-reduce-stroke-risk/
  170. American Heart Association Rapid Access Journal Report May 08, 2014 – Stroke News – Eating more fruits, vegetables may cut stroke risk worldwide – http://newsroom.heart.org/news/eating-more-fruits-vegetables-may-cut-stroke-risk-worldwide
  171. American Heart Association journal Circulation June 14, 2016, Volume 133, Issue 24: Whole Grain Intake and Mortality From All Causes, Cardiovascular Disease, and Cancer: A Meta-Analysis of Prospective Cohort Studies – https://doi.org/10.1161/CIRCULATIONAHA.115.021101; Circulation. 2016;133:2370-2380
  172. Huang T, Xu M, Lee A, Cho S, Qi L. Consumption of whole grains and cereal fiber and total and cause-specific mortality: prospective analysis of 367,442 individuals. BMC Med. 2015;13:59. doi: 10.1186/s12916-015-0294-7.
  173. Johnsen NF, Frederiksen K, Christensen J, Skeie G, Lund E, Landberg R, Johansson I, Nilsson LM, Halkjær J, Olsen A, Overvad K, Tjønneland A. Whole-grain products and whole-grain types are associated with lower all-cause and cause-specific mortality in the Scandinavian HELGA cohort. Br J Nutr. 2015;114:608–623. doi: 10.1017/S0007114515001701.
  174. Nutrients. 2010 Dec; 2(12): 1266–1289. – Effects of Dietary Fiber and Its Components on Metabolic Health – https://www.ncbi.nlm.nih.gov/pmc/articles/PMC3257631/
read more
Diet PlanDiet, Food & Fitness

What is Ornish Diet ?

ornish diet

Ornish diet

The Ornish Diet

The Ornish Diet is also known as a Very-Low-Fat (VLF) diets that allow less than 15% of total calories from fat (with an equal distribution of saturated, monounsaturated, and polyunsaturated fats), 15% from protein, and 70% from carbohydrates. The Very-Low-Fat (VLF) diets are the main dietary factor in the Pritikin Diet as well. The Very-Low-Fat diet includes variations of vegetarian diets that may include eggs and dairy. Although an American Heart Association scientific statement concluded there were little long-term data to suggest that low-fat diets alone will sustain long-term weight loss, there is evidence that this diet can impact cardiovascular risk 1.

Dr. Ornish argues that protein and saturated fat increase the risk of mortality and chronic disease, therefore the fat content of your diet must be less than 10% fat with whole food and are plant-based. When comparing the Ornish diet with the highly processed, refined-carbohydrate-rich diet most Americans consume today it’s almost certainly healthier.

The problem with Ornish diet is it’s claimed that protein and fat are the cause of our health and weight problem today. Which is not true based on current  large observational studies that have found that diets high in fat and protein are not associated with disease and may even protect against it. Nutrition is complex but there is little evidence the world’s obesity epidemic and worsening metabolic disorders are the fault of protein or fat. If anything, our attempts to eat less fat in recent decades have made things worse !

When people vigilantly cut down on fat in the 1980s and 1990s, they replaced much of it with high-sugar and high-calorie processed foods.

During the time in which the prevalence of obesity in the U.S. nearly tripled (1970 – 2017), the percentage of calories Americans consumed from protein and fat actually dropped whereas the percentage of calories Americans ingested from carbohydrates—one of the nutrient groups Ornish says we should eat more of—increased.

Could it be that our attempts to reduce fat have in fact been part of the problem ? Some scientists think so and we believe the low-fat message promoted the obesity epidemic.

Furthermore, another aspect of the Ornish diet—avoiding all added oils and even high-fat plant foods like avocados and nuts—isn’t necessarily helpful. There’s now lots of evidence that unsaturated fat lowers blood lipids such as cholesterol and reduces heart disease 2. What’s more, a low-fat diet is, by definition, a high-carbohydrate diet. These diets tend to promote the release of insulin, the hormone that regulates blood sugar levels. In people who aren’t very physically active, high insulin levels send a signal that it’s time to store fat, which can lead to weight gain.

The Ornish Lifestyle Heart Trial 3 randomized 48 patients with moderate to severe coronary heart disease (CHD) to intensive life-style changes or usual care. The intensive life-style changes included a vegetarian diet with 7% of caloric intake coming from fat, moderate aerobic exercise, stress management training, smoking cessation, and group psychosocial support. A total of 195 coronary artery lesions were analyzed angiographically. Overall, 82% of experimental group patients had an average change toward lesion regression. At five years, there were 2.5 times fewer cardiac events in the intervention group, and the average percent diameter stenosis showed an 8% decrease in diameter, whereas the control group had 28% progression. However, the data are difficult to interpret due to the confounding effects of exercise, stress reduction, and 11-kg weight loss in the intervention group. Although the intervention seems beneficial, the small sample size and intense life-style changes raise concerns about the universal sustainability of such a program.

The Very-Low-Fat Ornish diet and intense life-style changes have significant results in terms of reducing risk factors and cardiac event rates. However, these studies are relatively small, and the programs involved may be influenced by selection bias. The programs require a motivated group of patients to undergo rigorous life-style adjustments. The VLF Ornish diet may be unnecessary if other life-style characteristics like exercise, smoking cessation, and stress management are optimized 4.

The recent multicenter PREDIMED trial also supports the notion that fat can be good rather than bad. It found that individuals assigned to eat high-fat (41 percent calories from fat), Mediterranean-style diets for nearly five years were about 30 percent less likely to experience serious heart-related problems compared with individuals who were told to avoid fat. (All groups consumed about the same amount of protein.) Protein, too, doesn’t look so evil when one considers the 2010 trial published in The New England Journal of Medicine that found individuals who had recently lost weight were more likely to keep it off if they ate more protein, along with the 2005 OmniHeart trial that reported individuals who substituted either protein or monounsaturated fat for some of their carbohydrates reduced their cardiovascular risk factors compared with individuals who did not.

The other problem with Ornish’s antiprotein stance is that he lumps all animal proteins together. For instance, he wrote that animal proteins have been associated with higher disease and mortality risks. However that is only true if you combine processed meats like bacon, salami, pepperoni, hot dogs with unprocessed meats. A 2010 systematic review and meta-analysis of 20 studies found consumption of processed meat was associated with an increased risk of diabetes and heart disease but eating unprocessed red meat was not. A 2014 meta-analysis similarly reported much higher mortality risks associated with processed meat compared with red meat consumption and found no problems associated with white meat. And it is worth noting that among people in the study over 65, heavy consumption of animal protein actually protected against cancer and mortality. Also the heavy protein consumers in the study were consuming nearly 30 percent more protein than the average American does. So there’s little evidence to suggest that we need to avoid protein and fat.

The patients who followed the Ornish diet also quit smoking, started exercising and attended stress management training. The people in the control group were told to do none of these things. It’s hardly surprising that quitting smoking, exercising, reducing stress and dieting—when done together—improves heart health. But fact that the participants were making all of these lifestyle changes means that we cannot make any inferences about the effect of the Ornish diet alone.

Ornish Diet vs  Zone Diet vs Atkins Diet vs LEARN Diet for Weight Loss

In a 2007 study 5, where researchers randomly assigned 311 individuals to four groups: one group was assigned the high-fat, high-protein and low-carbohydrate (Atkins diet); the second was assigned Ornish’s very low-fat vegetarian diet, which requires consuming fewer than 10 percent of calories from fat; the third was assigned the Zone diet, which aims for a 40/30/30 percent distribution of carbohydrate, protein and fat (macronutrient balance); and the fourth was assigned the high-carbohydrate, low–saturated fat LEARN (for: lifestyle, exercise, attitudes, relationships, nutrition) diet. Participants were randomly assigned to follow the Atkins (n = 77), Zone (n = 79), LEARN (n = 79), or Ornish (n = 76) diets and received weekly instruction for 2 months, then an additional 10-month follow-up. Weight loss at 12 months was the primary outcome. Secondary outcomes included lipid profile (low-density lipoprotein, high-density lipoprotein, and non–high-density lipoprotein cholesterol, and triglyceride levels), percentage of body fat, waist-hip ratio, fasting insulin and glucose levels, and blood pressure. Outcomes were assessed at months 0, 2, 6, and 12. The participants all had trouble adhering to their regimens, but all lost about the same statistically significant amounts of weight, and when compared head to head, the Atkins dieters saw greater improvements in blood pressure and HDL cholesterol than the Ornish dieters did.

Results 5: Weight loss was greater for women in the Atkins diet group compared with the other diet groups at 12 months, and mean 12-month weight loss was significantly different between the Atkins and Zone diets. Mean 12-month weight loss was as follows:

  • Atkins, −4.7 kg ( −6.3 to −3.1 kg),
  • Zone, −1.6 kg (−2.8 to −0.4 kg),
  • LEARN, −2.6 kg (−3.8 to −1.3 kg), and
  • Ornish, −2.2 kg (−3.6 to −0.8 kg).
  • Weight loss was not statistically different among the Zone, LEARN, and Ornish groups.
  • At 12 months, secondary outcomes for the Atkins group were comparable with or more favorable than the other diet groups.

Conclusions  5: In this study, premenopausal overweight and obese women assigned to follow the Atkins diet, which had the lowest carbohydrate intake, lost more weight and experienced more favorable overall metabolic effects at 12 months than women assigned to follow the Zone, Ornish, or LEARN diets. Average weight loss across all four groups ranged from 3.5 to 10.4 pounds. The authors note that “even modest reductions in excess weight have clinically significant effects on risk factors such as triglycerides and blood pressure.” While questions remain about long-term effects and mechanisms, a low-carbohydrate, high-protein, high-fat diet may be considered a feasible alternative recommendation for weight loss.

In another study published in the Journal of American Medical Association, where a total of 160 participants were randomly assigned to either Atkins (carbohydrate restriction), Zone , Weight Watchers (calorie restriction), or Ornish (fat restriction) diet groups. After 12 months of maximum effort, participants on the Atkins Diet which had the lowest carbohydrate intake, lost more weight at 12 months than participants assigned to follow the Zone diet, and had experienced comparable or more favorable metabolic effects than those assigned to the Zone, Weight Watchers or Ornish  diets. Each diet significantly reduced the low-density lipoprotein/high-density lipoprotein (HDL) cholesterol ratio by approximately 10%, with no significant effects on blood pressure or glucose at 1 year. Each popular diet modestly reduced body weight and several cardiac risk factors at 1 year. The participants all had trouble adhering to their regimens, although increased adherence was associated with greater weight loss and cardiac risk factor reductions for each diet group. While questions remain about long-term effects and mechanisms, a low-carbohydrate, high-protein, high-fat diet may be considered a feasible alternative recommendation for weight loss.

References
  1. A.H. Lichtenstein, L. Van Horn. AHA science advisory: very low fat diets. Circulation, 98 (1998), pp. 935-939
  2. American Heart Association. The Skinny on Fats. http://www.heart.org/HEARTORG/Conditions/Cholesterol/PreventionTreatmentofHighCholesterol/Know-Your-Fats_UCM_305628_Article.jsp
  3. D. Ornish, L.W. Scherwitz, J.H. Billings. Intensive lifestyle changes for reversal of coronary heart disease. JAMA, 280 (1998), pp. 2001-2007
  4. Journal of the American College of Cardiology. Volume 45, Issue 9, 3 May 2005, Pages 1379-1387. Diets and Cardiovascular Disease: An Evidence-Based Assessment. http://www.sciencedirect.com/science/article/pii/S0735109705003670
  5. JAMA. 2007 Mar 7;297(9):969-77. Comparison of the Atkins, Zone, Ornish, and LEARN diets for change in weight and related risk factors among overweight premenopausal women: the A TO Z Weight Loss Study: a randomized trial. https://www.ncbi.nlm.nih.gov/pubmed/17341711
read more
Diet PlanDiet, Food & Fitness

What is the Zone Diet ?

Zone diet

Zone diet

The Zone Diet

The Zone Diet is created by Dr. Barry Sears based on his Zone book to control diet-induced inflammation for a lifetime. The Zone diet is designed so that a person’s daily calorie consumption is comprised of 40 percent carbohydrates, 30 percent protein, and 30 percent fat specifically advocates sparing use of grains and starches 1. More importantly, the precise 0.75 protein to carbohydrate ratio (3 gram protein for every 4 gram carbohydrate) is  required with each meal and is promoted to reduce the insulin to glucagon ratio, which purportedly affects eicosanoid metabolism and ultimately produces a cascade of biological events leading to a reduction in chronic disease risk, enhanced immunity, maximal physical and mental performance, increased longevity and permanent weight loss. According to the Zone Diet doctrine, every meal must conform to this 0.75 Protein : Carbohydrate in order to realize the purported health benefits 2. While fat makes up the remaining 30% of total energy. This program typically consisted of an active weight loss-phase in which the daily caloric intake was reduced to 1500 for males and 1200 calories for females, followed by a weight maintenance phase. The recommended macronutrient intake during both phases was 40% carbohydrates, 30% protein and 30% fats. Thirty minutes of exercise on most days of the week was encouraged. Participants were typically offered meal planning and nutritional counseling from a dietitian and group support. Other cointerventions include prepared foods to aid with adherence.

However, there is presently little scientific support for the connections made between the Zone diet, endocrinology and eicosanoid metabolism 3. In fact, a review of the literature suggests that there are scientific contradictions in the Zone Diet hypothesis that cast unquestionable doubt on its potential efficacy.

The underlying dietary principle based on the glycemic index (GI) of foods, specifically the Zone diet allows carbohydrate consumption as long as they have a low glycemic index (GI). The glycemic index (GI) is a measure of the blood glucose response to intake of a particular carbohydrate 4. The higher the peak in postprandial blood glucose levels, the higher the GI value. The glycemic load (GL) is the product of dietary GI and total dietary carbohydrate, providing a useful measure of the total glycemic effect 5. Table 1 shows a list of common foods and their associated GI and GL. A high-GI diet has been proposed to increase hunger and elevate free fatty acid levels, leading to an increased risk of obesity, diabetes, and CVD 6. Several in vitro experiments indicate that elevated postprandial blood glucose levels cause oxidative stress, leading to endothelial damage and activation of coagulation 7.

Table 1. Glycemic Index and Glycemic Loads of Various Foods 6

FoodGlycemic IndexGlycemic Load
Glucose100
Cornflakes9224
Baked potato8526
Instant rice7528
White bread7010
Coca-cola6316
Wheat bread5210
Carrot473
Spaghetti4120
Apple406
Lentil beans295
Peanuts131

On the Zone diet, you get 3 meals and 2 snacks a day. Each is a mix of low-fat protein, like skinless chicken, turkey, or fish; carbs (mostly fruits and veggies); and a small amount of “good” fat, like olive oil, almonds, and avocado.

Here is what a Zone Diet is all about:

  • Every meal on the Zone has the same proportions: 30% protein, 30% fat, and 40% carbohydrate. You need to stick to the 30% protein, 30% fat, and 40% carbs formula at every meal and snack. You can’t pile on the protein at lunch and then have all carbs for dinner.
  • And calories do count on the Zone diet. Women get about 1,200 calories a day. For men, it’s 1,500.
  • If you have high blood pressure or heart disease and were told to watch your salt, The Zone Diet’s emphasis on fresh ingredients and the shunning of prepared foods will likely fit well into your diet.
  • The Zone Diet also has fitness recommendations that closely follow those of the American Heart Association.

The precise 0.75 protein to carbohydrate ratio required by the Zone Diet with each meal is promoted to reduce the insulin to glucagon ratio, which purportedly affects eicosanoid metabolism and ultimately produces a cascade of biological events leading to a reduction in chronic disease risk, enhanced immunity, maximal physical and mental performance, increased longevity and permanent weight loss. No food is completely banned, but if you’re a carb-lover, you may find getting used to the Zone plan challenging. It encourages you to think of bread, pasta, grains, and other starches as condiments rather than as main or even side dishes.

Veggies and fruits that are relatively high in sugar — like corn, carrots, bananas, and raisins — are on the “unfavorable” list. Fatty red meat and egg yolks fall into the Zone’s “bad fats” column.

What that looks like on the plate is a palm-sized portion of protein, two-thirds of the plate filled with nonstarchy fruits and vegetables, and a dash of monounsaturated fat like olive oil or slivered almonds.

Zone Diet vs Atkins Diet vs LEARN Diet vs Ornish Diet for Weight Loss

In a 2007 study 8, where researchers randomly assigned 311 individuals to four groups: one group was assigned the high-fat, high-protein and low-carbohydrate (Atkins diet); the second was assigned Ornish’s very low-fat vegetarian diet, which requires consuming fewer than 10 percent of calories from fat; the third was assigned the Zone diet, which aims for a 40/30/30 percent distribution of carbohydrate, protein and fat (macronutrient balance); and the fourth was assigned the high-carbohydrate, low–saturated fat LEARN (for: lifestyle, exercise, attitudes, relationships, nutrition) diet. Participants were randomly assigned to follow the Atkins (n = 77), Zone (n = 79), LEARN (n = 79), or Ornish (n = 76) diets and received weekly instruction for 2 months, then an additional 10-month follow-up. Weight loss at 12 months was the primary outcome. Secondary outcomes included lipid profile (low-density lipoprotein, high-density lipoprotein, and non–high-density lipoprotein cholesterol, and triglyceride levels), percentage of body fat, waist-hip ratio, fasting insulin and glucose levels, and blood pressure. Outcomes were assessed at months 0, 2, 6, and 12. The participants all had trouble adhering to their regimens, but all lost about the same statistically significant amounts of weight, and when compared head to head, the Atkins dieters saw greater improvements in blood pressure and HDL cholesterol than the Ornish dieters did.

Results 8: Weight loss was greater for women in the Atkins diet group compared with the other diet groups at 12 months, and mean 12-month weight loss was significantly different between the Atkins and Zone diets. Mean 12-month weight loss was as follows:

  • Atkins, −4.7 kg ( −6.3 to −3.1 kg),
  • Zone, −1.6 kg (−2.8 to −0.4 kg),
  • LEARN, −2.6 kg (−3.8 to −1.3 kg), and
  • Ornish, −2.2 kg (−3.6 to −0.8 kg).
  • Weight loss was not statistically different among the Zone, LEARN, and Ornish groups.
  • At 12 months, secondary outcomes for the Atkins group were comparable with or more favorable than the other diet groups.

Conclusions  8: In this study, premenopausal overweight and obese women assigned to follow the Atkins diet, which had the lowest carbohydrate intake, lost more weight and experienced more favorable overall metabolic effects at 12 months than women assigned to follow the Zone, Ornish, or LEARN diets. Average weight loss across all four groups ranged from 3.5 to 10.4 pounds. The authors note that “even modest reductions in excess weight have clinically significant effects on risk factors such as triglycerides and blood pressure.” While questions remain about long-term effects and mechanisms, a low-carbohydrate, high-protein, high-fat diet may be considered a feasible alternative recommendation for weight loss.

In another study published in the Journal of American Medical Association 9, where a total of 160 participants were randomly assigned to either Atkins (carbohydrate restriction), Zone , Weight Watchers (calorie restriction), or Ornish (fat restriction) diet groups. After 12 months of maximum effort, the mean weight loss 9 for all 4 diets resulted in modest statistically significant weight loss, with no statistically significant differences between diets. In each diet group, approximately 25% of the initial participants sustained a 1-year weight loss of more than 5% of initial body weight and approximately 10% of participants lost more than 10% of body weight. Weight reductions were highly associated with waist size reductions for all diets, with no significant difference between diets. In women, mean body weight decreased by 5.1 kg (2.5% change from baseline) and waist size by 4.5 cm, whereas in men body weight decreased by 6.4 kg (3.1% change from baseline) and waist size by 3.1 (5.8) cm at 1 year. Participants on the Atkins Diet which had the lowest carbohydrate intake, lost more weight at 12 months than participants assigned to follow the Zone diet, and had experienced comparable or more favorable metabolic effects than those assigned to the Zone, Weight Watchers or Ornish  diets.

Each diet 9 significantly reduced the low-density lipoprotein/high-density lipoprotein (HDL) cholesterol ratio by approximately 10%, with no significant effects on blood pressure or glucose at 1 year. Each popular diet modestly reduced body weight and several cardiac risk factors at 1 year. The participants all had trouble adhering to their regimens, although increased adherence was associated with greater weight loss and cardiac risk factor reductions for each diet group. While questions remain about long-term effects and mechanisms, a low-carbohydrate, high-protein, high-fat diet may be considered a feasible alternative recommendation for weight loss.

Conclusion

There is currently no specific research to prove that eating a certain ratio of protein, carbs, and fats (food proportioning) or certain food combination is going to rev up your metabolism and increase weight loss 10. But it is a proven fact that eating a calorie-restricted diet, like the one such as The Zone Diet, can help you lose weight.

You are likely to do best in The Zone if you love to pick out and prepare fresh vegetables and lean protein. But it will be a struggle if you love your white flour carbs and sweets. And it may be tough to stay in The Zone if you prefer to eat out a lot.

References
  1. ZonePerfect Nutrition Program (2004) http://www.zoneperfect.com/site/content/guide_02_ZoneDiet.asp
  2. Sears B. “The Zone.” New York Harper Collins, 1995
  3. J Am Coll Nutr. 2003 Feb;22(1):9-17. The Zone Diet phenomenon: a closer look at the science behind the claims. https://www.ncbi.nlm.nih.gov/pubmed/12569110
  4. D.J.A. Jenkins, D.M. Thomas, S. Wolever, et al. Glycemic index of food: a physiological basis for carbohydrate exchange. Am J Clin Nutr, 34 (1981), pp. 362-366
  5. D.J.A. Jenkins, C.W.C. Kendall, L.S.A. Augustin, et al. Glycemic index: overview of implications in health and disease. Am J Clin Nutr, 76 (2002), pp. 266S-273S
  6. K. Foster-Powell, S.H.A. Holt, J.C. Brand-Miller. International table of glycemic index and glycemic load values: 2002. Am J Clin Nutr, 76 (2002), pp. 5-56
  7. P.J. Lefebvre, A.J. Scheen. The postprandial state and risk of cardiovascular disease. Diabet Med, 15 (1998), pp. S63-S68
  8. JAMA. 2007 Mar 7;297(9):969-77. Comparison of the Atkins, Zone, Ornish, and LEARN diets for change in weight and related risk factors among overweight premenopausal women: the A TO Z Weight Loss Study: a randomized trial. https://www.ncbi.nlm.nih.gov/pubmed/17341711
  9. Dansinger ML, Gleason JA, Griffith JL, Selker HP, Schaefer EJ. Comparison of the Atkins, Ornish, Weight Watchers, and Zone diets for weight loss and heart disease risk reduction: a randomized trial. JAMA. 2005;293:43-53. http://jamanetwork.com/journals/jama/fullarticle/200094
  10. Annual Review of Public Health Vol. 26:61-88 (Volume publication date 21 April 2005). COMPETING DIETARY CLAIMS FOR WEIGHT LOSS: Finding the Forest Through Truculent Trees. https://doi.org/10.1146/annurev.publhealth.26.021304.144415
read more
Diet PlanDiet, Food & Fitness

Is Alkaline Diet The Secret To Weight Loss ?

alkaline diet

What is Alkaline Diet

Much has been written in the lay literature as well as many online sites expounding on the benefits of the alkaline diet. This post is an attempt to balance the evidence that is found in the scientific literature.

Life on earth depends on appropriate pH levels in and around living organisms and cells. Human life requires a tightly controlled pH level in the serum of about 7.4 (a slightly alkaline range of 7.35 to 7.45) to survive 1. The ‘acidity’ of human blood is highly stable (pH = 7.35–7.45) in healthy individuals and cancer patients 2. The pH is a number that shows how acidic or alkaline a substance is. A pH of less than 7 is acidic, and greater than 7 is alkaline. The pH of blood is about 7.4. Acidosis also called acidemia is a condition in which there is a shift in the acid-base balance of your body to have more acid than normal, often causing the pH of your blood and body tissues to fall below pH 7.35 (the healthy normal range of pH is between 7.35-7.45, with the average at 7.40). Acidosis occurs when acid builds up or when bicarbonate [HCO3] (a base) is lost.

Acidosis can be due to increased acid or decreased base:

  • Increased acid production within the body
  • Consumption of substances that are metabolized to acids
  • Decreased acid excretion
  • Increased excretion of base

Acidosis may also be caused by decreased carbon dioxide (CO2) elimination in respiratory disorders such as emphysema, by metabolic problems such as kidney disease and diabetes, or as the result of ingesting poisons (ethlylene glycol, methanol) or overdosing on certain medication (salicylates); it can also be caused by losing bicarbonate (HCO3), as in diarrhea.

Alkaline diet refers to the idea that as foods are digested and metabolized, they create a more alkaline environment in the body 3, 4. For example, animal protein is a major source of sulphur-containing amino acids that create a higher acid load in the body. The amount of acids released is related to the type of amino acids they contain. In fact, amino acids can be divided into neutral (alanine, phenylalanine, glycine, isoleucine, leucine, methionine, proline, tryptophan, valine, asparagine, glutamine, serine, threonine, cysteine, and tyrosine), acidic (aspartate and glutamate), and alkaline (arginine, histidine, and lysine). Specifically, lysine, arginine, and histidine form hydrochloric acid, while cysteine and methionine are converted to sulfuric acid 5. Moreover, foods containing phosphorus, both of natural origin or from food additives, further increase the acid load introduced with the diet 6. On the other hand, vegetables and fruits are major sources of certain minerals, especially potassium, after being metabolized, produce alkali species that are able to neutralize acids 7.

The proponents of alkaline diet believe that an acidic environment promotes ill health whereas an alkaline environment is beneficial and promotes good health, based on the “acid–ash” hypothesis developed over 100 years ago 8, 9. The acid–ash hypothesis suggests that to achieve a more alkaline load, you must consume more fruit and vegetables with only a moderate intake of protein. The diet also calls for avoiding added sugars. They claimed that the food you eat can affect your body’s pH and that as your blood that is naturally alkaline (pH 7.4) is being upset by eating acid foods. By trying to change your blood pH to be more alkaline through eating mostly alkaline foods, followers of alkaline diet believe that they can cure disease, including cancer. Proponents of the Alkaline Diet say that when you load up on excess amounts of protein, sugar, caffeine and other highly processed foods, your pH levels are thrown off track, your bodies become more acidic, and that can lead to weight gain and disease. The remedy, they say? Eat fresh vegetables, fresh fruit and other “alkaline-promoting foods” such as soy products, legumes, and certain nuts and grains. “Acid-promoting foods”, which include meat, fish, poultry, dairy products, processed foods, white sugar, white flour, and caffeine, are discouraged. Because alkaline promoting foods has a higher pH level than does acid promoting foods, proponents of the alkaline diet say that it can neutralize acid in your bloodstream, boost your metabolism and help your body absorb nutrients more effectively. Some even say that alkaline promoting foods can help prevent disease and slow the aging process. Researchers haven’t verified these claims. Despite this, many of those following an alkaline diet insist on testing the pH of their urine multiple times per day to make sure that their bodies aren’t too acidic. Moreover, marketers of alkaline diet imply that the diet changes will raise your blood pH, but a well-conducted randomized trial of alkaline diet changes altered only your blood pH by 0.014 units, while the urine pH increased by 1.02 units 10. Another study reported that high fruit and vegetable consumption and low meat intake could significantly alkalinize the urine pH in healthy men and women of ages up to 79 years 11. While diet and other metabolic processes can affect the pH level of your urine, what you eat does not determine your blood’s pH level. And the pH of your urine has no effect on weight loss and no correlation with the risk of cancer or inflammation-related medical conditions.

The alkaline diet proponent suggests that eating an alkaline diet can create a hostile alkaline environment and therefore kill cancer. Interest in an alkaline diet mostly stems from laboratory studies suggesting that cancerous tumor cells have an acidic environment  (pH ~6.5) surrounding them, which promotes the invasiveness of the cancer cells (e.g., by activating proteolytic enzymes and digesting their surroundings) whilst inhibiting the growth of the normal host cells 12, 13, 14. However, neither cancer cells nor healthy cells can survive in an alkaline environment. Scientists are investigating whether this acidic environment promotes cancer development or enhances metastasis 15.

Your blood pH (7.4) is tightly regulated by your kidneys and respiratory system. Any excess acid is excreted in the urine. Your blood pH is not altered by your dietary intake. The only situation in which blood pH is altered is during metabolic acidosis, when an individual is critically ill. Furthermore, there is no scientific literature establishing the benefit of an alkaline diet for the prevention of cancer at this time 16. A 2016 systematic review of studies on alkaline diet and cancer found that an alkaline diet could change the pH of urine to be more alkaline, but not that of the whole body 16. The body regulates the pH of blood through several internal processes. Food does not affect it. This systematic review of the literature revealed a lack of evidence for or against diet acid load and/or alkaline water for the initiation or treatment of cancer 16. Promotion of alkaline diet and alkaline water to the public for cancer prevention or treatment is not justified 16. Additionally, a review of the body of evidence regarding the acid–ash or alkaline hypothesis for bone health found that the hypothesis is not supported and there is no evidence that altering the diet acid load improves bone health 17.

Since the 2016 review 16, a 2019 observational study 18 found that diets categorized as more acid-producing were associated with increased risk, and alkaline diets were associated with decreased risk, of estrogen receptor-negative (ER-) and triple-negative breast cancers. Another observational study 19 found that scores suggesting a more acidic diet were linked with increased markers of inflammation and poorer outcomes among some early-stage breast cancer survivors. Diet scores associated with blood and urine pH are derived from calculations based on total animal protein consumption and levels of one or a few minerals.

Current scientific evidence points to the benefits of alkaline diet for people with chronic kidney disease 20, 21, 22, 5. Many studies have shown that a diet high in acid load is associated with an increased incidence of chronic kidney disease (CKD), CKD progression 23, 24, 25 and diabetes 26. Chronic kidney disease (CKD) means that your kidneys are damaged and can’t filter blood as they should. This damage can cause toxin and wastes to build up in your body 27. Chronic kidney disease (CKD) can also cause other problems that can harm your health 5. Chronic kidney disease (CKD) common complications include hyperkalemia, metabolic acidosis, calcium-phosphorus metabolism impairment, water and sodium metabolism alterations, changes in the composition of the gut microbiota, oxidative stress, hyperhomocysteinemia, chronic low-grade inflammation, and normocytic normochromic anemia 28, 29, 30, 31, 32. Diabetes and high blood pressure are the most common causes of chronic kidney disease (CKD). If left unchecked, chronic kidney disease (CKD) can evolve into end-stage renal disease (ESRD). At this stage, the kidneys are no longer able to remove enough wastes and excess fluids from the body. At this point, you would need dialysis or a kidney transplant.

In summary, eating a diet with plenty of fruits and vegetables – which is what some people mean when referring to an alkaline diet –  gives many health benefits and can help maintain a healthy weight. A study from more than 100,000 people starting in the mid-1980s until 2014 found that eating an average of five servings of fruits and vegetables a day is linked to a reduced risk of death from heart and respiratory diseases. Eating more fruit is also associated with a lower risk of cancer. Most types of fruits and vegetables led to these results, except fruit juices and starchy vegetables such as peas, corn, and potatoes. Try to eat about 3 to 5 servings every day. Fruit is also a good source of fiber, vitamins, and minerals. You should try to eat about 2 to 3 servings of fruit each day. However, the average American adult only eats about one serving of fruit and 1.5 servings of vegetables a day.

The Role of pH in Various Cells, Organs, and Membranes

The pH in our body may vary considerably from one area to another with the highest acidity in the stomach (pH of 1.35 to 3.5) to aid in digestion and protect against opportunistic microbial organisms. But even in the stomach, the layer just outside the epithelium is quite basic to prevent mucosal injury.

The skin is quite acidic (pH 4–6.5) to provide an acid mantle as a protective barrier to the environment against microbial overgrowth. There is a gradient from the outer horny layer (pH 4) to the basal layer (pH 6.9). This is also seen in the vagina where a pH of less than 4.7 protects against microbial overgrowth.

The urine may have a variable pH from acid to alkaline depending on the need for balancing the internal environment. Foods can be categorized by the potential renal acid loads.

  • Fruits, vegetables, fruit juices, potatoes, and alkali-rich and low phosphorus beverages (red and white wine, mineral soda waters) having a negative acid load.
  • Whereas, grain products, meats, dairy products, fish, and alkali poor and low phosphorus beverages (e.g., pale beers, cocoa) have relatively high acid loads.

alkaline diet foods

How your body maintains a healthy and stable blood pH

The pH of blood is about 7.4 (a slightly alkaline range of 7.35 to 7.45). Your blood pH is highly stable within a normal range of pH 7.35 to 7.45 and it’s tightly regulated by your kidneys and respiratory system. The primary pH buffering system in the human body is the bicarbonate (HCO3) and carbon dioxide (CO2). Bicarbonate (HCO3) functions as an alkalotic substance. Carbon dioxide (CO2) functions as an acidic substance. Therefore, an increase in serum bicarbonate (HCO3) or a decrease in CO2 (carbon dioxide) will make blood more alkaline. The opposite is also true where decreases in bicarbonate (HCO3) or an increase in carbon dioxide (CO2) will make blood more acidic. Acidosis also called acidemia is a condition in which there is a shift in the acid-base balance of your body to have more acid than normal, often causing the pH of your blood and body tissues to fall below pH 7.35 (the healthy normal range of pH is between 7.35-7.45, with the average at 7.40). Acidosis occurs when acid builds up or when bicarbonate [HCO3] (a base) is lost. The carbon dioxide (CO2) levels are physiologically regulated by the pulmonary system through respiration, whereas the serum bicarbonate (HCO3) levels are regulated through your kidneys by two mechanisms: bicarbonate [HCO3] (a base) reclamation mainly in the proximal tubule and bicarbonate [HCO3] (a base) generation predominantly in the distal nephron. Elevated pH above 7.45 and elevated plasma bicarbonate (HCO3) level above 30 meq/L characterize metabolic alkalosis. When bicarbonate (HCO3) is elevated the arterial partial pressure of carbon dioxide (PaCO2) must also be elevated to maintain pH to its normal range. Therefore with metabolic alkalosis, the compensation is to decrease alveolar ventilation (hypoventilation) in order to increase the arterial partial pressure of carbon dioxide (PaCO2).

To understand acid-base buffering system, it is important to recall that pH is governed by the ratio bicarbonate [HCO3] (a base)/arterial partial pressure of carbon dioxide (PaCO2) (an acid). So long as the ratio is normal, pH will be normal.

Normal body functions and metabolism generate large quantities of acids that must be neutralized and/or eliminated to maintain blood pH balance. Most of the acid is carbonic acid (H2CO3), which is created from carbon dioxide (CO2) and water (H2O). Carbon dioxide (CO2) is produced as the body uses glucose (sugar) or fat for energy. In its normal state, the body maintains carbon dioxide (arterial partial pressure of carbon dioxide [PaCO2]) in a well-controlled range from 35 to 45 mm Hg by balancing its production and elimination. Lesser quantities of lactic acid, ketoacids, and other organic acids are also produced.

  • Carbon dioxide (CO2) + water (H2O) -> H2CO3 (carbonic acid) -> HCO3 + H+

According to the Henderson-Hasselbalch equation (Figure 1), maintaining physiological pH depends on arterial partial pressure of carbon dioxide (PaCO2), which in turn depends on alveolar ventilation (hypoventilation causes acidosis and hyperventilation causes alkalosis). The kidneys participate in maintaining the stable pH by reabsorption of bicarbonate (3,600 mmol of bicarbonate is filtrated in glomeruli during 24 hour) and excretion of hydrogen ions from nonvolatile acids (including sulfur and phosphate) as titratable acidity (0.3 mmol hydrogen ions/kg/day) and in the form of ammonium ion (0.7 mmol hydrogen ions/kg/day) 33, 34.

Serum bicarbonate (HCO3) concentration can be calculated from a blood gas sample using the Henderson-Hasselbalch equation, as follows (see Figure 1 below):

  • pH = 6.10 + log (HCO3 ÷ 0.03 × PaCO2)
  • Alternatively, bicarbonate (HCO3) = 24 × PaCO2 ÷ [H+]

Because pH and arterial partial pressure of carbon dioxide (PaCO2) are directly measured, bicarbonate (HCO3) can be calculated.

Another means of assessing serum bicarbonate (HCO3) concentration is with the total carbon dioxide content in serum, which is routinely measured with serum electrolytes obtained from venous blood. In this method, a strong acid is added to serum, which interacts with bicarbonate in the serum sample, forming carbonic acid. Carbonic acid dissociates to carbon dioxide and water; then, carbon dioxide is measured.

Note that the carbon dioxide measured includes bicarbonate and dissolved carbon dioxide. The contribution of dissolved carbon dioxide is quite small (0.03 × PaCO2) and is usually ignored, although it accounts for a difference of 1-3 mEq/L between the measured total carbon dioxide content in venous blood and the calculated bicarbonate in arterial blood. Thus, at an arterial partial pressure of carbon dioxide (PaCO2) of 40, a total carbon dioxide (CO2) content of 25 means a true bicarbonate concentration of 23.8 (ie, 25 – 0.03 × 40).

Your lungs and kidneys are the major organs involved in regulating blood pH. And to compensate for the metabolic acidosis, you increase your breathing rate (hyperventilation) to increase carbon dioxide (CO2) elimination 35, 36.

  1. The lungs flush acid out of your body by exhaling carbon dioxide (CO2). Raising and lowering the respiratory rate alters the amount of carbon dioxide (CO2) that is breathed out, and this can affect blood pH within minutes 37.
  2. The kidneys excrete acids in the urine, and they regulate the concentration of bicarbonate (HCO3, a base) in blood. Acid-base changes due to increases or decreases in bicarbonate [HCO3] concentration occur more slowly than changes in carbon dioxide (CO2), taking hours or days. Bicarbonate (HCO3) reabsorption occurs in the kidneys in every part of the tubules. About 85–90% of the filtered bicarbonate is reabsorbed in the proximal tubules, 10% in the ascending arms of the Henle loop, 6% in the distal tubules, and 4% in the collecting tubules 33, 34.

Both of these processes are always at work, and they keep the blood pH in healthy people tightly controlled. The absolute quantities of acids or bases are less important than the balance between the two and its effect on blood pH.

Buffering systems that resist changes in pH also contribute to the regulation of acid and base concentrations. The main buffers in blood are hemoglobin (in red blood cells), plasma proteins, carbon dioxide (CO2), bicarbonate (HCO3) and phosphates.

Carbon dioxide (CO2) plays a remarkable role in the human body mainly through pH regulation of the blood. The pH is the primary stimulus to initiate ventilation. In its normal state, the body maintains carbon dioxide (CO2) in a well-controlled range from 38 to 42 mm Hg by balancing its production and elimination. In a state of hypoventilation (breathing that is too shallow or too slow to meet the needs of the body), the body produces more carbon dioxide (CO2) than it can eliminate, causing a net retention of carbon dioxide (CO2). The increased carbon dioxide (CO2) is what leads to an increase in hydrogen ions (H+) and a slight increase in bicarbonate (HCO3), as seen by a right shift in the following equilibrium reaction of carbon dioxide:

  • Carbon dioxide (CO2) + water (H2O) -> H2CO3 (carbonic acid) -> HCO3 + H+

The buffer system created by carbon dioxide consists of the following three molecules in equilibrium: carbon dioxide (CO2), H2CO3 (carbonic acid), and bicarbonate (HCO3). When hydrogen ions (H+) is high, bicarbonate (HCO3) buffers the low pH. When hydroxide (OH) is high, H2CO3 (carbonic acid) buffers the high pH. In respiratory acidosis, the slight increase in bicarbonate  (HCO3) serves as a buffer for the increase in hydrogen ions (H+), which helps minimize the drop in pH. The increase in hydrogen ions inevitably causes the decrease in pH, which is the mechanism behind metabolic acidosis.

Figure 1. Henderson-Hasselbalch equation

Henderson-Hasselbalch equation

[Source 38 ]

Figure 2. Acid-base buffering system

acid-base compensation

Figure 3. Kidneys control of plasma bicarbonate (HCO3)

Kidneys control of plasma bicarbonate

Abbreviations: CCD = cortical collecting duct; IMCD = inner medullary collecting duct

[Source 34 ]

Respiration

The pulmonary system adjusts pH using carbon dioxide (CO2); upon expiration, carbon dioxide (CO2) is projected into the environment. Due to carbon dioxide (CO2) forming carbon dioxide (CO2) in the body when combining with water (H2O), the amount of carbon dioxide (CO2) expired can cause pH to increase or decrease. When the respiratory system is utilized to compensate for metabolic pH disturbances, the effect occurs in minutes to hours 39.

Renal adaptation

The renal system affects pH by reabsorbing bicarbonate (HCO3) and excreting fixed acids 39, 40. Whether due to pathology or necessary compensation, the kidney excretes or reabsorbs these substances which affect pH. The nephron is the functional unit of the kidney. Blood vessels called glomeruli transport substances found in the blood to the renal tubules so that some can be filtered out while others are reabsorbed into the blood and recycled. This is true for hydrogen ions and bicarbonate. If bicarbonate (HCO3) is reabsorbed and/or acid is secreted into the urine, the pH becomes more alkaline (pH increases). When bicarbonate (HCO3) is not reabsorbed or acid is not excreted into the urine, pH becomes more acidic (pH decreases). The metabolic compensation from the renal system takes longer to occur, days rather than minutes or hours.

The renal adaptations are extensive 41:

  • Increased urinary excretion of sulfate, phosphate, urate, and chloride;
  • Increased urinary excretion of calcium;
  • Decreased urinary excretion of citrate;
  • Increased urinary excretion of ammonium ions; and
  • Kidney vasodilatation and increased glomerular filtration rate.

The kidneys mitigate but do not eliminate all the excess acidity. As the kidneys lose function with aging (when GFR is lower than 30 mL/min/1.73 m²), their ability to excrete acid becomes impaired, which may be another explanation for the loss of bone with aging 42. In fact, counteracting metabolic acidosis helps to preserve muscle mass and to improve bone metabolism 43, 44, 45.

Bone for acid buffering

The major reservoir of base is the skeleton (in the form of alkaline salts of calcium), which provides the buffer needed to maintain blood pH and plasma bicarbonate concentrations when renal and respiratory adaptations are inadequate. Acid-promoting diets are associated with increased urinary excretion of both calcium and bone matrix protein and decreased bone density 46. Neutralizing acid intake with diet or alkalinizing supplements decreases urine Calcium and bone matrix protein excretion. Also, to a much smaller degree, skeletal muscle can act as a buffer.

Other buffer systems

Other buffer systems in the human body include the phosphate buffer system, proteins, and hemoglobin. All of these contain bases which accept hydrogen ions which keep the pH from plummeting. The phosphate buffer system, while present globally, is important for the regulation of urine pH. Proteins assist with intracellular pH regulation. Red blood cells use the reaction above to help hemoglobin buffer; carbon dioxide can diffuse across red blood cells and combine with water. This alone would cause an increase in hydrogen ions; however, hemoglobin can bind hydrogen ions. Hemoglobin also can bind carbon dioxide without this reaction. This depends on the amount of oxygen that is bound to hemoglobin. This is called the Haldane effect and the Bohr effect. When hemoglobin is saturated with oxygen, it has a lower affinity for carbon dioxide (CO2) and hydrogen ions and is able to release i

The Alkaline Diet: Is There Evidence That an Alkaline pH Diet Benefits Health?

There is some good news for fans of alkaline eating. The Alkaline Diet is a plant-based and discourages added sugar, so it may help your weight and health, although not because of the pH. People who eat balanced, plant-based diets tend to have lower risks of chronic diseases like high blood pressure and diabetes. There is also research indicating that vegetarian diets may lead to lower risk for some types of cancer. However it is not clear yet if these lower cancer rates are due to diet alone, or other lifestyle factors that often go in tandem with plant-based diets (like not smoking).

As for weight, a diet rich in whole grains and fruits and veggies, and low in processed foods may be a good way to get or stay slim, however you’ll still need to pay attention to portion sizes, total calorie intake and exercise regularly.

  • Chronic Acidosis and Bone Disease

There is online information promoting an alkaline diet for bone health as well as a number of books. However, a recent systematic review of the literature looking for evidence supporting the alkaline diet for bone health found no protective role of dietary acid load in osteoporosis  47.

There is evidence that in healthy humans the increased sodium in the diet can predict the degree of hyperchloremic metabolic acidosis when consuming a net acid producing diet 48. As well, there is evidence that there are adverse effects of sodium chloride in the aging population. A high sodium diet will exacerbate disuse-induced bone and muscle loss during immobilization by increasing bone resorption and protein wasting 49. Excess dietary sodium has been shown to result in hypertension and osteoporosis in women 50, 51. As well, dietary potassium which is lacking in the modern diet would modulate pressor and hypercalciuric effects of excess of sodium chloride 52.

Excess dietary protein with high acid renal load may decrease bone density if not buffered by ingestion of supplements or foods that are alkali rich 53. However, adequate protein is necessary for prevention of osteoporosis and sarcopenia; therefore, increasing the amount of fruit and vegetables may be necessary rather than reducing protein 54.

  • Alkaline Diets and Muscle

As we age, there is a loss of muscle mass, which may predispose to falls and fractures. A three-year study looking at a diet rich in potassium, such as fruits and vegetables, as well as a reduced acid load, resulted in preservation of muscle mass in older men and women 55. Conditions such as chronic renal failure that result in chronic metabolic acidosis result in accelerated breakdown in skeletal muscle 56. Correction of acidosis may preserve muscle mass in conditions where muscle wasting is common such as diabetic ketosis, trauma, sepsis, chronic obstructive lung disease, and renal failure 57. In situations that result in acute acidosis, supplementing younger patients with sodium bicarbonate prior to exhaustive exercise resulted in significantly less acidosis in the blood than those that were not supplemented with sodium bicarbonate 58.

  • Alkaline Supplementation and Growth Hormone

It has long been known that severe forms of metabolic acidosis in children, such as renal tubular acidosis, are associated with low levels of growth hormone with resultant short stature. Correction of the acidosis with bicarbonate 59 or potassium citrate 60 increases growth hormone significantly and improved growth. The use of enough potassium bicarbonate in the diet to neutralize the daily net acid load in postmenopausal women resulted in a significant increase in growth hormone and resultant osteocalcin 61. Improving growth hormone levels may improve quality of life, reduce cardiovascular risk factors, improve body composition, and even improve memory and cognition  62. As well this results in a reduction of urinary calcium loss equivalent to 5% of bone calcium content over a period of 3 years 63.

  • Alkaline Diet and Back Pain

There is some evidence that chronic low back pain improves with the supplementation of alkaline minerals 64. With supplementation there was a slight but significant increase in blood pH and intracellular magnesium. Ensuring that there is enough intracellular magnesium allows for the proper function of enzyme systems and also allows for activation of vitamin D 65. This in turn has been shown to improve back pain 66.

  • Alkalinity and Chemotherapy

The effectiveness of chemotherapeutic agents is markedly influenced by pH. Numerous agents such as epirubicin and adriamycin require an alkaline media to be more effective. Others, such as cisplatin, mitomycin C, and thiotepa, are more cytotoxic in an acid media 67. Cell death correlates with acidosis and intracellular pH shifts higher (more alkaline) after chemotherapy may reflect response to chemotherapy 68. It has been suggested that inducing metabolic alkalosis may be useful in enhancing some treatment regimes by using sodium bicarbonate, carbicab, and furosemide 69. Extracellular alkalinization by using bicarbonate may result in improvements in therapeutic effectiveness 70. There is no scientific literature establishing the benefit of an alkaline diet for the prevention of cancer at this time.

Conclusion

Alkaline diets result in a more alkaline urine pH and may result in reduced calcium in the urine, however, as seen in some recent reports, this may not reflect total calcium balance because of other buffers such as phosphate. There is no substantial evidence that this improves bone health or protects from osteoporosis.

Alkaline diets may result in a number of health benefits as outlined below 71:

  • Increased fruits and vegetables in an alkaline diet would improve the K/Na ratio and may benefit bone health, reduce muscle wasting, as well as mitigate other chronic diseases such as hypertension and strokes. There is some evidence that the K/Na ratio does matter and that the significant amount of salt in our diet is detrimental.
  • The resultant increase in growth hormone with an alkaline diet may improve many outcomes from cardiovascular health to memory and cognition.
  • An increase in intracellular magnesium, which is required for the function of many enzyme systems, is another added benefit of the alkaline diet. Available magnesium, which is required to activate vitamin D, would result in numerous added benefits in the vitamin D apocrine/exocrine systems.
  • Alkalinity may result in added benefit for some chemotherapeutic agents that require a higher pH.

From the evidence outlined above, it would be prudent to consider an alkaline diet to reduce morbidity and mortality of chronic disease that are plaguing our aging population. One of the first considerations in an alkaline diet, which includes more fruits and vegetables, is to know what type of soil they were grown in since this may significantly influence the mineral content. At this time, there are limited scientific studies in this area, and many more studies are indicated in regards to muscle effects, growth hormone, and interaction with vitamin D.

References
  1. Schwalfenberg GK. The alkaline diet: is there evidence that an alkaline pH diet benefits health? J Environ Public Health. 2012;2012:727630. doi: 10.1155/2012/727630
  2. Ali M., Alam S.P., Kumar S., Anupam Kumar R., Kumar A. Does blood pH change in cancer patients. Int. J. Curr. Res. 2016;8:29543–29544.
  3. Remer T., Manz F. Estimation of the renal net acid excretion by adults consuming diets containing variable amounts of protein. Am. J. Clin. Nutr. 1994;59:1356–1361. doi: 10.1093/ajcn/59.6.1356
  4. Anthony Sebastian, Lynda A Frassetto, Deborah E Sellmeyer, Renée L Merriam, R Curtis Morris, Jr, Estimation of the net acid load of the diet of ancestral preagricultural Homo sapiens and their hominid ancestors, The American Journal of Clinical Nutrition, Volume 76, Issue 6, December 2002, Pages 1308–1316, https://doi.org/10.1093/ajcn/76.6.1308
  5. Noce A, Marrone G, Wilson Jones G, Di Lauro M, Pietroboni Zaitseva A, Ramadori L, Celotto R, Mitterhofer AP, Di Daniele N. Nutritional Approaches for the Management of Metabolic Acidosis in Chronic Kidney Disease. Nutrients. 2021 Jul 24;13(8):2534. doi: 10.3390/nu13082534
  6. D’Alessandro C., Piccoli G.B., Cupisti A. The “phosphorus pyramid”: A visual tool for dietary phosphate management in dialysis and CKD patients. BMC Nephrol. 2015;16:9. doi: 10.1186/1471-2369-16-9
  7. Wesson D.E., Nathan T., Rose T., Simoni J., Tran R.M. Dietary protein induces endothelin-mediated kidney injury through enhanced intrinsic acid production. Kidney Int. 2007;71:210–217. doi: 10.1038/sj.ki.5002036
  8. Sherman H, Gettler A. The balance of acid-forming and base-forming elements in foods, and its relation to ammonia metabolism. J Biol Chem 1912;11:323–38.
  9. Dwyer J, Foulkes E, Evans M, Ausman L. Acid/alkaline ash diets: time for assessment and change. J Am Diet Assoc. 1985 Jul;85(7):841-5.
  10. Buclin T, Cosma M, Appenzeller M et al.. Diet acids and alkalis influence calcium retention in bone. Osteoporos Int 2001;12:493–9. 10.1007/s001980170095
  11. Welch A.A., Mulligan A., Bingham S.A., Khaw K.-T. Urine pH is an indicator of dietary acid–base load, fruit and vegetables and meat intakes: Results from the European Prospective Investigation into Cancer and Nutrition (EPIC)-Norfolk population study. Br. J. Nutr. 2008;99:1335–1343. doi: 10.1017/S0007114507862350
  12. Kato Y., Ozawa S., Miyamoto C., Maehata Y., Suzuki A., Maeda T., Baba Y. Acidic extracellular microenvironment and cancer. Cancer Cell Int. 2013;13:89. doi: 10.1186/1475-2867-13-89
  13. Lee S.-H., McIntyre D., Honess D., Hulikova A., Pacheco-Torres J., Cerdán S., Swietach P., Harris A.L., Griffiths J.R. Carbonic anhydrase IX is a pH-stat that sets an acidic tumour extracellular pH in vivo. Br. J. Cancer. 2018;119:622–630. doi: 10.1038/s41416-018-0216-5
  14. Pilon-Thomas S., Kodumudi K.N., El-Kenawi A.E., Russell S., Weber A.M., Luddy K., Damaghi M., Wojtkowiak J.W., Mulé J.J., Ibrahim-Hashim A., et al. Neutralization of Tumor Acidity Improves Antitumor Responses to Immunotherapy. Cancer Res. 2015;76:1381–1390. doi: 10.1158/0008-5472.CAN-15-1743
  15. Fais S, Marunaka Y. The Acidic Microenvironment: Is It a Phenotype of All Cancers? A Focus on Multiple Myeloma and Some Analogies with Diabetes Mellitus. Cancers (Basel). 2020 Nov 2;12(11):3226. doi: 10.3390/cancers12113226
  16. Fenton TR, Huang T. Systematic review of the association between dietary acid load, alkaline water and cancer. BMJ Open. 2016 Jun 13;6(6):e010438. doi: 10.1136/bmjopen-2015-010438
  17. Fenton TR, Tough SC, Lyon AW et al.. Causal assessment of dietary acid load and bone disease: a systematic review & meta-analysis applying Hill’s epidemiologic criteria for causality. Nutr J 2011;10:41 10.1186/1475-2891-10-41
  18. Park YM, Steck SE, Fung TT, Merchant AT, Elizabeth Hodgson M, Keller JA, Sandler DP. Higher diet-dependent acid load is associated with risk of breast cancer: Findings from the sister study. Int J Cancer. 2019 Apr 15;144(8):1834-1843. doi: 10.1002/ijc.31889
  19. Wu T, Seaver P, Lemus H, Hollenbach K, Wang E, Pierce JP. Associations between Dietary Acid Load and Biomarkers of Inflammation and Hyperglycemia in Breast Cancer Survivors. Nutrients. 2019 Aug 15;11(8):1913. doi: 10.3390/nu11081913
  20. Passey C. Reducing the dietary acid load: How a more alkaline diet benefits patients with chronic kidney disease. J. Ren. Nutr. 2017;27:151–160. doi: 10.1053/j.jrn.2016.11.006
  21. Yari Z, Mirmiran P. Alkaline Diet: a Novel Nutritional Strategy in Chronic Kidney Disease? Iran J Kidney Dis. 2018 Jul;12(4):204-208. http://www.ijkd.org/index.php/ijkd/article/view/3576/1012
  22. Rodrigues Neto Angéloco L, Arces de Souza GC, Almeida Romão E, Garcia Chiarello P. Alkaline Diet and Metabolic Acidosis: Practical Approaches to the Nutritional Management of Chronic Kidney Disease. J Ren Nutr. 2018 May;28(3):215-220. doi: 10.1053/j.jrn.2017.10.006
  23. Ko B.J., Chang Y., Ryu S., Kim E.M., Lee M.Y., Hyun Y.Y., Lee K.B. Dietary acid load and chronic kidney disease in elderly adults: Protein and potassium intake. PLoS ONE. 2017;12:e0185069. doi: 10.1371/journal.pone.0185069
  24. Rebholz C.M., Coresh J., Grams M.E., Steffen L.M., Anderson C.A., Appel L.J., Crews D.C. Dietary Acid Load and Incident Chronic Kidney Disease: Results from the ARIC Study. Am. J. Nephrol. 2015;42:427–435. doi: 10.1159/000443746
  25. Banerjee T., Crews D.C., Wesson D.E., Tilea A., Saran R., Rios Burrows N., Williams D.E., Powe N.R. Dietary acid load and chronic kidney disease among adults in the United States. BMC Nephrol. 2014;15:137. doi: 10.1186/1471-2369-15-137
  26. Fagherazzi G., Vilier A., Bonnet F., Lajous M., Balkau B., Boutron-Rualt M.C., Clavel-Chapelon F. Dietary acid load and risk of type 2 diabetes: The E3N-EPIC cohort study. Diabetologia. 2014;57:313–320. doi: 10.1007/s00125-013-3100-0
  27. Cupisti A., Gallieni M., Avesani C.M., D’Alessandro C., Carrero J.J., Piccoli G.B. Medical nutritional therapy for patients with chronic kidney disease not on dialysis: The low protein diet as a medication. J. Clin. Med. 2020;9:3644. doi: 10.3390/jcm9113644
  28. Chen T.K., Knicely D.H., Grams M.E. Chronic kidney disease diagnosis and management: A review. JAMA. 2019;322:1294–1304. doi: 10.1001/jama.2019.14745
  29. Noce A., Canale M.P., Capria A., Rovella V., Tesauro M., Splendiani G., Annicchiarico-Petruzzelli M., Manzuoli M., Simonetti G., Di Daniele N. Coronary artery calcifications predict long term cardiovascular events in non diabetic Caucasian hemodialysis patients. Aging. 2015;7:269–279. doi: 10.18632/aging.100740
  30. Noce A., Marrone G., Di Lauro M., Urciuoli S., Pietroboni Zaitseva A., Wilson Jones G., Di Daniele N., Romani A. Cardiovascular protection of nephropathic male patients by oral food supplements. Cardiovasc. Ther. 2020;2020:1807941. doi: 10.1155/2020/1807941
  31. Annalisa N., Alessio T., Claudette T.D., Erald V., Antonino de L., Nicola D.D. Gut microbioma population: An indicator really sensible to any change in age, diet, metabolic syndrome, and life-style. Mediat. Inflamm. 2014;2014:901308. doi: 10.1155/2014/901308
  32. Dessi M., Noce A., Dawood K.F., Galli F., Taccone-Gallucci M., Fabrini R., Bocedi A., Massoud R., Fucci G., Pastore A., et al. Erythrocyte glutathione transferase: A potential new biomarker in chronic kidney diseases which correlates with plasma homocysteine. Amino Acids. 2012;43:347–354. doi: 10.1007/s00726-011-1085-x
  33. Koeppen BM. The kidney and acid-base regulation. Adv Physiol Educ. 2009 Dec;33(4):275-81. doi: 10.1152/advan.00054.2009
  34. Hamm LL, Nakhoul N, Hering-Smith KS. Acid-Base Homeostasis. Clin J Am Soc Nephrol. 2015 Dec 7;10(12):2232-42. doi: 10.2215/CJN.07400715
  35. Kisaka T, Cox TA, Dumitrescu D, Wasserman K. CO2 pulse and acid-base status during increasing work rate exercise in health and disease. Respir Physiol Neurobiol. 2015 Nov;218:46-56. doi: 10.1016/j.resp.2015.07.005
  36. Brinkman JE, Toro F, Sharma S. Physiology, Respiratory Drive. [Updated 2022 Jun 8]. In: StatPearls [Internet]. Treasure Island (FL): StatPearls Publishing; 2022 Jan-. Available from: https://www.ncbi.nlm.nih.gov/books/NBK482414
  37. Brinkman JE, Sharma S. Respiratory Alkalosis. [Updated 2022 Jul 25]. In: StatPearls [Internet]. Treasure Island (FL): StatPearls Publishing; 2022 Jan-. Available from: https://www.ncbi.nlm.nih.gov/books/NBK482117
  38. Adamczak M, Surma S. Metabolic Acidosis in Patients with CKD: Epidemiology, Pathogenesis, and Treatment. Kidney Dis (Basel). 2021 Jun 4;7(6):452-467. doi: 10.1159/000516371
  39. Hopkins E, Sharma S. Physiology, Acid Base Balance. [Updated 2018 Oct 27]. In: StatPearls [Internet]. Treasure Island (FL): StatPearls Publishing; 2018 Jan-. Available from: https://www.ncbi.nlm.nih.gov/books/NBK507807
  40. Wesson DE, Nathan T, Rose T, Simoni J, Tran RM. Dietary protein induces endothelin-mediated kidney injury through enhanced intrinsic acid production. Kidney Int. 2007 Feb;71(3):210-7. doi: 10.1038/sj.ki.5002036
  41. Acidosis: An Old Idea Validated by New Research. Integr Med (Encinitas). 2015;14(1):8-12. https://www.ncbi.nlm.nih.gov/pmc/articles/PMC4566456/
  42. Frassetto LA, Morris RC, Jr, Sebastian A. Effect of age on blood acid-base composition in adult humans: role of age-related renal functional decline. Am J Physiol. 1996;271(6 Pt 2):F1114–F1122
  43. Kopple J.D., Kalantar-Zadeh K., Mehrotra R. Risks of chronic metabolic acidosis in patients with chronic kidney disease. Kidney Int. 2005;67:S21–S27. doi: 10.1111/j.1523-1755.2005.09503.x
  44. Dubey A.K., Sahoo J., Vairappan B., Haridasan S., Parameswaran S., Priyamvada P.S. Correction of metabolic acidosis improves muscle mass and renal function in chronic kidney disease stages 3 and 4: A randomized controlled trial. Nephrol. Dial. Transplant. 2020;35:121–129. doi: 10.1093/ndt/gfy214
  45. Noce A., Marrone G., Ottaviani E., Guerriero C., Di Daniele F., Pietroboni Zaitseva A., Di Daniele N. Uremic sarcopenia and its possible nutritional approach. Nutrients. 2021;13:147. doi: 10.3390/nu13010147
  46. Diet acids and alkalis influence calcium retention in bone. Buclin T, Cosma M, Appenzeller M, Jacquet AF, Décosterd LA, Biollaz J, Burckhardt P. Osteoporos Int. 2001; 12(6):493-9.
  47. Fenton TR, Tough SC, Lyon AW, Eliasziw M, Hanley DA. Causal assessment of dietary acid load and bone disease: a systematic review & meta-analysis applying Hill’s epidemiologic criteria for causality. Nutrition Journal. 2011;10(1, article 41). https://www.ncbi.nlm.nih.gov/pmc/articles/PMC3114717/
  48. Frassetto LA, Morris RC, Jr., Sebastian A. Dietary sodium chloride intake independently predicts the degree of hyperchloremic metabolic acidosis in healthy humans consuming a net acid-producing diet. American Journal of Physiology—Renal Physiology. 2007;293(2):F521–F525. https://www.ncbi.nlm.nih.gov/pubmed/17522265
  49. Frings-Meuthen P, Buehlmeier J, Baecker N, et al. High sodium chloride intake exacerbates immobilization-induced bone resorption and protein losses. Journal of Applied Physiology. 2011;111(2):537–542. https://www.ncbi.nlm.nih.gov/pubmed/21596917
  50. Cappuccio FP, Meilahn E, Zmuda JM, Cauley JA. High blood pressure and bone-mineral loss in elderly white women: a prospective study. Lancet. 1999;354(9183):971–975. https://www.ncbi.nlm.nih.gov/pubmed/10501357
  51. Devine A, Criddle RA, Dick IM, Kerr DA, Prince RL. A longitudinal study of the effect of sodium and calcium intakes on regional bone density in postmenopausal women. American Journal of Clinical Nutrition. 1995;62(4):740–745. https://www.ncbi.nlm.nih.gov/pubmed/7572702
  52. Morris RC, Jr., Schmidlin O, Frassetto LA, Sebastian A. Relationship and interaction between sodium and potassium. Journal of the American College of Nutrition. 2006;25(3):262S–270S. https://www.ncbi.nlm.nih.gov/pubmed/16772638
  53. Barzel US, Massey LK. Excess dietary protein may can adversely affect bone. Journal of Nutrition. 1998;128(6):1051–1053. https://www.ncbi.nlm.nih.gov/pubmed/9614169
  54. Heaney RP, Layman DK. Amount and type of protein influences bone health. American Journal of Clinical Nutrition. 2008;87(5):156S–157S. https://www.ncbi.nlm.nih.gov/pubmed/18469289
  55. Dawson-Hughes B, Harris SS, Ceglia L. Alkaline diets favor lean tissue mass in older adults. American Journal of Clinical Nutrition. 2008;87(3):662–665. https://www.ncbi.nlm.nih.gov/pmc/articles/PMC2597402/
  56. Garibotto G, Russo R, Sofia A, et al. Muscle protein turnover in chronic renal failure patients with metabolic acidosis or normal acid-base balance. Mineral and Electrolyte Metabolism. 1996;22(1–3):58–61. https://www.ncbi.nlm.nih.gov/pubmed/8676826
  57. Caso G, Garlick PJ. Control of muscle protein kinetics by acid-base balance. Current Opinion in Clinical Nutrition and Metabolic Care. 2005;8(1):73–76. https://www.ncbi.nlm.nih.gov/pubmed/15586003
  58. Webster MJ, Webster MN, Crawford RE, Gladden LB. Effect of sodium bicarbonate ingestion on exhaustive resistance exercise performance. Medicine and Science in Sports and Exercise. 1993;25(8):960–965. https://www.ncbi.nlm.nih.gov/pubmed/8396707
  59. Frassetto L, Morris, Jr. R.C. RC, Jr., Sellmeyer DE, Todd K, Sebastian A. Diet, evolution and aging—the pathophysiologic effects of the post-agricultural inversion of the potassium-to-sodium and base-to-chloride ratios in the human diet. European Journal of Nutrition. 2001;40(5):200–213. https://www.ncbi.nlm.nih.gov/pubmed/11842945
  60. McSherry E, Morris RC., Jr. Attainment and maintenance of normal stature with alkali therapy in infants and children with classic renal tubular acidosis. Journal of Clinical Investigation. 1978;61(2):509–527. https://www.ncbi.nlm.nih.gov/pmc/articles/PMC372562/
  61. Frassetto L, Morris RC, Jr., Sebastian A. Potassium bicarbonate reduces urinary nitrogen excretion in postmenopausal women. Journal of Clinical Endocrinology and Metabolism. 1997;82(1):254–259. https://www.ncbi.nlm.nih.gov/pubmed/8989270
  62. Wass JAH, Reddy R. Growth hormone and memory. Journal of Endocrinology. 2010;207(2):125–126. https://www.ncbi.nlm.nih.gov/pubmed/20696696
  63. Frassetto L, Morris RC, Jr., Sebastian A. Long-term persistence of the urine calcium-lowering effect of potassium bicarbonate in postmenopausal women. Journal of Clinical Endocrinology and Metabolism. 2005;90(2):831–834. https://www.ncbi.nlm.nih.gov/pubmed/15572425
  64. Vormann J, Worlitschek M, Goedecke T, Silver B. Supplementation with alkaline minerals reduces symptoms in patients with chronic low back pain. Journal of Trace Elements in Medicine and Biology. 2001;15(2-3):179–183. https://www.ncbi.nlm.nih.gov/pubmed/11787986
  65. Zofková I, Kancheva RL. The relationship between magnesium and calciotropic hormones. Magnesium Research. 1995;8(1):77–84. https://www.ncbi.nlm.nih.gov/pubmed/7669510
  66. Schwalfenberg G. Improvement of chronic back pain or failed back surgery with vitamin D repletion: a case series. Journal of the American Board of Family Medicine. 2009;22(1):69–74. https://www.ncbi.nlm.nih.gov/pubmed/19124636
  67. Groos E, Walker L, Masters JR. Intravesical chemotherapy. Studies on the relationship between pH and cytotoxicity. Cancer. 1986;58(6):1199–1203. https://www.ncbi.nlm.nih.gov/pubmed/3091241
  68. Smith SR, Martin PA, Edwards RHT. Tumour pH and response to chemotherapy: an in vivo 31P magnetic resonance spectroscopy study in non-Hodgkin’s lymphoma. British Journal of Radiology. 1991;64(766):923–928. https://www.ncbi.nlm.nih.gov/pubmed/1954534
  69. Raghunand N, Gillies RJ. pH and chemotherapy. Novartis Foundation Symposium. 2001;240:199–211. https://www.ncbi.nlm.nih.gov/pubmed/11727930
  70. Raghunand N, He X, Van Sluis R, et al. Enhancement of chemotherapy by manipulation of tumour pH. British Journal of Cancer. 1999;80(7):1005–1011. https://www.ncbi.nlm.nih.gov/pmc/articles/PMC2363059/
  71. J Environ Public Health. 2012; 2012: 727630. Published online 2011 Oct 12. doi: 10.1155/2012/727630. The Alkaline Diet: Is There Evidence That an Alkaline pH Diet Benefits Health ? – https://www.ncbi.nlm.nih.gov/pmc/articles/PMC3195546/
read more
Diet PlanDiet, Food & Fitness

Can Cabbage Soup Diet Help Me Lose Weight ?

cabbage soup diet

Cabbage

The Cabbage Soup Diet

The cabbage soup diet is generally considered a fad or crash diet. As the name suggests, the diet requires that you eat large amounts of cabbage soup for seven days. During that time, you can also eat certain fruits and vegetables, beef, chicken, and brown rice, according to a set schedule. There’s not a lot of room to tweak the diet, since it’s so rigid. Because the cabbage soup diet is low in complex carbohydrates, protein, vitamins and minerals, you shouldn’t stay on it for more than a week at a time.

It is low in fat, because you eat mostly vegetables. But it’s not vegetarian or vegan, since some meat is allowed.

Proponents of the cabbage soup diet say it’s a good way to quickly lose a few pounds. You may lose weight on the diet because it drastically limits calories. But it is not only fat that you’ll lose. Your weight lost is likely to be a combination of water and fat, and may even include muscle.

The cabbage soup diet has other disadvantages. Depending on the recipe for cabbage soup, the diet can be high in sodium. So cut back on the sodium, hold back on using the salt shaker when making the soup or cooking your food. The large amounts of cabbage also can make you more prone to flatulence.

Because you’re not getting proper nutrition, you may feel weak or tired while on the diet. And once you stop the diet, it’s easy to regain any weight that you lost.

Fad diets like this one may be tempting, but keep in mind that long-term weight loss depends on making lasting healthy changes in your eating and exercise habits.

cabbage soup diet


What You Can Eat

Just like the name says, the bulk of this diet is fat-free cabbage soup, eaten two to three times a day with other allowed foods assigned each day. Here’s what you can add:

  • Day 1: Fruit, except bananas
  • Day 2: Vegetables like leafy greens (not starchy), but no fruit
  • Day 3: Fruits and vegetables
  • Day 4: Bananas and skim milk
  • Day 5: Beef (or baked chicken without the skin) and tomatoes
  • Day 6: Beef and vegetables
  • Day 7: Brown rice, unsweetened fruit juices, and vegetables

There are different recipes for the soup, which is recommended every day of the diet. They all have similar ingredients, such as tomatoes, green peppers, mushrooms, onions, and bouillon.

Does It Work ?

Yes. You’ll lose weight, but only in the short run. This is strictly a lose-weight quick scheme. And once you stop the diet, it’s easy to regain any weight that you lost.

You’ll likely get less than 1,000 calories a day on the limited menu. That’s far fewer than the 2,000 daily calories recommended for most adults. Because you’re not getting proper nutrition, you may feel weak or tired while on the diet.

Since you’re getting so few calories, the pounds come off quickly, but mostly you’ll lose water weight. And chances are, you’ll gain it all back as soon as you start eating a normal diet again.

read more
1 2 3 4 5
Page 3 of 5
Health Jade