

How Much Sugar Do You Require Per Day ?
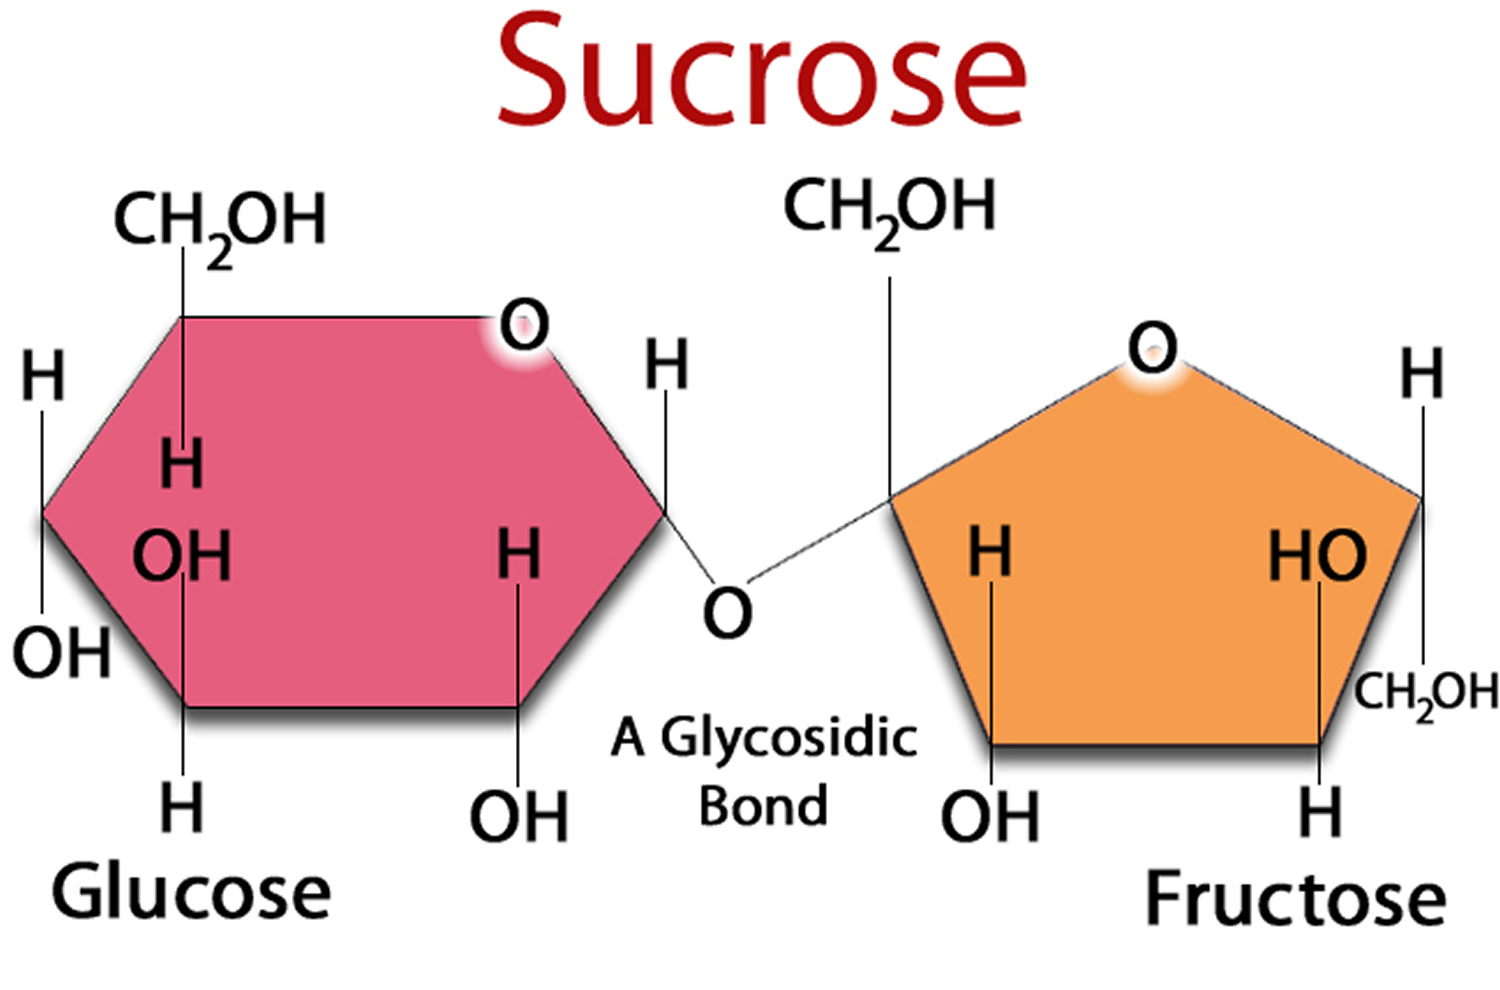
Unlike salt and fats that are added to foods, nutrition labels don’t provide you with a daily reference value for added sugar. Added sugar (Sucrose) is made of two simpler sugars called glucose and fructose.
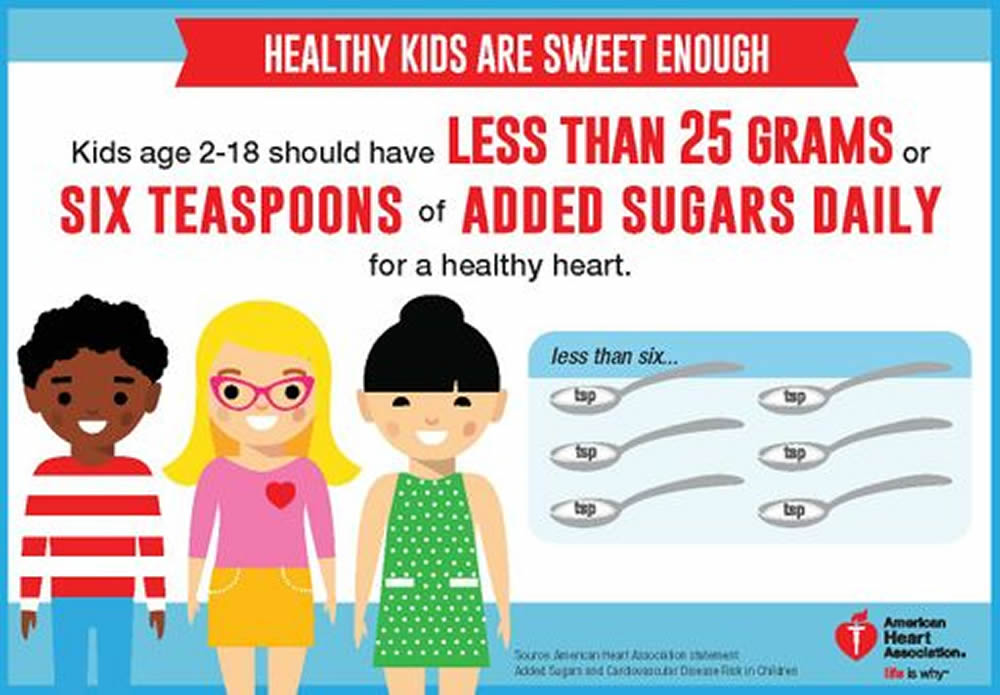
However, the American Heart Association recommends no more than 9 teaspoons (38 grams) of added sugar per day for men, and 6 teaspoons (25 grams) per day for women. The American Heart Association limits for children vary depending on their age and caloric needs, but range between 3-6 teaspoons (12 – 25 grams) per day.
One Tablespoon of table sugar (also known as sucrose), contains approximately 48 calories and about 12 grams of sugar.
1 tablespoon of maple syrup contains about 51 calories and just over 12 grams of sugar, 1 tablespoon of corn syrup has approximately 57 calories and 13 grams of sugar and 1 tablespoon of honey provides about 63 calories and 13.5 grams of sugar.
On the other hand a Teaspoon of sugar provides about 16 calories and 4 grams of sugar. Knowing how many calories and grams of refined sugar are in a specific unit of measurement, whether it’s a teaspoon or a tablespoon, generally allows you to calculate the number of calories in foods with added sugar.
Many foods high in calories from added sugars provide few or no essential nutrients or dietary fiber and, therefore, may contribute to excess calorie intake without contributing to diet quality; intake of these foods should be limited to help achieve healthy eating patterns within calorie limits. To put that in perspective, a 12-ounce can of regular soda contains about 9 teaspoons of sugar, so quaffing even one a day would put all women and most men over the daily limit.
On a given day, half of the US population consumes a sugar-sweetened beverage (source 1).
Added Sugar
Sugars are found naturally in fruits (fructose) and fluid milk and milk products (lactose). The majority of sugars in typical American diets are sugars added to foods during processing, preparation, or at the table. These “added sugars” sweeten the flavor of foods and beverages and improve their palatability. They also are added to foods for preservation purposes and to provide functional attributes, such as viscosity, texture, body, and browning capacity.
Although the body’s response to sugars does not depend on whether they are naturally present in food or added to foods, sugars found naturally in foods are part of the food’s total package of nutrients and other healthful components. In contrast, many foods that contain added sugars often supply calories, but few or no essential nutrients and no dietary fiber.
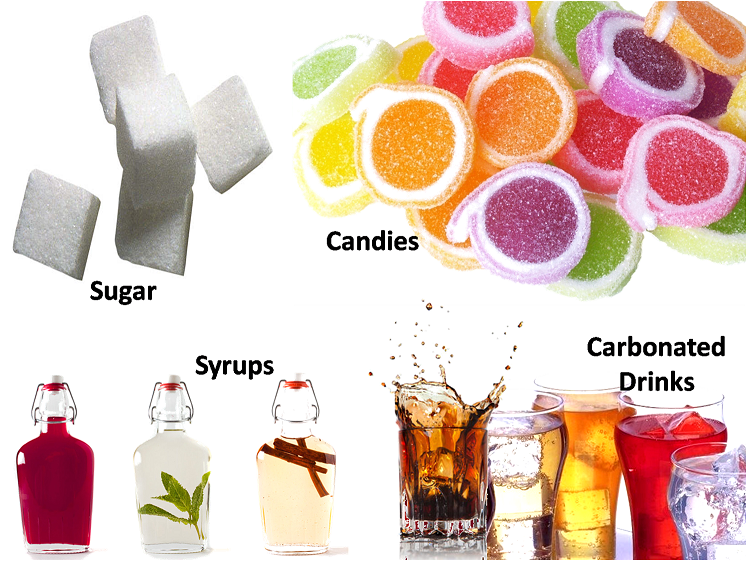
Both naturally occurring sugars and added sugars increase the risk of dental caries. Added sugars contribute an average of 16 percent of the total calories in American diets. Added sugars include high fructose corn syrup, white sugar, brown sugar, corn syrup, corn syrup solids, raw sugar, malt syrup, maple syrup, pancake syrup, fructose sweetener, liquid fructose, honey, molasses, anhydrous dextrose, and crystal dextrose. (Source 2).
Sugar Sweetened Beverages
Sugar-sweetened beverage intake is associated with weight gain, high blood pressure, type 2 diabetes, and metabolic syndrome — all of which are risk factors for cardiovascular disease, one of the leading causes of preventable death in the United States (source 3, 4, 5, 6, 7, 8, 9, 10). People living in poverty and having food insecurity are disproportionally burdened by some of these risk factors for many reasons, including the low cost of energy-dense foods such as sugar-sweetened beverages 11. Better understanding the sociodemographic and behavioral factors of this high-risk population can help public health and clinical systems improve efforts to reduce sugar-sweetened beverage consumption.
Added sugar is hiding in 74% of packaged foods. Added sugar is hiding in foods that many of us consider healthy, like yogurt and energy bars. It is also added to savory foods, such as ketchup, breads, salad dressing and pasta sauce.
White refined sugar or table sugar is also known as Sucrose (a Disaccharide) which is made up of a combination of the 2 monosaccharides – Glucose and Fructose. Table sugar (sucrose) comes from plant sources. Two important sugar crops predominate: sugarcane and sugar beets and it is difficult to distinguish between fully refined sugar produced from sugar beet and sugarcane.
Brown sugar is just common sugar with higher molasses content or from coating white refined sugar with cane molasses syrup (blackstrap molasses). Brown sugar’s color and taste becomes stronger with increasing molasses content. Brown sugar has about the same amount of calories and grams of sugar.
Most Americans are consuming way too much — on average, nearly 66 pounds of added sugar per person, every year. This could be affecting us in ways that make us prone to craving more sugar and to obesity. The major source of added sugars in typical U.S. diets is beverages, which include soft drinks, fruit drinks, sweetened coffee and tea, energy drinks, alcoholic beverages, and flavored waters.
Beverages account for almost half (47%) of all added sugars consumed by the U.S. population. The other major source of added sugars is snacks and sweets, which includes grain-based desserts such as cakes, pies, cookies, brownies, doughnuts, sweet rolls, and pastries; dairy desserts such as ice cream, other frozen desserts, and puddings; candies; sugars; jams; syrups; and sweet toppings. Together, these food categories make up more than 75 percent of intake of all added sugars.
Consumption of Added Sugar Among U.S. Children and Adolescents
Key findings: Data from the National Health and Nutrition Examination Survey, 2005–2008 (Source 12).
- Non-Hispanic white children and adolescents consume a larger percent of their calories from added sugars than do Mexican-American children and adolescents.
- There was no difference in consumption of added sugars by income among children and adolescents.
- More added sugars calories came from foods rather than beverages.
- More added sugars calories were consumed at home rather than away from home.
The consumption of added sugars, which are sweeteners added to processed and prepared foods, has been associated with measures of cardiovascular disease risk among adolescents, including adverse cholesterol concentrations 13. Although the percent of daily calories derived from added sugars declined between 1999–2000 and 2007–2008 14, consumption of added sugars remains high in the diets of Americans. The 2010 Dietary Guidelines recommend limiting total intake of discretionary calories, which include added sugars and solid fats, to 5%–15% of daily caloric intake 15, yet many Americans continue to exceed these recommendations (Welsh JA, Sharma AJ, Grellinger L, Vos MB. Consumption of added sugars is decreasing in the United States. Am J Clin Nutr 94(3):726–34. 2011.).
This data brief presents results for added sugar consumption among U.S. children and adolescents for 2005–2008.
- Are there differences in the mean number of calories consumed from added sugars by boys and girls and by age group ?
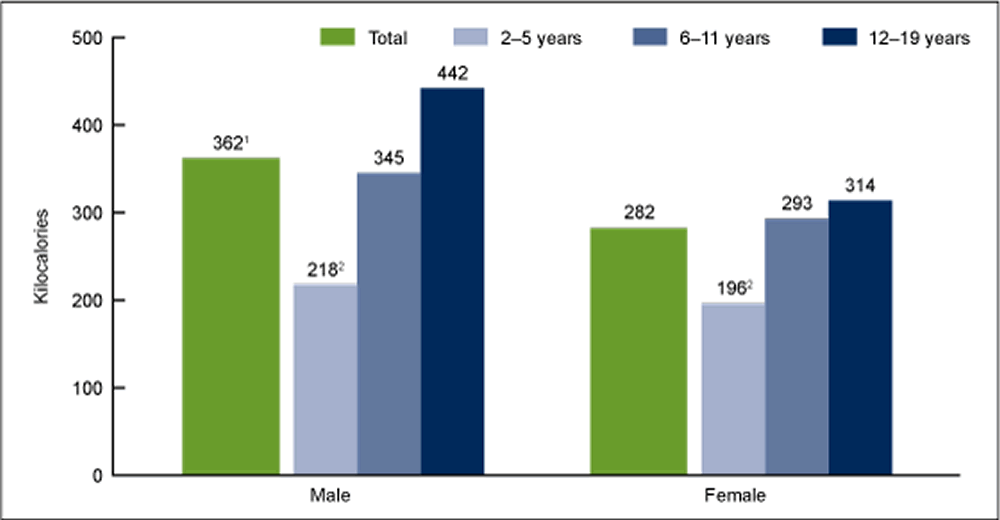
Boys consumed more calories per day from added sugars than girls. Boys consumed an average of 362 kilocalories (kcals) from added sugars compared with 282 kcals for girls (Figure 1). Caloric intake from added sugars increased linearly with age for boys and girls. Preschool-aged boys (2–5 years) consumed an average of 218 kcals from added sugars, school-aged boys (6–11 years) consumed an average of 345 kcals from added sugars, and adolescent boys (12–19 years) consumed an average of 442 kcals from added sugars. Preschool-aged girls (2–5 years) consumed an average of 196 kcals from added sugars, school-aged girls (6–11 years) consumed 293 kcals from added sugars, and adolescent girls (12–19 years) consumed 314 kcals from added sugars.
Boys consumed an average of 16.3% of their calories from added sugars, while girls consumed an average of 15.5% of their calories from added sugars. The percent of calories contributed by added sugars increased linearly with age for boys and girls. And there were no significant differences in the percent of total calories from added sugars based on poverty income ratio either for boys or girls.
More of the added sugars calories were consumed at home rather than away from home for both beverages and foods. These results are consistent with results for total caloric intakes. That is, 65% of the total calories that children and adolescents consumed were consumed at home. The remainder was consumed away from home. Slightly more than one-half of the added sugars calories from beverages were consumed at home (54%), while nearly two-thirds of the added sugars consumed from foods were consumed at home (66%).
Figure 1. Mean kilocalories from added sugars among children and adolescents aged 2–19 years, by sex and age group: United States, 2005–2008
(Source 12).
Too Sugar Much Can Make Us Sick
Eating too much added sugar doesn’t just expand our waistlines, it can also contribute to Heart disease and Type 2 Diabetes. One is excess sugar intake well-known links to weight gain and cavities. The other is that sugar delivers “empty calories” — calories unaccompanied by fiber, vitamins, minerals, and other nutrients. Too much added sugar can crowd healthier foods from a person’s diet.
Exactly how excess sugar might harm the heart isn’t clear. Earlier research has shown that drinking sugar-sweetened beverages can raise blood pressure. A high-sugar diet may also stimulate the liver to dump more harmful fats into the bloodstream. Both factors are known to boost heart disease risk.
Increasingly, scientists are focusing on a common set of underlying metabolic issues that raise people’s risk for chronic disease. It turns out that the long-term over consumption of added sugars is linked to Metabolic Syndrome (also called Syndrome X).
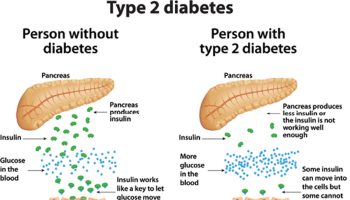
Metabolic Syndrome is a group of body abnormalities that go along with increased risk of cardiovascular disease, type 2 diabetes and stroke. The definition of this syndrome varies a little worldwide. These chronic conditions are among the leading causes of death worldwide.
References- National Center for Biotechnology Information, U.S. National Library of Medicine – Ogden CL, Kit BK, Carroll MD, Park S. Consumption of sugar drinks in the United States, 2005–2008. NCHS data brief 2011 (71):1–8. – https://www.ncbi.nlm.nih.gov/pubmed/22617020
- U.S. Department of Agriculture & U.S. Department of Health and Human Services: Dietary Guidelines for Americans 2010 – https://www.cnpp.usda.gov/sites/default/files/dietary_guidelines_for_americans/PolicyDoc.pdf
- National Center for Biotechnology Information, U.S. National Library of Medicine – Hu FB. Resolved: there is sufficient scientific evidence that decreasing sugar-sweetened beverage consumption will reduce the prevalence of obesity and obesity-related diseases. Obes Rev 2013;14(8):606–19. – https://www.ncbi.nlm.nih.gov/pubmed/23763695
- National Center for Biotechnology Information, U.S. National Library of Medicine – Sources of calories from added sugars among the US population, 2005–06. Applied Research Program Web site. National Cancer Institute. http://appliedresearch.cancer.gov/diet/foodsources/added_sugars/. Accessed April 29, 2014.
- National Center for Biotechnology Information, U.S. National Library of Medicine – Dhingra R, Sullivan L, Jacques PF, Wang TJ, Fox CS, Meigs JB, et al. Soft drink consumption and risk of developing cardiometabolic risk factors and the metabolic syndrome in middle-aged adults in the community. Circulation 2007;116(5):480–8. – https://www.ncbi.nlm.nih.gov/pubmed/17646581
- National Center for Biotechnology Information, U.S. National Library of Medicine – Malik AH, Akram Y, Shetty S, Malik SS, Yanchou Njike V. Impact of sugar-sweetened beverages on blood pressure. Am J Cardiol 2014;113(9):1574–80. – https://www.ncbi.nlm.nih.gov/pubmed/24630785
- National Center for Biotechnology Information, U.S. National Library of Medicine – Malik VS, Pan A, Willett WC, Hu FB. Sugar-sweetened beverages and weight gain in children and adults: a systematic review and meta-analysis. Am J Clin Nutr 2013;98(4):1084–102. – https://www.ncbi.nlm.nih.gov/pubmed/23966427
- National Center for Biotechnology Information, U.S. National Library of Medicine – Malik VS, Popkin BM, Bray GA, Després J-P, Willett WC, Hu FB. Sugar-sweetened beverages and risk of metabolic syndrome and type 2 diabetes: a meta-analysis. Diabetes Care 2010;33(11):2477–83. – https://www.ncbi.nlm.nih.gov/pubmed/20693348
- National Center for Biotechnology Information, U.S. National Library of Medicine – Mattes RD, Shikany JM, Kaiser KA, Allison DB. Nutritively sweetened beverage consumption and body weight: a systematic review and meta-analysis of randomized experiments. Obes Rev 2011;12(5):346–65. – https://www.ncbi.nlm.nih.gov/pubmed/20524996
- National Center for Biotechnology Information, U.S. National Library of Medicine – Yoon PW, Batian B, Anderson RN, Collins JL, Jaffe H. Potentially preventable deaths from the five leading causes of death — United States, 2008–2010. MMWR Morb Mortal Wkly Rep 2014;63(17):369–74. – https://www.ncbi.nlm.nih.gov/pubmed/24785982
- National Center for Biotechnology Information, U.S. National Library of Medicine – Drewnowski A, Specter SE. Poverty and obesity: the role of energy density and energy costs. Am J Clin Nutr 2004;79(1):6–16. – https://www.ncbi.nlm.nih.gov/pubmed/14684391
- Centers for Disease Control and Prevention, National Center for Health Statistics NCHS Data Brief No. 87, February 2012 – Consumption of Added Sugar Among U.S. Children and Adolescents, 2005–2008 – https://www.cdc.gov/nchs/data/databriefs/db87.htm
- Welsh JA, Sharma A, Cunningham SA, Vos MB. Consumption of added sugars and indicators of cardiovascular disease risk among U.S. adolescents. Circulation 123(3):249–57. 2011.
- Welsh JA, Sharma AJ, Grellinger L, Vos MB. Consumption of added sugars is decreasing in the United States. Am J Clin Nutr 94(3):726–34. 2011.
- U.S. Department of Agriculture and U.S. Department of Health and Human Services. Dietary guidelines for Americans, 2010. 7th ed. Washington, DC: U.S. Government Printing Office. 2010.

