Left axis deviation
In electrocardiography, left axis deviation is a condition where the mean electrical axis of ventricular contraction of the heart lies in a frontal plane direction between −30° and −90°. This is reflected by a QRS complex positive in lead I and negative in leads aVF and II.
One of the key steps in interpreting an electrocardiogram (ECG) is determining the electrical axis of the heart. Being able to determine the electrical axis can give insight into underlying disease states and help steer the differential diagnosis towards or away from certain diagnoses.
In electrocardiology, a vector represents both the magnitude and direction of the action potential generated by an individual myocyte. The sum of all the individual vectors generated by the depolarization waves makes up the electrical axis. Because each myocyte can produce an action potential, an axis for each wave and interval of the cardiac cycle can be determined. Knowing the axis of each and how they interact can reflect certain pathology.
When the electrical axis is discussed and taught, the ventricular axis is typically used in common clinical practice, although the atrial axis can be quite useful in clinical situations. Since the left ventricle makes up most of the heart muscle under normal circumstances; thus, it generates the most electrical force visible on the EKG. The normal ventricular axis is thus directed downward and slightly towards the left.
The ventricular axis can be determined by looking at the QRS complex, which represents ventricular depolarization. Because the QRS complex is used to determine the ventricular axis, it is also referred to as the QRS axis. The ventricular (QRS) axis signifies the sum of all individual vectors generated by the depolarization waves of ventricular myocytes 1.
Ventricular (QRS) Axis
The ventricular (QRS) axis is determined indirectly by evaluating the vectors produced under the electrodes. This is done by interpreting the electrical signal (QRS complex) recorded at each electrode as positive, negative, or isoelectric and then considering their relationship with each other.
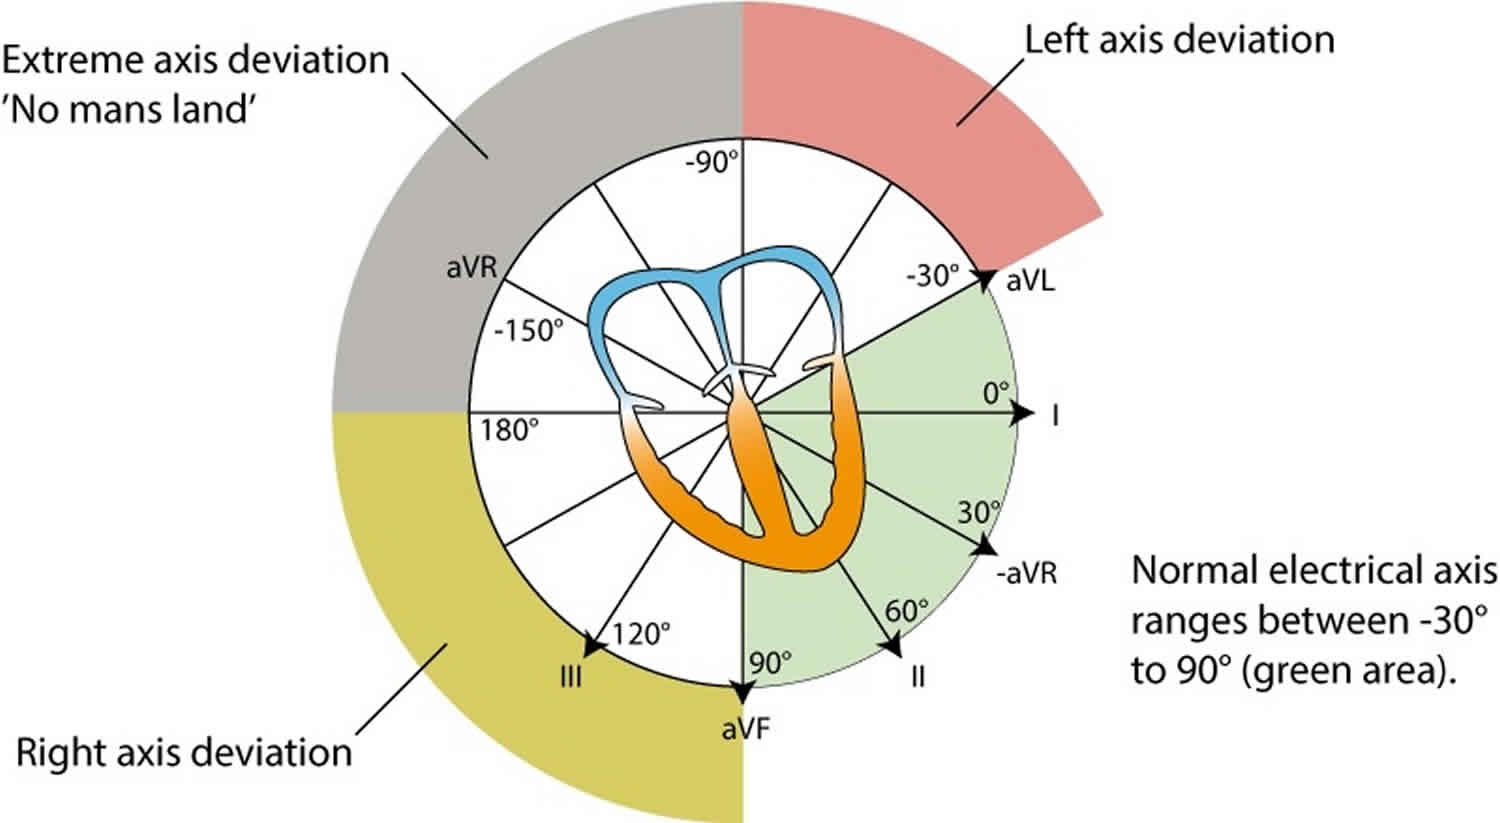
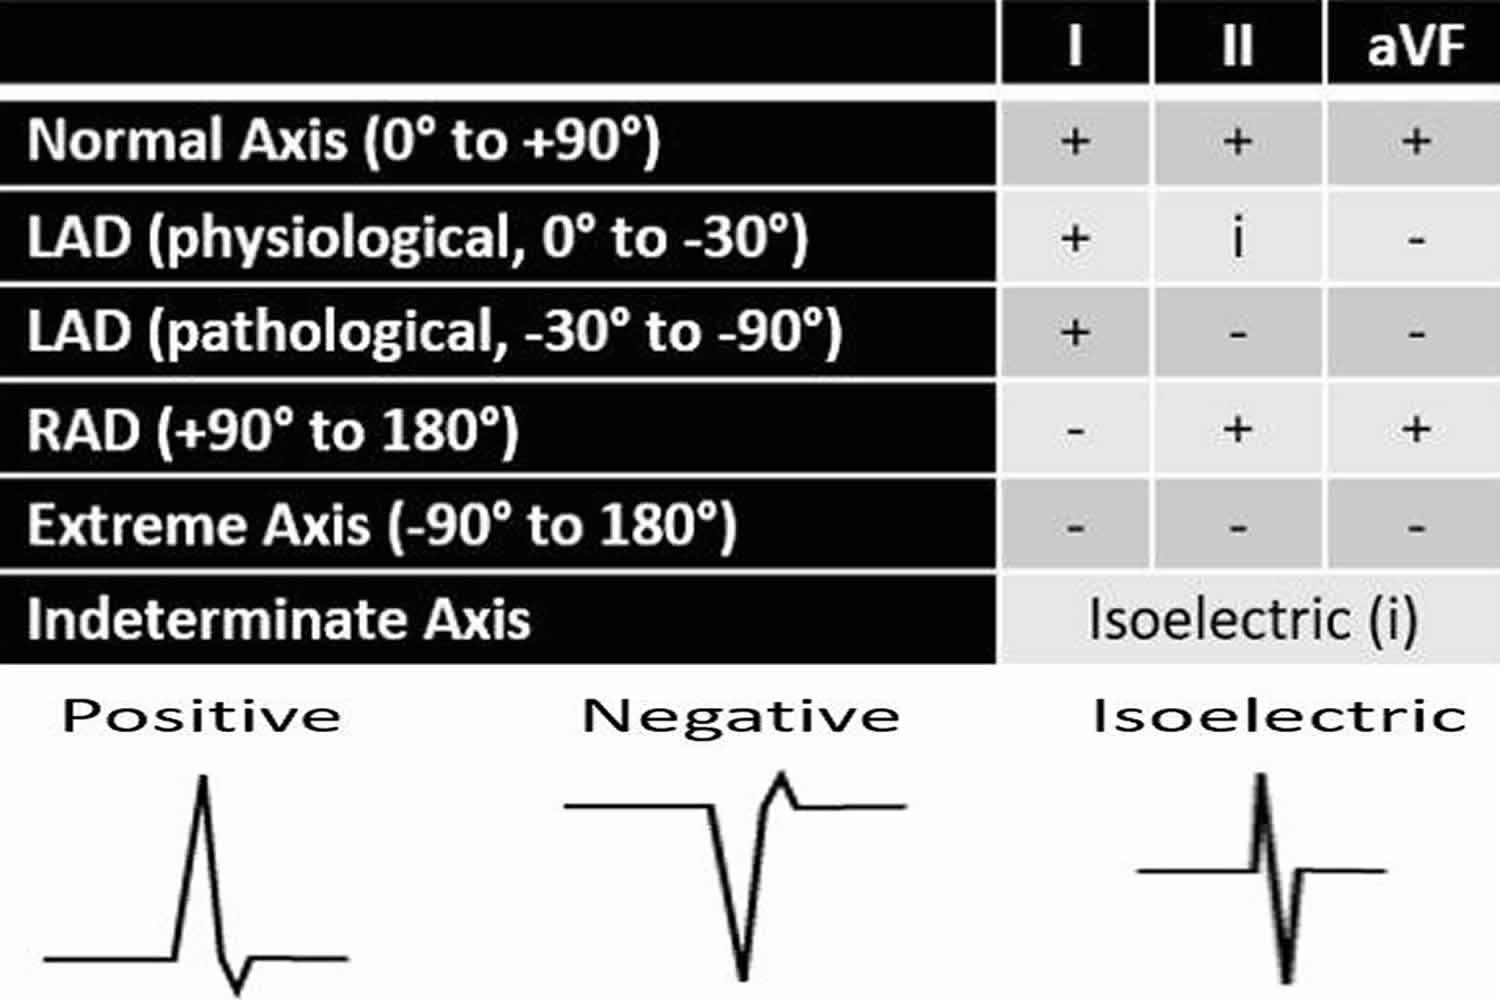
In general, a positive QRS complex in a lead has a ventricular axis that is approximately in the same direction to that lead. Whereas a negative QRS complex in a lead has a ventricular axis that is approximately in the opposite direction to that lead. If the QRS complex is isoelectric in a lead, then the ventricular axis is perpendicular (90 degrees) to that lead 2. This is summarized in Figure 1.
Figure 1. Electrical axis classification
Electrical axis classification
There are five main electrical axis classifications 3:
- Normal axis
- Left axis deviation (LAD)
- Right axis deviation (RAD)
- Extreme axis deviation, and
- Indeterminate axis
There is some disagreement on the exact degrees that define each type, but there are some general cutoffs that can be used for the QRS axis.
The QRS axis moves leftward throughout childhood and adolescence and into adulthood. At birth, the normal QRS axis lies between +30 degrees and +190 degrees. Between the ages of 8 to 16 years, the axis moves leftward with normal lying between 0° degrees to +120 degrees. The normal adult QRS axis is between -30 degrees and +90 degrees, which is directed downward and to the left. This adult range is sometimes extended from -30 degrees to +100 degrees.
The following axis classifications described are based on adults:
- If the QRS axis falls between -30 degrees and -90 degrees, it is considered left axis deviation. In this case, the QRS vector is directed upward and to the left.
- If the QRS axis falls between +90 degrees and 180 degrees, or beyond +100 degrees if the adult range is used, then right axis deviation is present. The QRS vector would be directed downward and to the right.
- If the QRS axis happens to fall between -90 degrees and 180 degrees, this would be referred to as extreme axis deviation, whereby the ventricular vector is directed upward and to the right.
- Lastly, if the QRS complex is isoelectric or equiphasic in all leads with no dominant QRS deflection, it is considered an indeterminate axis.
The electrical axis classifications are summarized in Figure 1 above.
Approach to determining axis
There are multiple methods to determine the electrical axis. The following are a few of these simple and adequate approaches to assess the ventricular (QRS) axis. Hence, the focus will be on the QRS complexes in specific leads.
The main QRS complexes to evaluate are those in leads I, II, and aVF. The positive ends of these three leads fall within the normal axis region. The positive ends of leads I, II, and aVF are 0 degrees, +60 degrees, and +90 degrees, respectively. Therefore, if all three of these leads have positive QRS complexes, the axis is normal.
Method 1
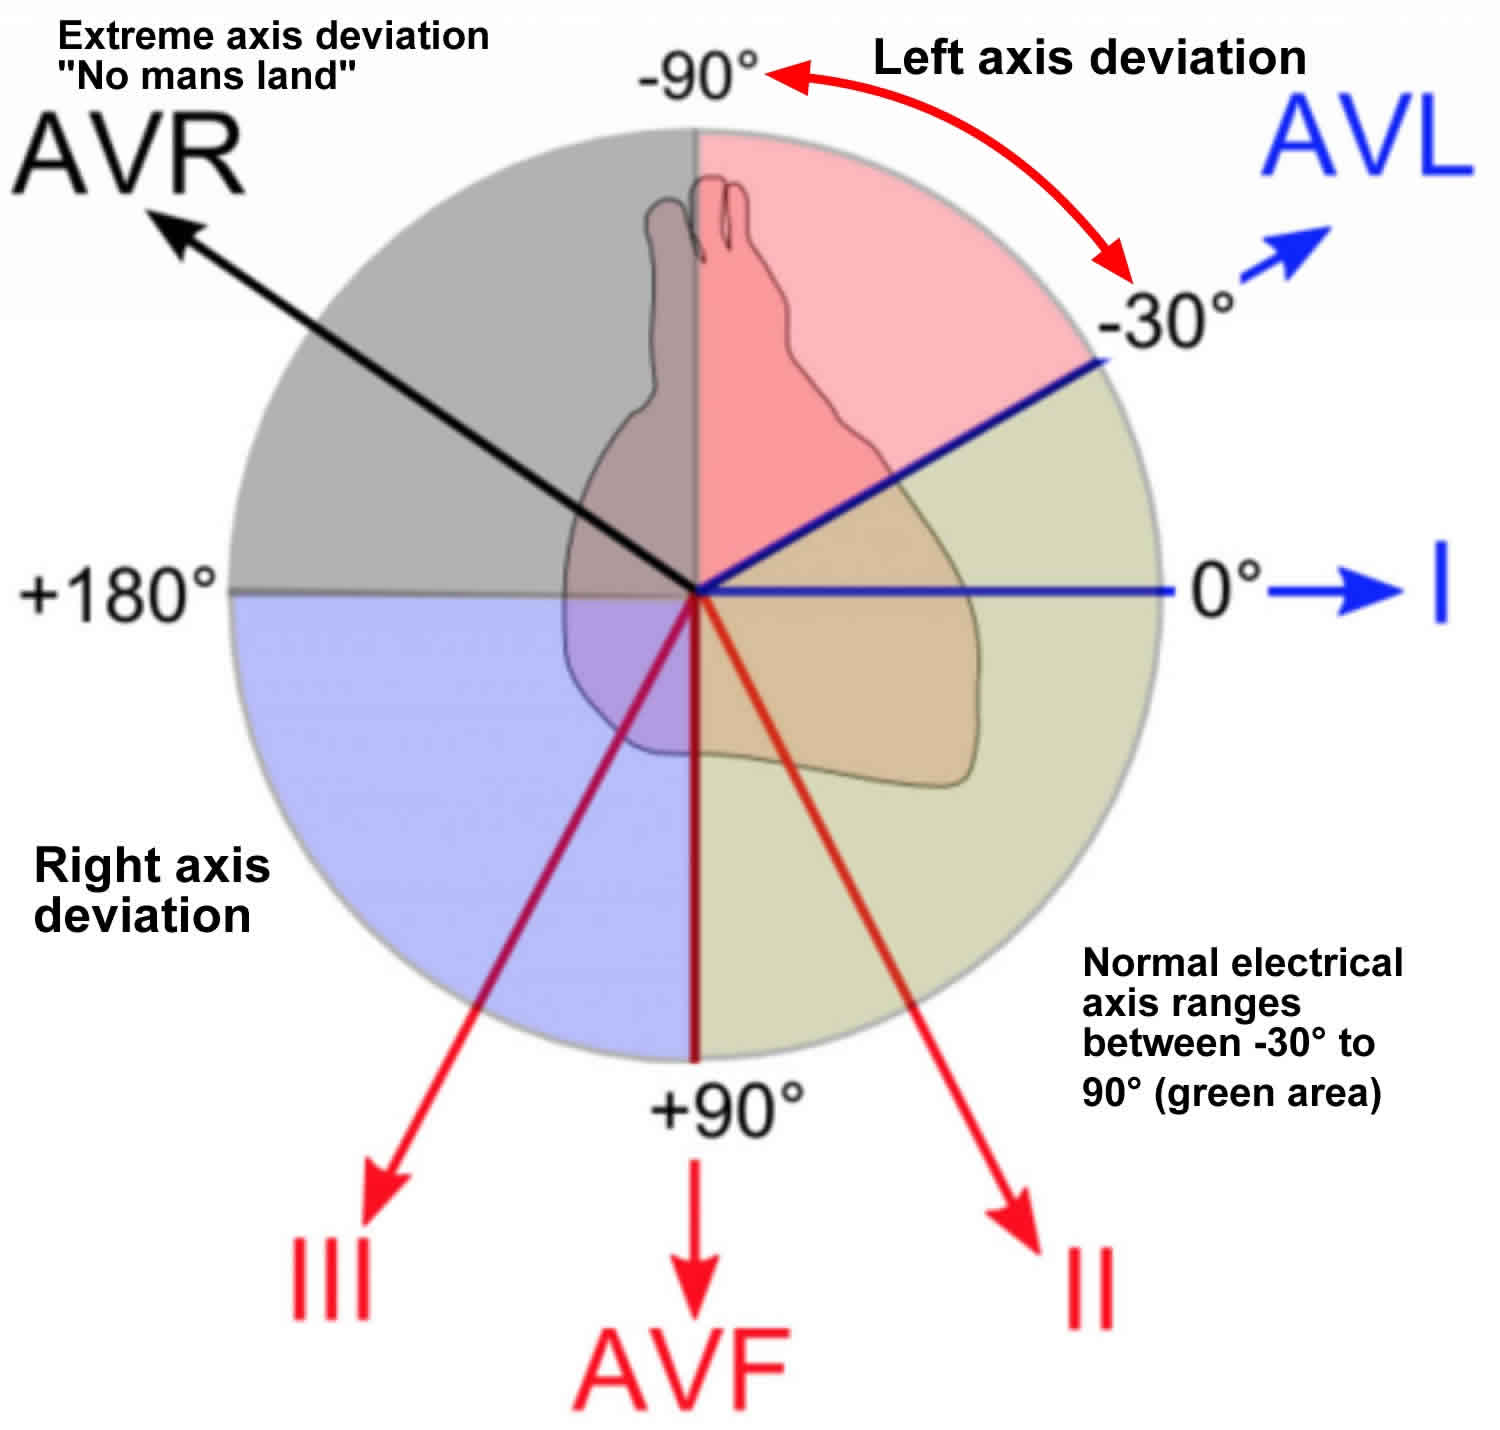
One simple way to learn how to determine the electrical axis is to inspect limb leads I and aVF. This is referred to as the quadrant approach or two-lead method. Each of the four quadrants represents 90 degrees and an axis type. In other words, 0 degrees to +90 degrees is a normal axis, +90 degrees to 180 degrees is right axis deviation, 0 degrees to -90 degrees is left axis deviation, and -90 degrees to 180 degrees is an extreme axis. Therefore, if leads I and aVF are both positive, then the axis falls within the normal axis range. If lead I is positive and lead aVF is negative, then there is left axis deviation. If lead I is negative and lead aVF is positive, then there is right axis deviation. And, if both leads I and aVF are negative, then the axis falls within the extreme axis range. This quadrant approach is summarized in Figure 2.
One issue with this method is that it only gives a close approximation to the true axis. In addition, it narrows the normal axis range. This can result in an inaccurate interpretation of the true electrical axis. For instance, if using this approach with a positive lead I and negative lead aVF, the axis would be interpreted as left axis deviation. However, if the true axis were -20 degrees, which lies in the left axis deviation quadrant using this method, it would still be within the normal axis range. Nevertheless, this method is easy to learn and sufficient in most cases.
One way to resolve these issues is by locating the most isoelectric limb lead and knowing that the true axis lies nearly perpendicular to it. Using this can help narrow the axis down to within 10 degrees of the normal axis.
Figure 2. Quadrant approach to determine the electrical axis
Method 2
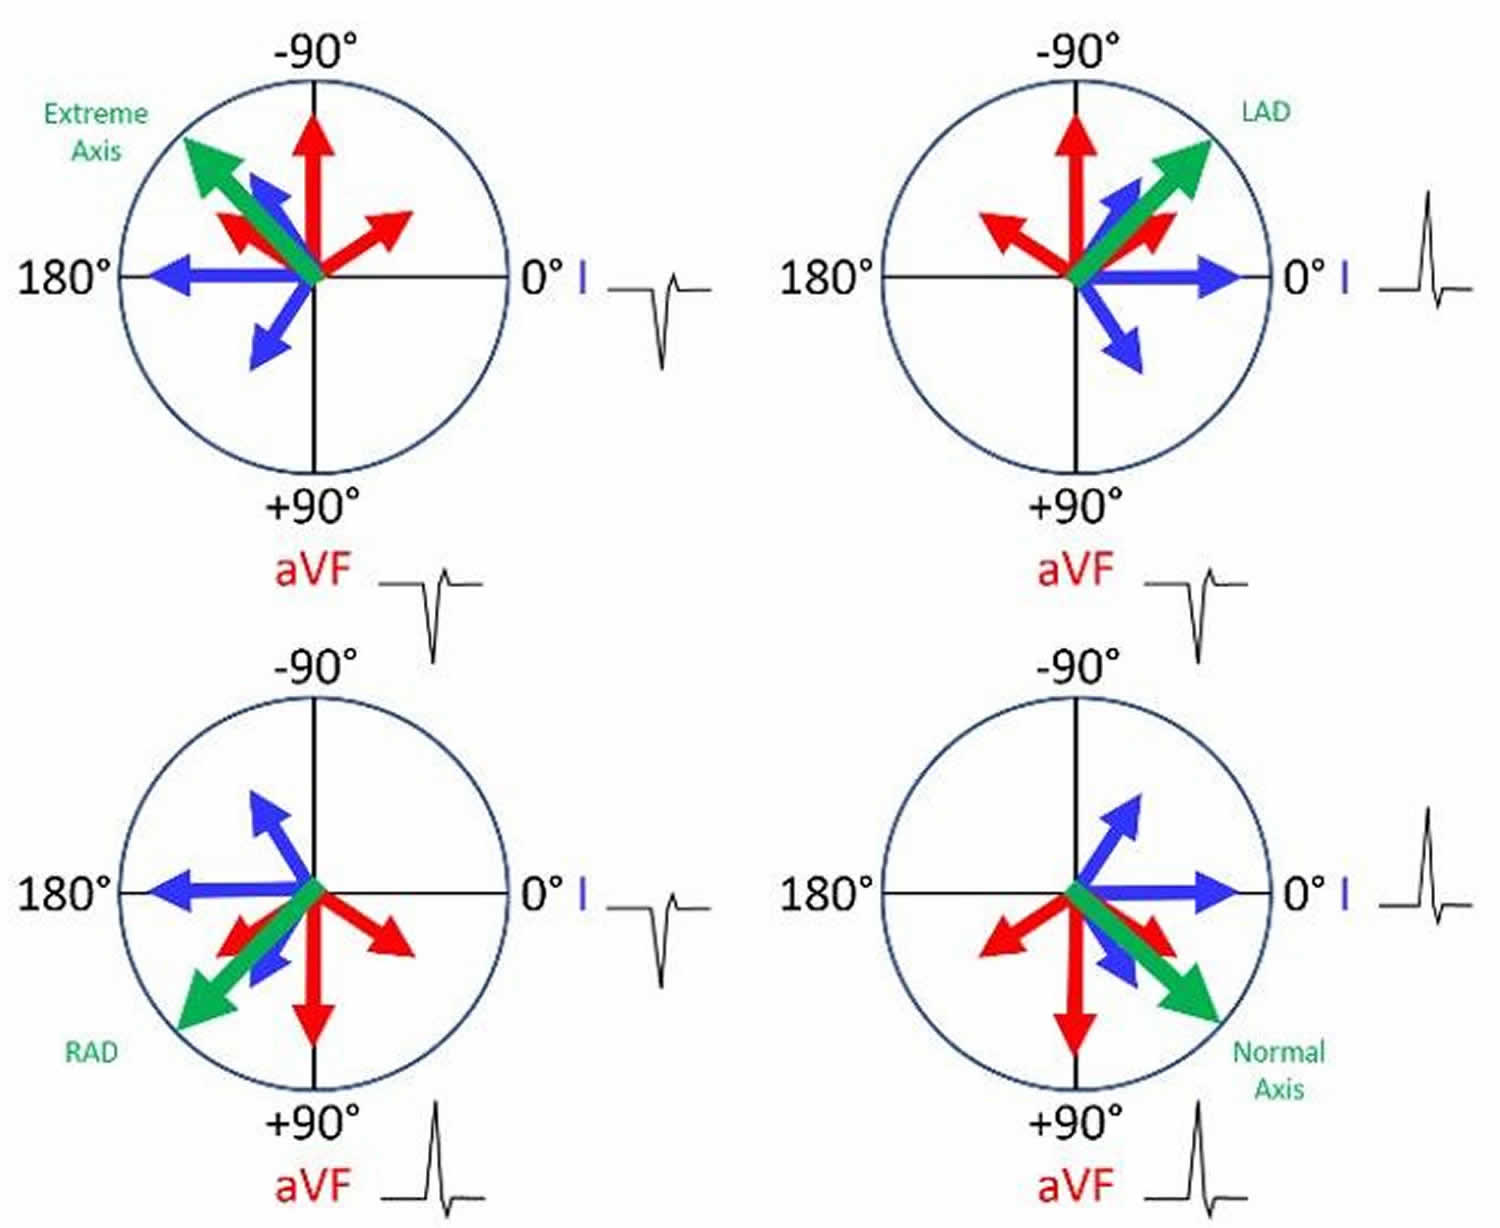
A more accurate approach than the simple quadrant approach takes into account leads I and aVF, as well as lead II. This is referred to as the three-lead method. If the net QRS deflection is positive in both leads I and II, the QRS axis is normal. If the net QRS deflection is positive in lead I, but negative lead II, then there is left axis deviation. Notice that in both cases lead aVF was not needed. In other words, if lead I is positive, look next to lead II. Now, if lead I is negative, look next to lead aVF. If lead aVF is positive, then the axis is rightward; however, if lead aVF is also negative, then there is the extreme axis. This approach is summarized in Figure 3 and Table 1.
Figure 3. Three-lead method to determine the electrical axis
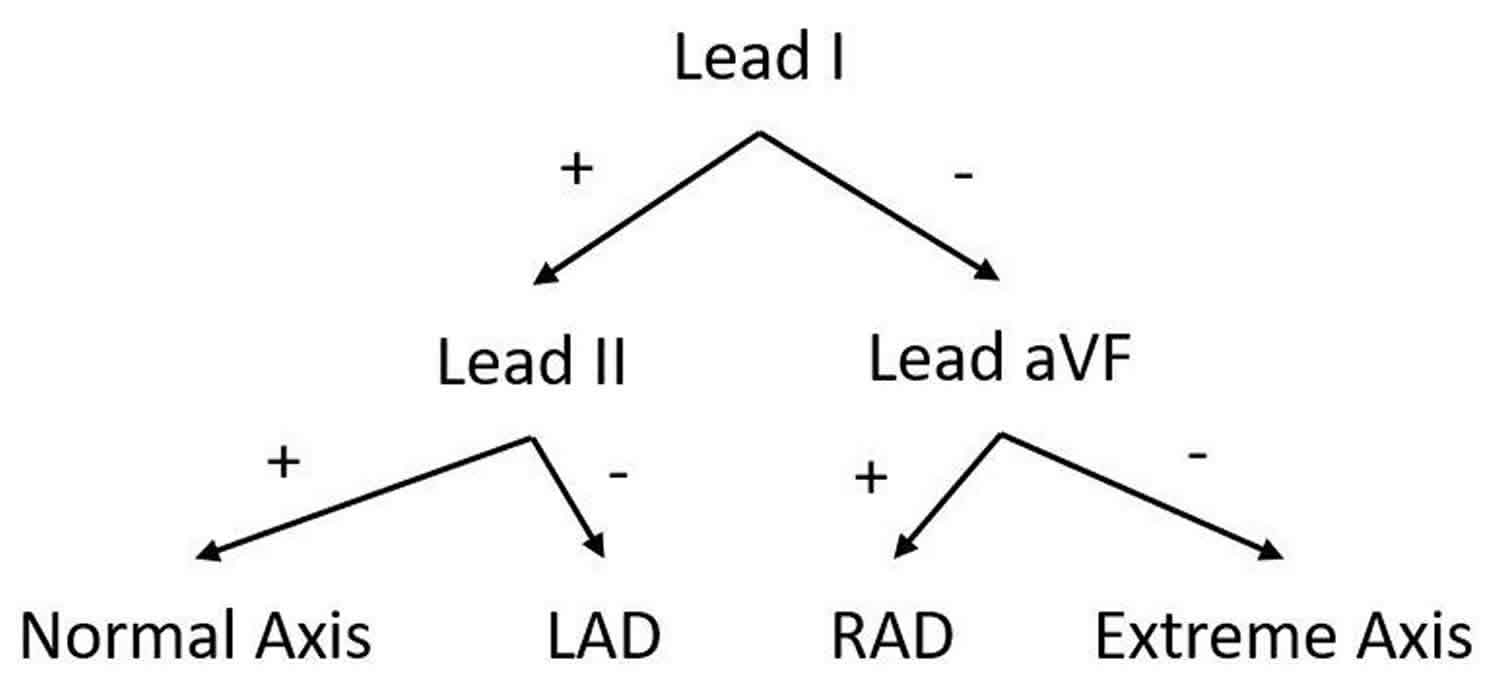
Table 1. Three-lead method to determine the electrical axis summarized
Method 3
Another simple way to estimate the ventricular (QRS) axis is to locate the most isoelectric limb lead along the frontal plane. The isoelectric (equiphasic) lead represents the lead with a net amplitude of zero and the smallest overall amplitude. The QRS axis is approximately perpendicular (90 degrees) from the positive pole of that lead.
In order to determine which direction to move 90 degrees from that positive pole, look at the net deflection in another lead. For example, if the isoelectric limb lead is lead II, which has a positive end directed at +60 degrees, then the electrical axis is directed approximately 90 degrees from +60 degrees in either direction. Therefore, the axis can lie at around +150° (right axis deviation) or -30 degrees (borderline left axis deviation). If lead I, with a positive pole at 0 degrees, has a net positive QRS deflection, then the axis will be closer to -30 degrees (left axis deviation); and, if lead I has a net negative QRS deflection, then the axis will be closer to +150 degrees (right axis deviation).
Finally, it’s important to note that these three methods determine the electrical axis in the frontal plane. There is also a horizontal plane with a horizontal axis. The axis along this plane can be determined by viewing the heart under the diaphragm. The axis can be considered to have a clockwise or counter-clockwise rotation depending on when the transition from mostly negative QRS complexes to mostly positive QRS complexes occurs along with the precordial leads (V1-V6). Ideally, this would be the isoelectric precordial lead. Normally, this transition occurs between leads V3 and V4. If it occurs earlier, it is considered to a counterclockwise rotation and an early transition. This would indicate that the left ventricular forces are directed more anteriorly. On the other hand, if it occurs later in which there is poor R wave progression, then it is considered a clockwise rotation and a late transition. This would indicate that the left ventricular forces are directed more posteriorly.
Left axis deviation causes
Causes of left axis deviation include 4:
- Normal variation (physiologic, often age-related change)
- Left ventricular hypertrophy
- Conduction defects: left bundle branch block (LBBB), left anterior fascicular block (LAFB)
- Inferior wall myocardial infarction
- Preexcitation syndromes (e.g., Wolff-Parkinson-White syndrome)
- Ventricular ectopic rhythms (e.g., ventricular tachycardia)
- Congenital heart disease (e.g., primum atrial septal defect, endocardial cushion defect)
- Hyperkalemia
- Emphysema
- Mechanical shift, such as with expiration or raised diaphragm (e.g., pregnancy, ascites, abdominal tumor, organomegaly)
- Pacemaker-generated rhythm or paced rhythm
Left axis deviation symptoms
Left axis deviation symptoms depend on the underlying cause.
Left axis deviation treatment
Left axis deviation treatment involve treating the underlying cause.
References- Acunzo RS, Konopka IV, Sanchéz RA, Pizzarelli N, Wells FC, Baranchuk A, Chiale PA. Right bundle branch block and middle septal fiber block with or without left anterior fascicular block manifested as aberrant conduction in apparent healthy individuals: Electro-vectorcardiographic characterization. J Electrocardiol. 2013 Mar-Apr;46(2):167-72.
- Han Y, Huang L, Li Z, Ma N, Li Q, Li Y, Wu L, Zhang X, Wu X, Che X, Zhang H. Relationship between left ventricular isovolumic relaxation flow patterns and mitral inflow patterns studied by using vector flow mapping. Sci Rep. 2019 Nov 07;9(1):16264.
- Lévy S. Diagnostic approach to cardiac arrhythmias. J. Cardiovasc. Pharmacol. 1991;17 Suppl 6:S24-31.
- Hara H, Niwano S, Ito H, Karakawa M, Ako J. Evaluation of R-wave offset in the left chest leads for estimating the left ventricular activation delay: An evaluation based on coronary sinus electrograms and the 12-lead electrocardiogram. J Electrocardiol. 2016 Mar-Apr;49(2):148-53.


