
What is Fructose
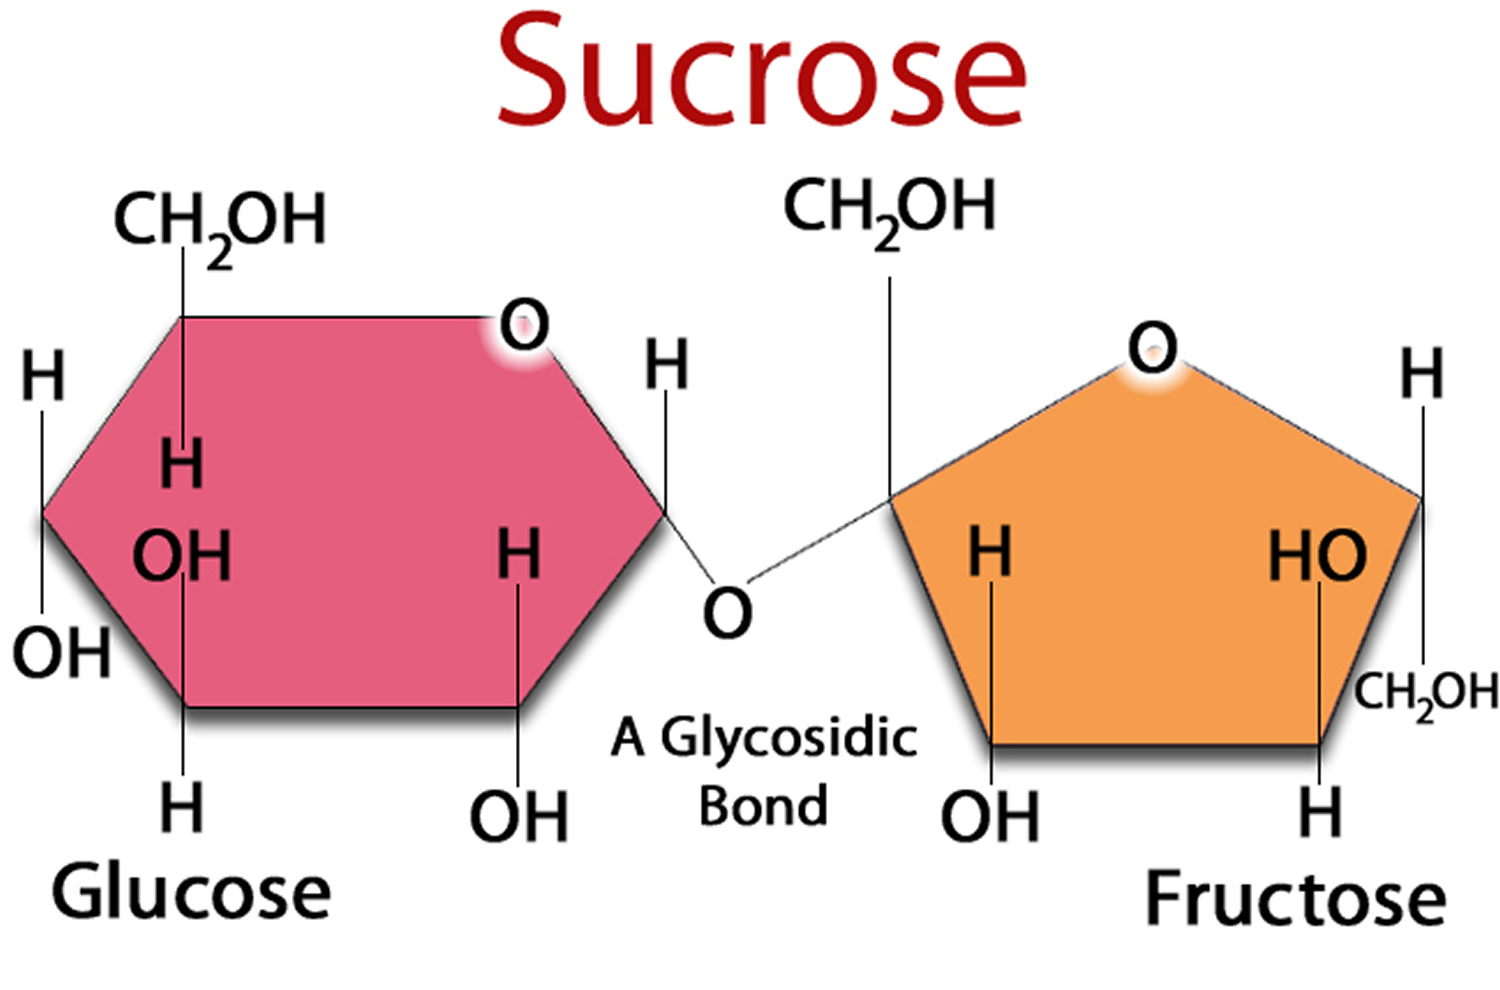
Fructose is a monosaccharide found in three main forms in the diet: as free fructose (present in fruits and honey); as a constituent of the disaccharide sucrose; or as fructans, a polymer of fructose usually in oligosaccharide form (present in some vegetables and wheat) 1. Fructose sugar found in many fruits, where it is often bonded to glucose to form the disaccharide sucrose. Sucrose is a compound with one molecule of glucose covalently linked to one molecule of fructose (fructose is joined to glucose). Sucrose is abundant in sugar cane, sugar beets, corn, and other plants. When extracted and refined, sucrose makes table sugar 2.
Fructose is the sugar that makes fruit taste sweet. For most people, there’s nothing wrong with eating fructose in its natural state, in fruit.
Because of fructose sweetness, palatability and taste enhancement, fructose is widely added to processed food and beverages. Commercially, fructose is frequently derived from sugar cane, sugar beets, and maize. Crystalline fructose is the monosaccharide, dried, ground, and of high purity. High-fructose corn syrup is a mixture of glucose and fructose as monosaccharides.
The body’s cells can use glucose directly for energy and most cells can also use fatty acids for energy. On the other hand, about the only ones that can handle fructose are liver cells. What the liver does with fructose, especially when there is too much in the diet, has potentially dangerous consequences for the liver, the arteries, and the heart 3.
High-fructose corn syrup is one of the most widely used food ingredients in nearly all soft drinks, canned jams, breakfast cereals and baked goods. An analysis of food consumption patterns by using US Department of Agriculture food consumption tables from 1967 to 2000. The consumption of high-fructose corn syrup increased > 1000% between 1970 and 1990, far exceeding the changes in intake of any other food or food group 4. High-fructose corn syrup now represents > 40% of caloric sweeteners added to foods and beverages and is the sole caloric sweetener in soft drinks in the United States. Our most conservative estimate of the consumption of high-fructose corn syrup indicates a daily average of 132 kcal for all Americans aged > or = 2 y, and the top 20% of consumers of caloric sweeteners ingest 316 kcal from high-fructose corn syrup/day. The increased use of HFCS in the United States mirrors the rapid increase in obesity 4. The digestion, absorption, and metabolism of fructose differ from those of glucose. Hepatic metabolism of fructose favors de novo lipogenesis. In addition, unlike glucose, fructose does not stimulate insulin secretion or enhance leptin production. Because insulin and leptin act as key afferent signals in the regulation of food intake and body weight, this suggests that dietary fructose may contribute to increased energy intake and weight gain. Furthermore, calorically sweetened beverages may enhance caloric overconsumption. Thus, the increase in consumption of HFCS has a temporal relation to the epidemic of obesity, and the overconsumption of high-fructose corn syrup in calorically sweetened beverages may play a role in the epidemic of obesity.
High fructose diet and extensive commercial use of high-fructose corn syrup are reported to be associated with the rising prevalence of metabolic syndrome or syndrome X worldwide 4, 5, triggering function impairment in multiple tissues and organs. The metabolism of fructose is quite different from glucose in catabolic reaction, as well as metabolite and regulatory mechanism. Fructose is metabolized in liver via fructolysis, and the primary metabolites and by-products include glucose, lactate, free fatty acid (FFA), very low-density lipoprotein triglyceride (VLDL)-TG, uric acid (UA) and methylglyoxal (MG). Extrahepatic absorption and metabolism of fructose also take place. These metabolites are considered to be direct dangerous factors, with the potential to disturb functions of extrahepatic tissues and organs.
In addition to rapid fructolysis in liver, high fructose causes an ATP depletion that triggers inflammatory response and oxidative stress, thereby disturbing functions of local tissues and organs. Subsequently, inflammatory cytokine, adiponectin, leptin, and endotoxin are produced and become indirect dangerous factors. Fructose and its metabolites directly and/or indirectly cause insulin resistance, chronic inflammation, endotoxin secretion, autophagy and disturbance of appetite for food intake, aggravating Metabolic Syndrome X 2.
There is growing scientific consensus that one of the most common types of sugar, fructose, can be toxic to the liver, just like alcohol. Scientific evidence on fructose and the liver is relatively new, but it is a major area of laboratory and clinical research in our best universities and medical centers.
There is research indicating that excessive fructose consumption is a cause of insulin resistance, obesity, elevated LDL cholesterol and triglycerides, leading to metabolic syndrome, insulin resistance, type 2 diabetes and cardiovascular disease 6.
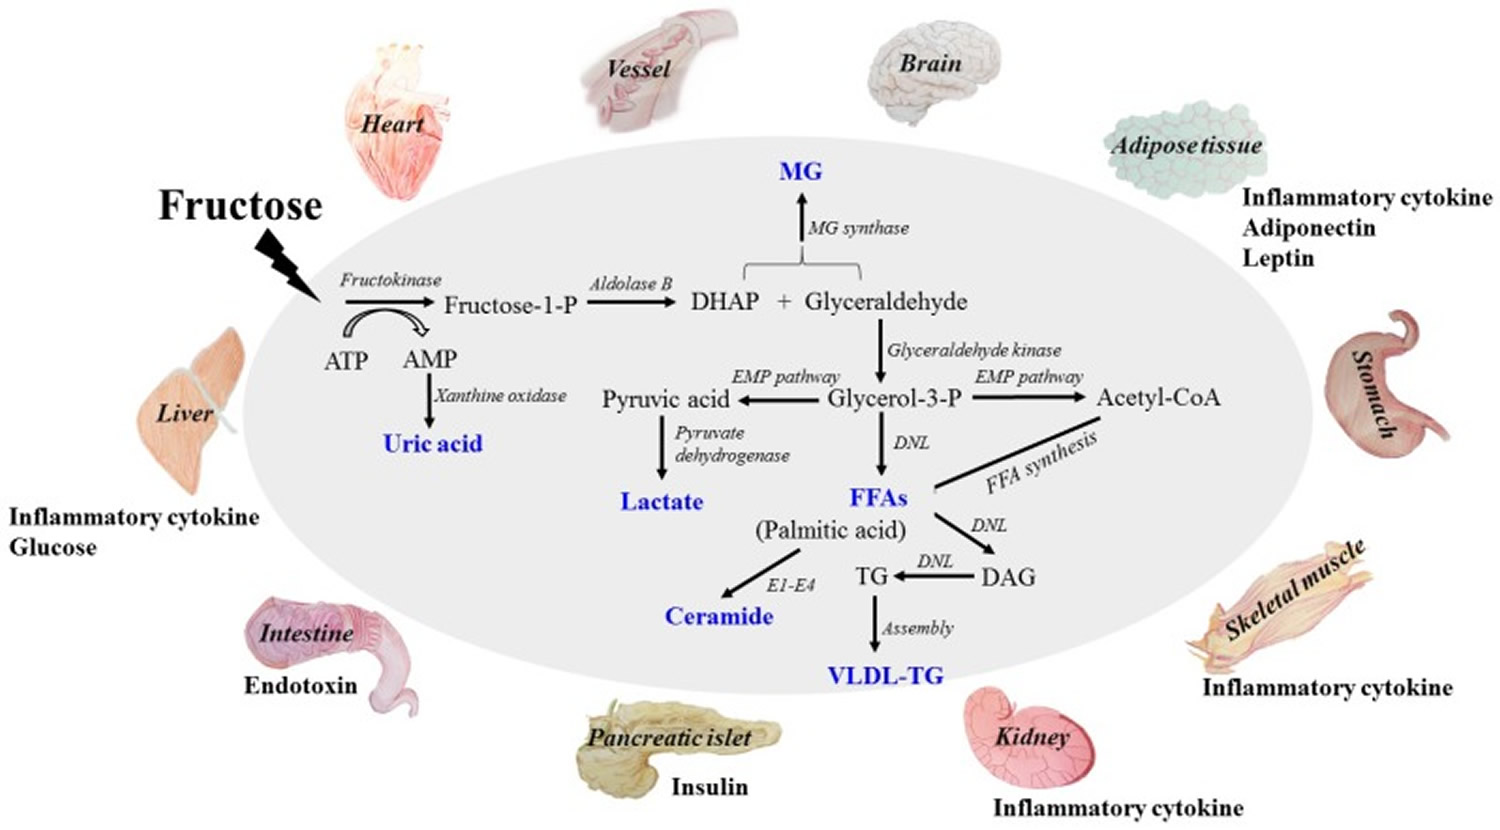
This diagram addresses fructose-induced metabolic syndrome, and the disturbance effects of direct and/or indirect dangerous factors on the functions of liver, adipose, pancreas islet, skeletal muscle, kidney, heart, brain and small intestine. The metabolites of fructose catabolism and the adverse effects of high fructose consumption on tissue and organ functions in a direct and/or indirect manner. Fructose is mainly metabolized in liver to produce glucose, lactate, triglyceride, free fatty acid (FFA), uric acid and methylglyoxal (MG). High levels of these metabolites are the direct dangerous factors. These dangerous factors impair the functions of local tissues and organs to overproduce inflammatory cytokine, adiponectin, leptin and endotoxin, which act as indirect dangerous factors. Meanwhile, glucose, insulin and ghrelin contents in system circulation are also disturbed. Fructose and its metabolites directly and/or indirectly cause oxidative stress, chronic inflammation, endothelial dysfunction, autophagy and increased intestinal permeability, and then further aggravate metabolic syndrome with tissue and organ dysfunctions. DHAP (dihydroxyacetone phosphate) ; TG (triglyceride) ; FFA (free fatty acid) ; UA (uric acid) ; MG (methylglyoxal) ; VLDL-TG (very low-density lipoprotein triglyceride). DNL (de novo lipogenesis). E1: Serine palmitoyl transferase; E2: 3-ketodihydrosphingosine reductase; E3: Ceramide synthase; E4: Dihydroceramide desaturase.
In addition to rapid fructolysis in liver, high fructose causes an ATP depletion that triggers inflammatory response and oxidative stress, thereby disturbing functions of local tissues and organs. Subsequently, inflammatory cytokine, adiponectin, leptin, and endotoxin are produced and become indirect dangerous factors. Fructose and its metabolites directly and/or indirectly cause insulin resistance, chronic inflammation, endotoxin secretion, autophagy and disturbance of appetite for food intake, aggravating Metabolic Syndrome X.
Potential Mechanisms for the Detrimental Effects of Fructose
At least two main mechanisms 4, 7, 8 can account for most of the detrimental effects of calorically sweetened beverages and the fructose they provide: (1) failure to suppress intake of other foods to compensate for the calories in soft drinks 9, 10, 11 and (2) differences in the metabolic pathways for fructose and glucose that facilitate conversion of carbon from fructose into the backbone of triglycerides 12, 13 and the formation of uric acid during metabolism of fructose 14, 15.
Failure to suppress caloric intake to offset the calories from calorie-sweetened beverages is part of the mechanism for increased energy intake and the risk for obesity 16, 17, 18. Drinking sugar-sweetened beverages at lunch did not suppress intake of solid food; rather, the calories from beverages added on to total calorie intake 18. For example, drinking apple juice reduced energy intake less than when the same amount of apple was eaten as applesauce or as pieces of apple 17.
Short-term Effects of Fructose on Human Metabolism
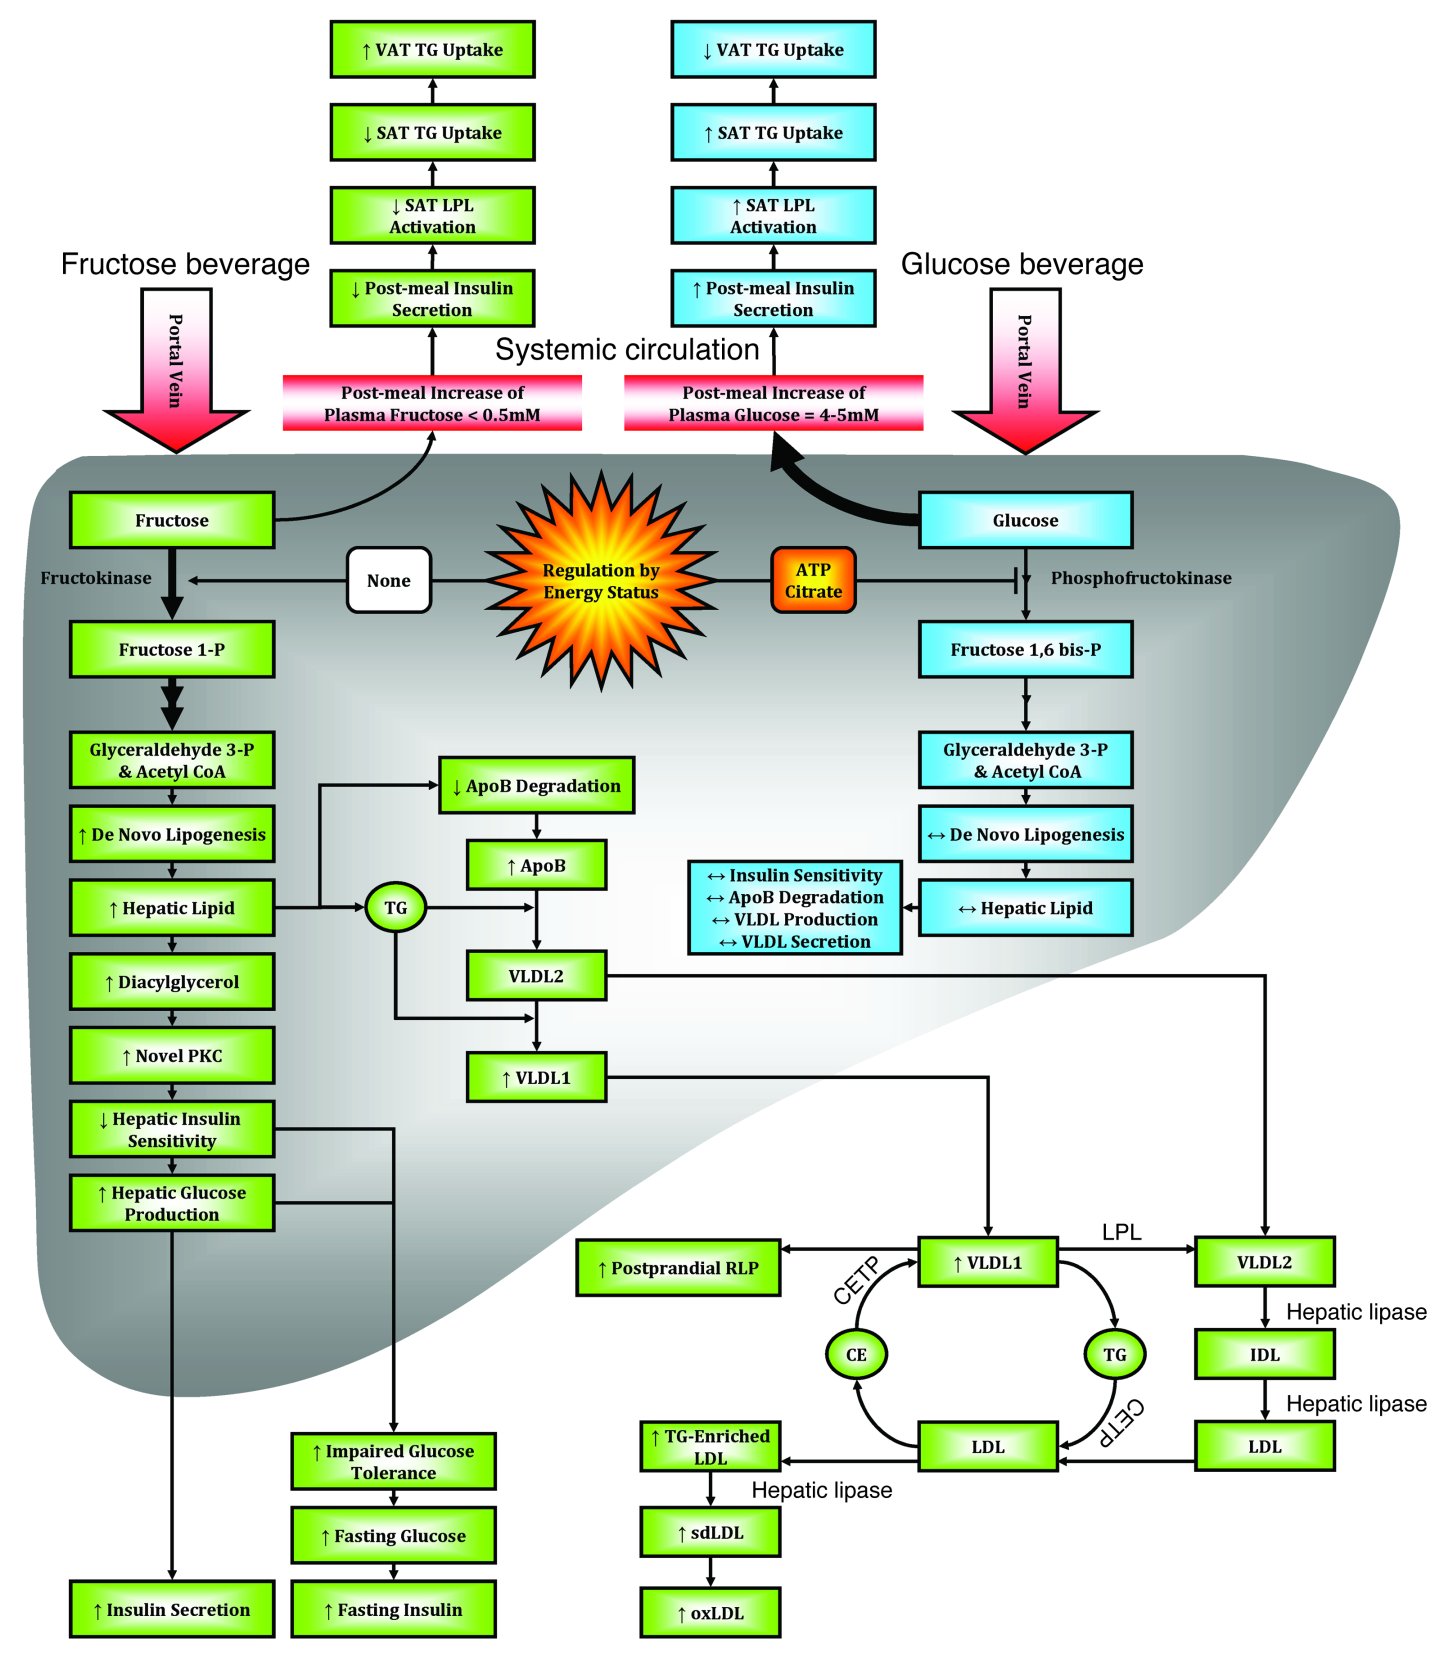
Fructose alone is poorly absorbed from the gastro-intestinal tract, but when ingested with glucose, its absorption is enhanced 19, 20. Both fructose and glucose enter the portal blood supply and are then transported to the liver. Since the transport system for fructose is absent in most cells, the liver and kidney are the main site for fructose metabolism. Upon entering the liver, glucose is phosphorylated at the 6-position to form glucose-6-phosphate, whereas fructose is phosphorylated at the 1-position by ketohexokinase to form fructose-1- phosphate 15. The fructose-1-phosphate is readily converted to the backbone of triglyceride, whereas glucose-6-phosphate is not so readily converted to triglyceride because its metabolism is regulated by phosphofructokinase. This probably explains why fructose—but not glucose—stimulates the formation of lipids in the liver and increases circulating levels of triglycerides, particularly at night 21.
To compare the acute effects of fructose and glucose on plasma lipids, Teff and colleagues 22 gave 17 individuals with obesity meals with beverages containing either fructose or glucose that provided 30% of the total calories. Following fructose, the rise in plasma glucose was significantly smaller than after glucose. Following fructose, triglycerides rose almost 200% higher than after glucose, and lactate production was five times greater. Insulin and leptin both rose less in response to fructose than to glucose. These responses in lipids are seen primarily in men, with smaller or limited responses seen in women 23, 24.
Fructose increases thermogenesis and blood pressure more than glucose 25, 26, but both have this effect. When a 75 g oral load of glucose or fructose was given to 17 volunteers, fructose stimulated oxygen consumption more than glucose but produced a much smaller stimulation of insulin 25. Fructose increased the respiratory quotient more than glucose, which is consistent with de novo lipogenesis. Both patients with obesity and patients with diabetes had a similar stimulation of oxygen uptake after infusion of glucose that was smaller than the response to fructose 25.
Effects of Ingesting Fructose Over Several Weeks in Human Subjects
Two carefully conducted 10-week studies compared beverages. In one study, 21 adults received a minimum amount of sugar-containing beverages or sugar-sweetened foods each day for 10 weeks that contributed about 23% to their energy intake (about 2 g sucrose per kg body weight per day) 27. The other 20 received comparable amounts of beverages (80%) or foods (20%) sweetened with aspartame. For their other foods, subjects could select freely from items available at a kiosk run by the study group. After 10 weeks, energy intake had increased by 380 kcal/day (1600 kJ/day) and sucrose to 28% of calorie intake in the group receiving the sugar-containing beverages. Protein and fat intakes declined. Body weight and fat mass increased by 1.6 and 1.3 kg respectively in the sugared-beverage group and decreased by 1.0 and 0.3 kg in the aspartame-sweetened group. Blood pressure increased by 3.8/4.1 mm Hg in the sugared-beverage consuming group but did not change in the other group, mimicking the acute response of blood pressure to fructose 26. Concentrations of several inflammatory markers were also changed. In the group consuming sucrose, haptoglobin increased by 13%, transferrin by 5%, and C-reactive protein by 6%, whereas in the group receiving the aspartame-sweetened beverages, haptoglobin decreased by 16%, C-reactive protein decreased by 26% and transferrin was basically unchanged with a small 2% fall 28.
In a second 10-week study, fructose or glucose were provided as 25% solutions as part of the total diet. Stanhope and co-workers 21 found that visceral fat was significantly increased in the group drinking fructose-containing beverages. When 32 men and women ate a diet with 15% protein, 30% fat, and 55% carbohydrate, with either 25% of calories as glucose-sweetened beverages or as fructose-sweetened beverages, visceral fat increased by 14% in the fructose-consuming group compared to about 5% in the control group, with no significant change in body weight or subcutaneous fat. De novo lipogenesis increased and post-prandial triglycerides increased, particularly at night 21.
What is Fructose Intolerance
Fructose intolerance 29 may refer to:
- Fructose malabsorption, a digestive disorder of the small intestine in which the fructose carrier in enterocytes is deficient
- Hereditary fructose intolerance, a hereditary condition caused by a deficiency of liver enzymes that metabolise fructose
When your digestive system doesn’t absorb fructose properly, it can cause abdominal pain, diarrhea and gas. People who have fructose intolerance should limit high-fructose foods, such as juices, apples, grapes, watermelon, asparagus, peas and zucchini. Some lower fructose foods — such as bananas, blueberries, strawberries, carrots, avocados, green beans and lettuce — may be tolerated in limited quantities with meals 30.
Foods with high fructose content
According to the USDA database 31, foods with more fructose than glucose include:
Read product labels carefully and avoid foods containing:
- Fructose
- High-fructose corn syrup
- Honey
- Agave syrup
- Invert sugar
- Maple-flavored syrup
- Molasses
- Palm or coconut sugar
- Sorghum
Consult a registered dietitian for a complete list of foods you should eat or avoid if you have fructose intolerance. The dietitian can also help you create a healthy diet plan for you to make sure you get the nutrients you need.
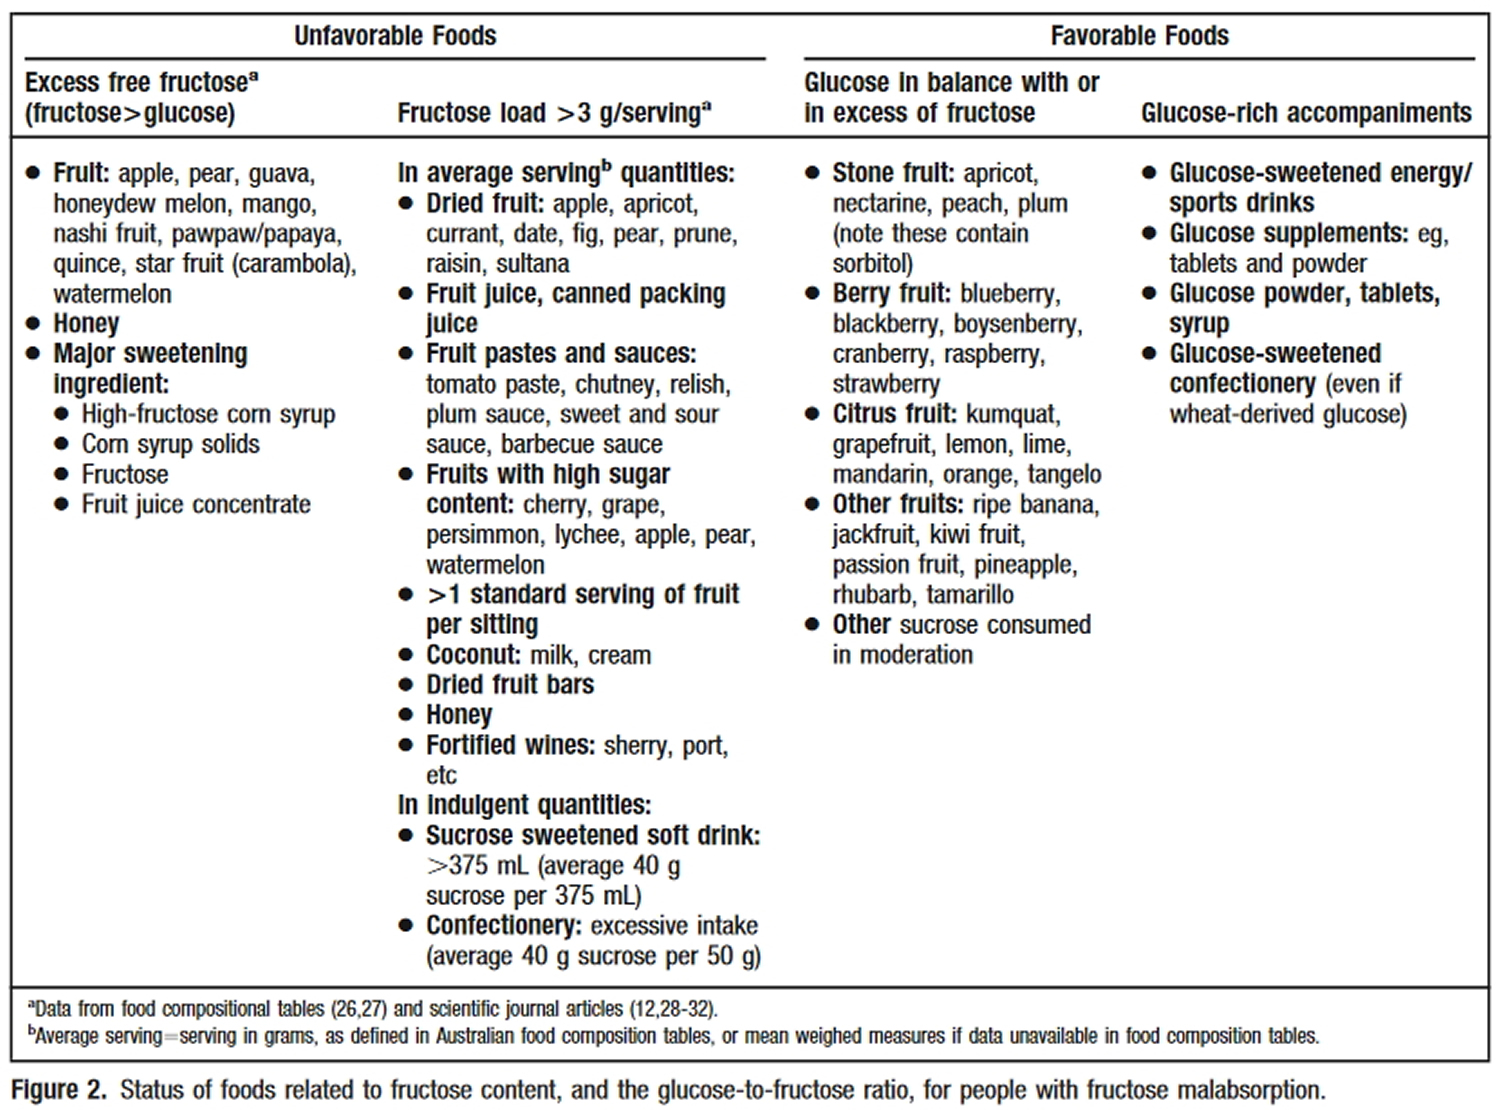
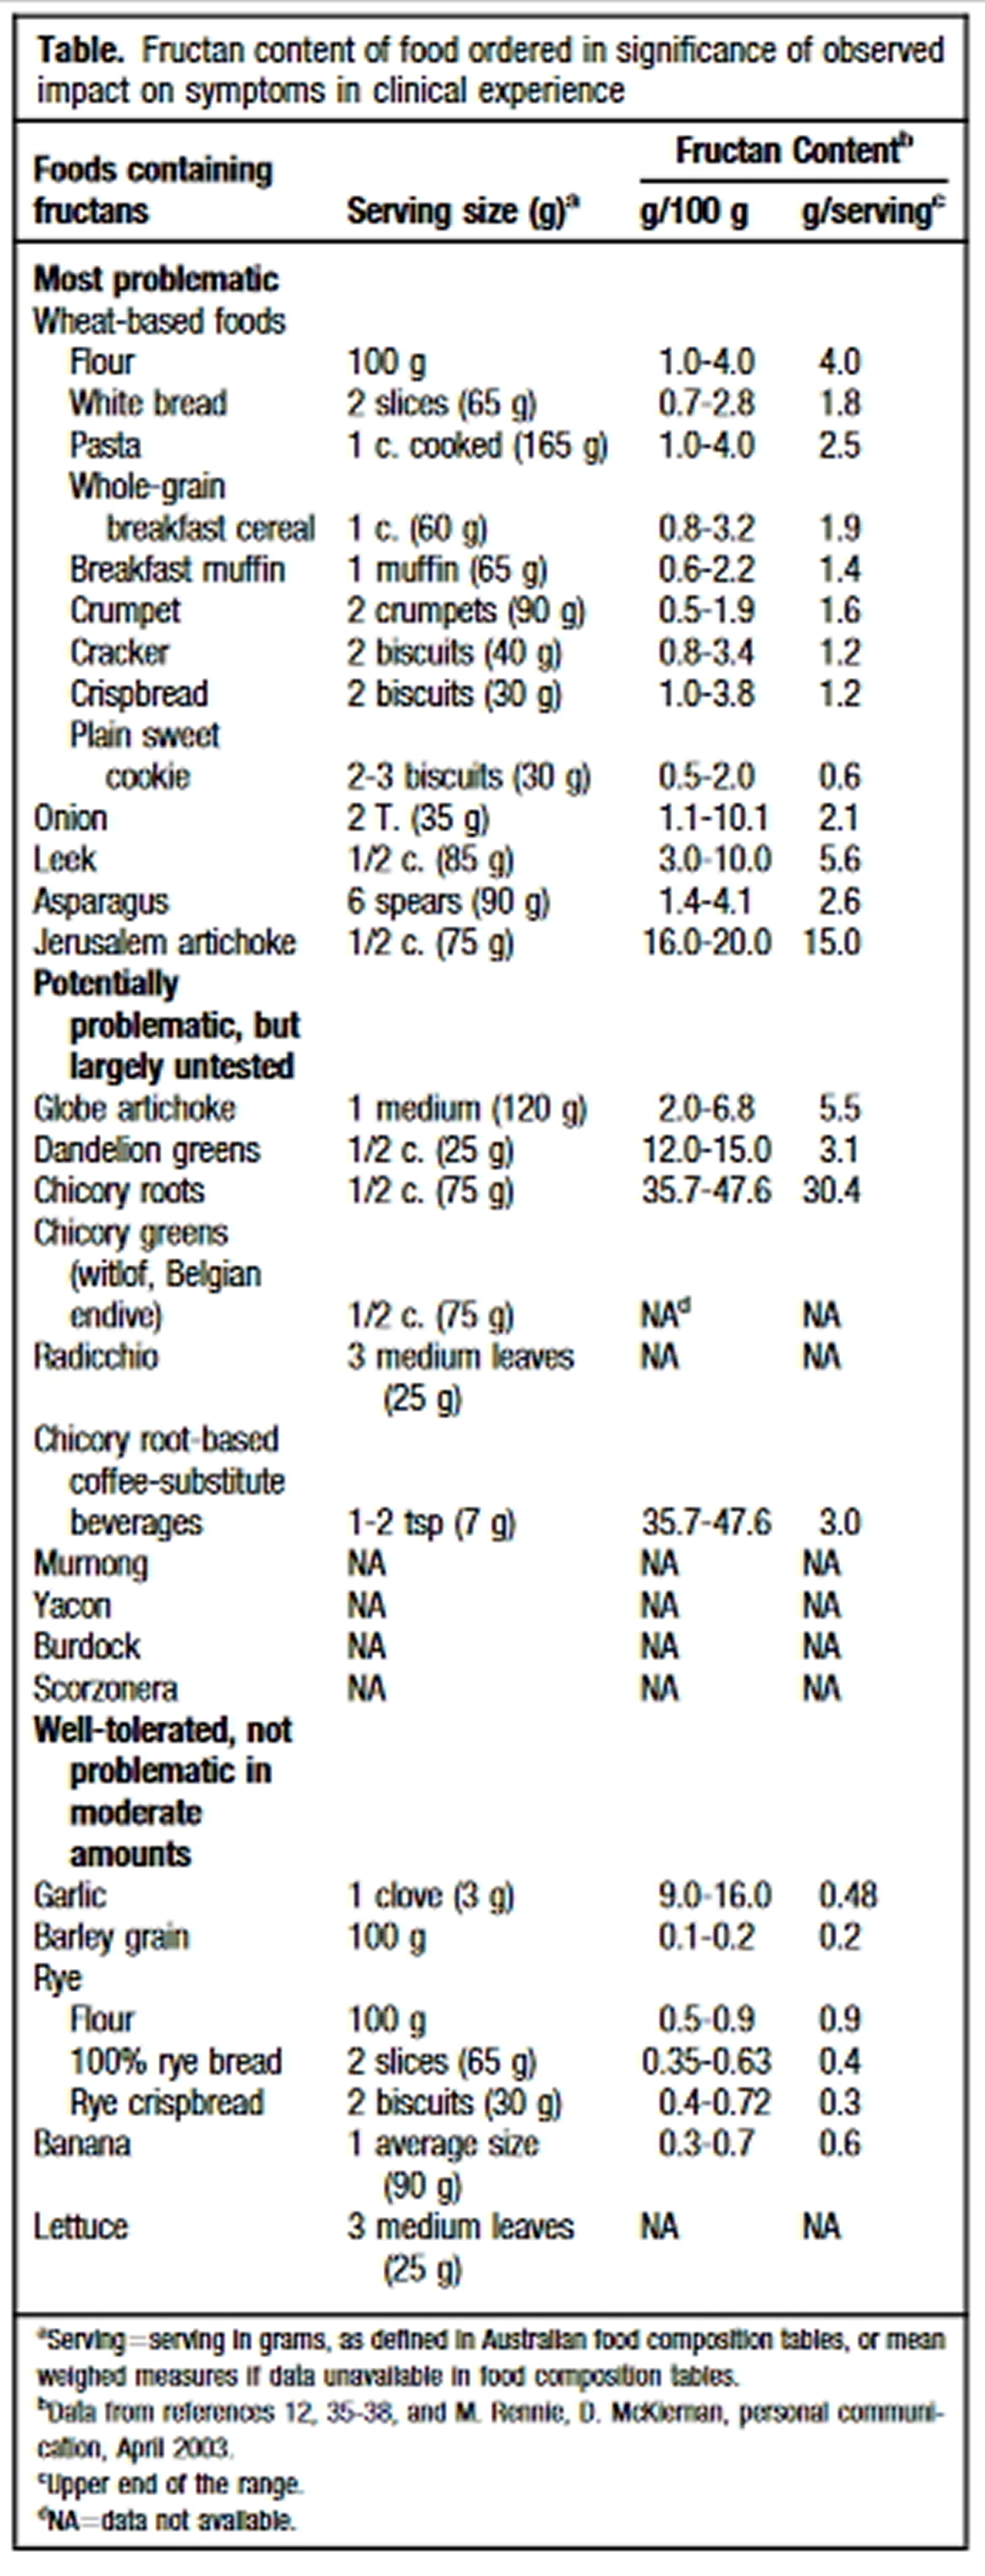
Researchers at Monash University in Australia developed dietary guidelines 32 for managing fructose malabsorption, particularly for individuals with Irritable Bowel Syndrome (IBS).
Fructose Malabsorption
Fructose malabsorption, formerly named “dietary fructose intolerance” 33, is a digestive disorder 34 in which absorption of fructose is impaired by deficient fructose carriers in the small intestine’s enterocytes. This results in an increased concentration of fructose in the entire intestine.
Failure to completely absorb fructose in the small intestine (that is, fructose malabsorption) leads to its delivery to the colonic lumen, together with water due
to its osmotic effect. Luminal bacteria rapidly ferment fructose to hydrogen, carbon dioxide, and short-chain fatty acids 35. Thus, if sufficient fructose reaches the colon, luminal distention may occur due to the osmotic load and rapid gas production, which potentially leads to bloating, abdominal discomfort, and motility changes. The osmotic load itself might also have a laxative effect similar to that utilized by the commonly used disaccharide laxative lactulose. Fructose malabsorption is not to be confused with hereditary fructose intolerance, a potentially fatal condition in which the liver enzymes that break up fructose are deficient.
Provocation studies in which fructose loads are given to people with fructose malabsorption induce gas, bloating, abdominal discomfort, nausea, and disturbed bowel function much more readily in subjects with irritable bowel syndrome than in those without it 36, 37, 38. These observations have led to the suggestion that malabsorption of dietary fructose trigger symptoms in patients with irritable bowel syndrome (IBS) and that removal of fructose from the diet might lead to improvement in symptoms. Open studies of modifying fructose intake have strongly supported this view 39, 40.
- Unfavorable foods (i.e. more fructose than glucose)
Fruit – apple, pear, guava, honeydew melon, nashi pear, pawpaw, papaya, quince, star fruit, watermelon;
Dried fruit – apple, currant, date, fig, pear, raisin, sultana;
Fortified wines
Foods containing added sugars, such as agave nectar, some corn syrups, and fruit juice concentrates.
- Favorable foods (i.e. fructose equal to or less than glucose)
The following list of favorable foods was cited in the paper: “Fructose malabsorption and symptoms of Irritable Bowel Syndrome Guidelines for effective dietary management” 41.
Stone fruit: apricot, nectarine, peach, plum (caution – these fruits contain sorbitol);
Berry fruit, blackberry, boysenberry, cranberry, raspberry, strawberry, loganberry;
Citrus fruit: kumquat, grapefruit, lemon, lime, mandarin, orange, tangelo;
Other fruits: ripe banana, jackfruit, passion fruit, pineapple, rhubarb, tamarillo.
Occurrence in patients identified to be suffering symptoms of irritable bowel syndrome (IBS) is not higher than occurrence in the normal population. However, due to the similarity in symptoms, patients with fructose malabsorption often fit the profile of those with irritable bowel syndrome 42. In some cases, fructose malabsorption may be caused by several diseases which cause an intestinal damage, such as celiac disease 43.
(Source 44).
In conclusion, a comprehensive new diet directed at limiting fructose and fructan intake has been developed on the basis of physiological principles and food composition tables. Application of the diet to patients with IBS and fructose malabsorption has revealed a high level of sustained adherence associated with a high rate of symptomatic improvement. Unanswered questions include whether the response is due to reduced free fructose and/or fructan intake, to some other factor in the diet, or to a placebo effect 45.
Hereditary Fructose Intolerance
Hereditary fructose intolerance is an inborn error of fructose metabolism caused by a deficiency of the enzyme aldolase B. Individuals affected with hereditary fructose intolerance are asymptomatic until they ingest fructose, sucrose, or sorbitol. If fructose is ingested, the enzymatic block at aldolase B causes an accumulation of fructose-1-phosphate. This accumulation has downstream effects on gluconeogenesis and regeneration of adenosine triphosphate (ATP).
Symptoms of hereditary fructose intolerance include vomiting, hypoglycemia, jaundice, hemorrhage, hepatomegaly, hyperuricemia and potentially kidney failure. While hereditary fructose intolerance is not clinically a devastating condition, there are reported deaths in infants and children as a result of the metabolic consequences of hereditary fructose intolerance. Death in hereditary fructose intolerance is always associated with problems in diagnosis 46.
Hereditary fructose intolerance is an autosomal recessive condition caused by mutations in the ALDOB gene, located at 9q22.3. Hereditary fructose intolerance is typically suspected based on dietary history, especially in infants who become symptomatic after breast feeding. This suspicion is typically confirmed by molecular analysis. Treatment of hereditary fructose intolerance involves strict avoidance of fructose in the diet. Older patients with hereditary fructose intolerance typically self-select a diet low in fructose, even before being diagnosed.
The key identifying feature of hereditary fructose intolerance is the appearance of symptoms with the introduction of fructose to the diet 47, 48. Affected individuals are asymptomatic and healthy, provided they do not ingest foods containing fructose or any of its common precursors, sucrose and sorbitol. In the past, infants often became symptomatic when they were introduced to formulas that were sweetened with fructose or sucrose. These sweeteners are not common in formulas used today 47. Symptoms such as vomiting, nausea, restlessness, pallor, sweating, trembling and lethargy can also first present in infants when they are introduced to fruits and vegetables. These can progress to apathy, coma and convulsions if the source is not recognized early 47.
When patients are diagnosed with hereditary fructose intolerance, a dietary history will often reveal an aversion to fruit and other foods that contain large amounts of fructose. Most adult patients do not have any dental caries.
Hereditary Fructose Intolerance Diagnosis
Because of the ease of therapy (dietary exclusion of fructose), hereditary fructose intolerance can be effectively managed if properly diagnosed. In hereditary fructose intolerance, the diagnosis of homozygotes is difficult, requiring a genomic DNA screening with allele specific probes or an enzyme assay from a liver biopsy. Once identified, parents of infants who carry mutant aldolase B alleles leading to hereditary fructose intolerance, or older individuals who have clinical histories compatible with hereditary fructose intolerance can be identified and counselled with regard to preventive therapy: dietary exclusion of foods containing fructose, sucrose, or sorbitol. If possible, individuals who suspect they might have hereditary fructose intolerance, should avoid testing via fructose challenge as the results are non-conclusive for individuals with hereditary fructose intolerance and even if the diagnostic administration fructose is properly controlled, profound hypoglycemia and its sequelae can threaten the patient’s well-being 46.
Hereditary Fructose Intolerance Treatment
Treatment of hereditary fructose intolerance depends on the stage of the disease, and the severity of the symptoms. Stable patients without acute intoxication events are treated by careful dietary planning that avoids fructose and its metabolic precursors. Fructose is replaced in the diet by glucose, maltose or other sugars. Management of patients with hereditary fructose intolerance often involves dietitians who have a thorough knowledge of what foods are acceptable 47.
Absorption and Metabolism of Fructose
Fructose is directly absorbed across the brush border of the small intestine into enterocyte by glucose transporter 5 (GLUT5) 49, and transported out of the enterocytes into systemic circulation by GLUT2, located at the basolateral pole 49. The transported fructose is delivered into the systemic circulatory system and absorbed mainly in liver.
More than 50% of fructose is metabolized via fructolysis in liver. Fructokinase (KHK) catalyzes the first phosphorylation reaction to produce fructose-1-phosphate (fructose-1-P) and initiates fructose catabolism 50. Aldolase B catalyzes the lysis of fructose-1-P to generate dihydroxyacetone phosphate (DHAP) and glyceraldehyde, two major components of triose-Ps. DHAP and glyceraldehyde are converted to glucose following the conventional gluconeogenesis. Part of DHAP and glyceraldehyde are converted into lactate and released into circulation, others can be reversibly metabolized to glycerol-3-phosphate (glycerol-3-P), and catalyzed by glyceraldehyde kinase. MG synthase catalyzes glycerol-3-P and/or DHAP to produce MG, which is secreted into circulation. Meanwhile, glycerol-3-P forms free fatty acid and triglyceride via de novo lipogenesis (DNL). Diacylglycerol (DAG), an active lipid intermediate, is produced during triglyceride generation. Then triglyceride is packed with apolipoprotein B100 (ApoB100), facilitating VLDL-TG (very low density lipoprotein triglyceride) production and secretion. Glyceraldehyde can also be converted to acetyl-CoA (consecutively catalyzed by glyceraldehyde-3-phosphate dehydrogenase, phosphoglycerate kinase, phosphoglycerate mutase, enolase, pyruvate kinase and pyruvate dehydrogenase), either producing free fatty, or further participating in triglyceride synthesis or entering tricarboxylic acid cycle (TCA) cycle. Another bioactive lipid intermediate, ceramide, is derived from metabolism of palmitic acid (the preliminary products of free fatty acid synthesis). Rapid fructolysis leads to a high level of metabolic stress via ATP depletion 51, increasing AMP degradation to increase UA (uric acid) in liver, finally resulting in blood uric acid elevation. Therefore, glucose, lactate, free fatty acid (FFA), triglyceride (TG), very low density lipoprotein triglyceride (VLDL-TG), diacylglycerol (DAG), ceramide, uric acid (UA) and methylglyoxal (MG) are overproduced and released into systemic circulation. Some of them, such as glucose, lactate, FFA, VLDL-TG, UA and MG, are delivered to extrahepatic tissues, affecting energy hemostasis or impairing tissue and organ functions. High levels of these metabolites are considered to be direct dangerous factors under high fructose condition.
Extrahepatic absorption and metabolism of fructose also take place, since GLUT5 is also widely expressed with high specificity in adipose tissue, kidney, muscle skeletal tissue, testis and brain 49. GLUT2, a low-affinity fructose transporter, is also located significantly in kidney and small intestine 49. It is likely that maximal physiological, postprandial concentration of fructose reaches to 1.0 mmol/L in the portal vein, and remains in the micromolar range in peripheral blood in humans and rodents 50. Therefore, extrahepatic fructose uptake does not occur to a significant extent due to its very low blood level.
During the fructolysis, a high level of metabolic stress via ATP depletion is detected 51. ATP depletion causes oxidative stress and inflammatory response to disturb the function of tissues and organs, resulting in abnormal production of insulin, inflammatory cytokine, adiponectin, leptin and endotoxin. These indirect dangerous factors are secreted into systemic circulation, further aggravating metabolic burden in tissues and organs and even perturbing appetite and food intake.
What is High Fructose Corn Syrup
High fructose corn syrup is derived from corn starch. Starch itself is a chain of glucose (a simple sugar) molecules joined together. When corn starch is broken down into individual glucose molecules, the end product is corn syrup, which is essentially 100% glucose 52.
To make high fructose corn syrup, enzymes are added to corn syrup in order to convert some of the glucose to another simple sugar called fructose, also called “fruit sugar” because it occurs naturally in fruits and berries.
High fructose corn syrup is ‘high’ in fructose compared to the pure glucose that is in corn syrup. Different formulations of high fructose corn syrup contain different amounts of fructose.
The primary differences between sucrose and the common forms of high fructose corn syrup are:
- High fructose corn syrup contains water.
- In sucrose, a chemical bond joins the glucose and fructose. Once you eat sucrose, your stomach acid and gut enzymes rapidly break down this chemical bond.
- In high fructose corn syrup, no chemical bond joins the glucose and fructose.
- How much fructose is in high fructose corn syrup ?
The most common forms of high fructose corn syrup contain either 42 percent or 55 percent fructose, as described in the Code of Federal Regulations (21 CFR 184.1866), and these are referred to in the industry as HFCS 42 and HFCS 55. The rest of the HFCS is glucose and water. HFCS 42 is mainly used in processed foods, cereals, baked goods, and some beverages. HFCS 55 is used primarily in soft drinks 52.
Sucrose (sugar), the most well-known sweetener, is made by crystallizing sugar cane or beet juice. Sucrose is also made up of the same two simple sugars, glucose and fructose, joined together to form a single molecule containing one glucose molecule and one fructose molecule, an exact one-to-one ratio.
The proportion of fructose to glucose in both high fructose corn syrup 42% fructose (HFCS 42) and high fructose corn syrup 55% fructose (HFCS 55) is similar to that of sucrose.
Other nutritive sweeteners can vary in their fructose content (by “nutritive,” we mean that the sweetener contains calories). Honey is a common nutritive sweetener with an approximately one-to-one ratio of fructose to glucose. Fruit and nectar-based sweeteners may have more fructose than glucose, especially those that come from apples and pears.
- Is high fructose corn syrup less safe than other sweeteners ?
FDA receives many inquiries asking about the safety of high fructose corn syrup, often referring to studies about how humans metabolize fructose or fructose-containing sweeteners. These studies are based on the observation that there are some differences between how we metabolize fructose and other simple sugars.
The FDA 52 are not aware of any evidence, including the studies mentioned above, that there is a difference in safety between foods containing high fructose corn syrup 42% fructose (HFCS 42) or high fructose corn syrup 55% fructose (HFCS 55) and foods containing similar amounts of other nutritive sweeteners with approximately equal glucose and fructose content, such as sucrose, honey, or other traditional sweeteners. The 2015-2020 Dietary Guidelines for Americans 53 recommend that everyone limit consumption of all added sugars, including high fructose corn syrup and sucrose. The FDA 52 participated in the development of the Dietary Guidelines and fully supports this recommendation.
The role of Fructose in the pathogenesis of Non-alcoholic Fatty Liver Disease (NAFLD) and the Metabolic Syndrome 54
Too much fructose can damage your liver, just like too much alcohol.
A century ago, the average person took in about 15 grams of fructose a day (roughly half an ounce), mostly from eating fruits and vegetables. Today, we get more than triple that amount, almost all of it from the refined sugars and high-fructose corn syrup used to make breakfast cereals, pastries, soda and fruit drinks, and other sweet foods. Given the way the body breaks down fructose, that increase may be contributing to liver and heart disease, reports the September 2011 issue of the Harvard Heart Letter 55.
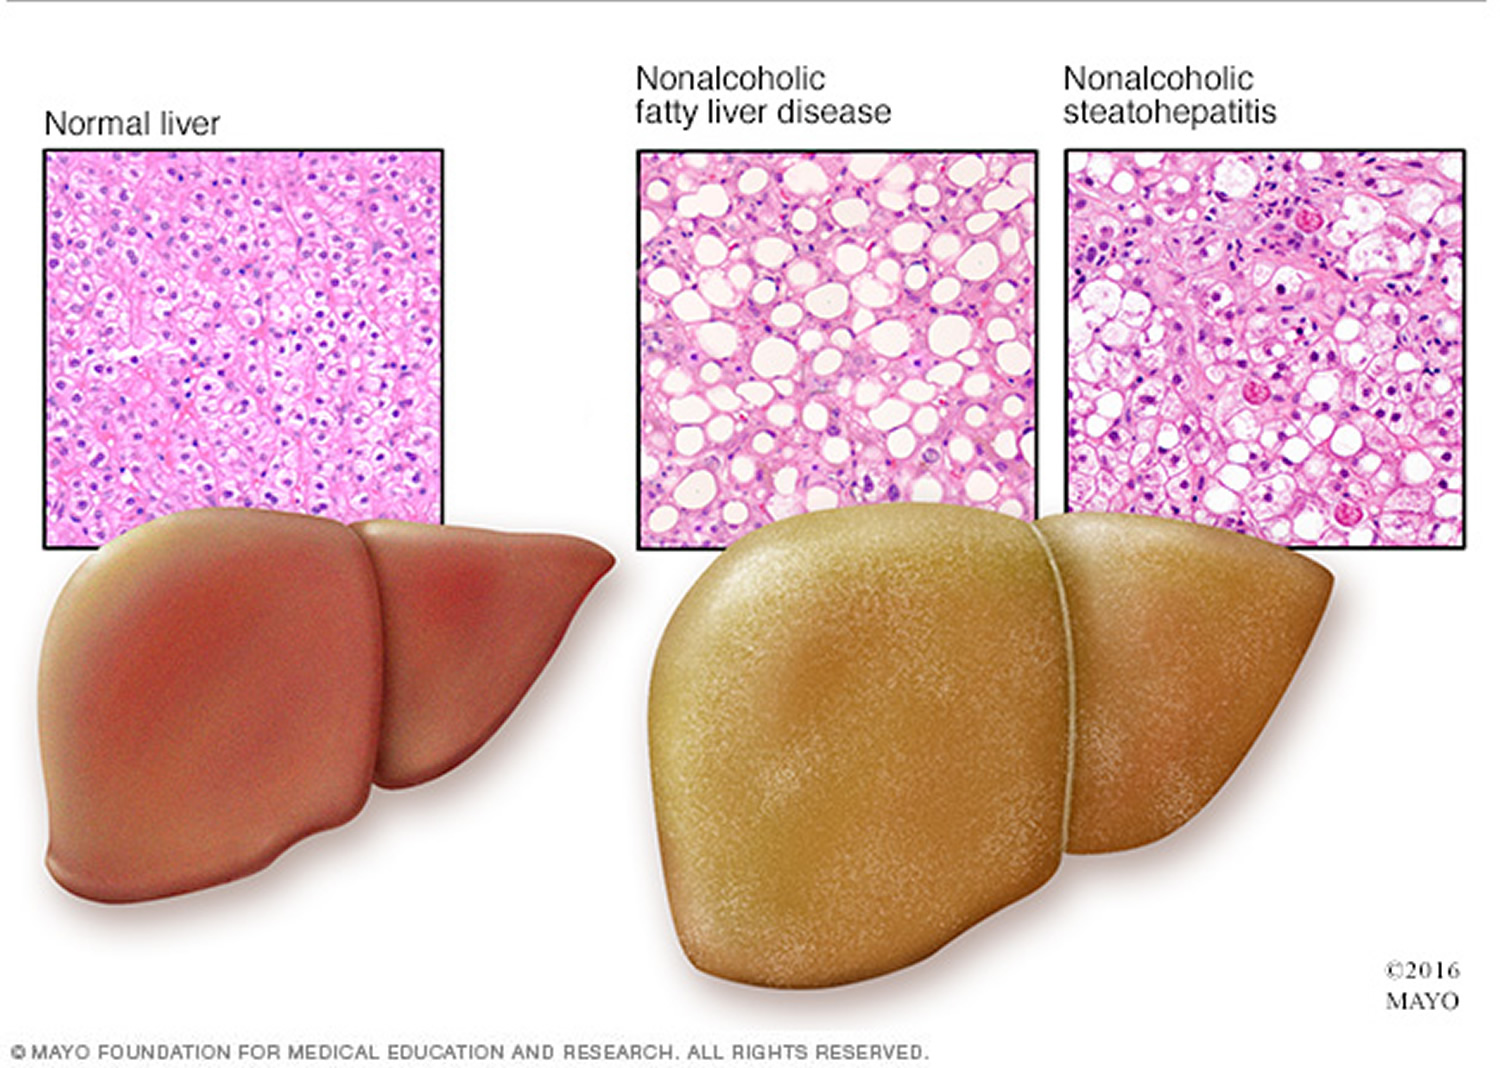
Liver cells are the only cells in the body that metabolize fructose. Surprisingly, fat is a key byproduct of the breakdown of fructose. Give the liver enough fructose, and tiny fat droplets begin to accumulate in the organ. This buildup is called nonalcoholic fatty liver disease. If it becomes severe enough, it can cause serious liver damage.
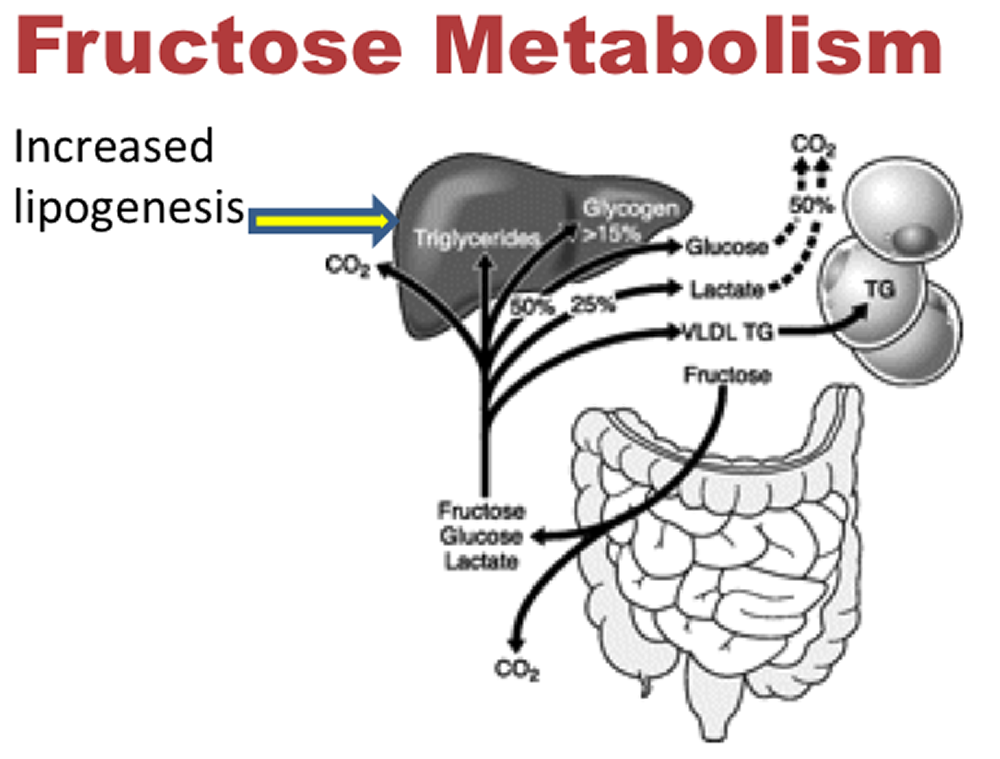
The entry of fructose into the liver kicks off a series of complex chemical transformations (see the diagram below) 56. One remarkable change is that the liver uses fructose, a carbohydrate, to create fat. This process is called lipogenesis. Give the liver enough fructose, and tiny fat droplets begin to accumulate in liver cells (see the picture of fatty liver below). This buildup is called nonalcoholic fatty liver disease, because it looks just like what happens in the livers of people who drink too much alcohol.
Virtually unknown before 1980, nonalcoholic fatty liver disease now affects up to 30% of adults in the United States and other developed countries, and between 70% and 90% of those who are obese or who have diabetes.
Early on, nonalcoholic fatty liver disease is reversible. At some point, though, the liver can become inflamed. This can cause the low-grade damage known as nonalcoholic steatohepatitis (steato meaning fat and hepatitis meaning liver inflammation). If the inflammation becomes severe, it can lead to cirrhosis — an accumulation of scar tissue and the subsequent degeneration of liver function 57.
Fructose Metabolism in the Liver
(Source 56).
The breakdown of fructose in the liver does more than lead to the buildup of fat. It also:
- elevates triglycerides
- increases harmful LDL (so-called bad cholesterol)
- promotes the buildup of fat around organs (visceral fat)
- increases blood pressure
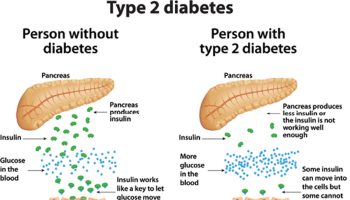
- makes tissues insulin-resistant, a precursor to diabetes
- increases the production of free radicals, energetic compounds that can damage DNA and cells.
- None of these changes are good for the arteries and the heart.
Researchers have begun looking at connections between fructose, fatty liver disease, and cardiovascular disease. The early results are in line with changes listed above due to the metabolism of fructose.
An article published in 2010 in The New England Journal of Medicine indicated that people with nonalcoholic fatty liver disease are more likely than those without it to have buildups of cholesterol-filled plaque in their arteries. They are also more likely to develop cardiovascular disease or die from it. In fact, people with nonalcoholic fatty liver disease are far more likely to die of cardiovascular disease than liver disease.
A report from the Framingham Heart Study has linked nonalcoholic fatty liver disease with metabolic syndrome, a constellation of changes that is strongly associated with cardiovascular disease. Other studies have linked fructose intake with high blood pressure.
High dietary fructose is a major contributor to insulin resistance and metabolic syndrome, disturbing tissue and organ functions. Fructose is mainly absorbed into systemic circulation by glucose transporter 2 (GLUT2) and GLUT5, and metabolized in liver to produce glucose, lactate, triglyceride (TG), free fatty acid (FFA), uric acid (UA) and methylglyoxal (MG). Its extrahepatic absorption and metabolism also take place. High levels of these metabolites are the direct dangerous factors. During fructose metabolism, ATP depletion occurs and induces oxidative stress and inflammatory response, disturbing functions of local tissues and organs to overproduce inflammatory cytokine, adiponectin, leptin and endotoxin, which act as indirect dangerous factors. Fructose and its metabolites directly and/or indirectly cause oxidative stress, chronic inflammation, endothelial dysfunction, autophagy and increased intestinal permeability, and then further aggravate the metabolic syndrome with tissue and organ dysfunctions. Therefore, this review addresses fructose-induced metabolic syndrome, and the disturbance effects of direct and/or indirect dangerous factors on the functions of liver, adipose, pancreas islet, skeletal muscle, kidney, heart, brain and small intestine. It is important to find the potential correlations between direct and/or indirect risk factors and healthy problems under excess dietary fructose consumption 2.
Nonalcoholic fatty liver disease (NAFLD) is the most frequent liver disease worldwide, and is commonly associated with the metabolic syndrome. Secular trends in the prevalence of these diseases may be associated with the increased fructose consumption observed in the Western diet. NAFLD is characterized by two steps of liver injury: intrahepatic lipid accumulation (hepatic steatosis), and inflammatory progression to nonalcoholic steatohepatitis (NASH) (the ‘two-hit’ theory). In the first ‘hit’, hepatic metabolism of fructose promotes de novo lipogenesis and intrahepatic lipid, inhibition of mitochondrial β-oxidation of long-chain fatty acids, triglyceride formation and steatosis, hepatic and skeletal muscle insulin resistance, and hyperglycemia. In the second ‘hit’, owing to the molecular instability of its five-membered furanose ring, fructose promotes protein fructosylation and formation of reactive oxygen species (ROS), which require quenching by hepatic antioxidants. Many patients with NASH also have micronutrient deficiencies and do not have enough antioxidant capacity to prevent synthesis of ROS, resulting in necroinflammation. We postulate that excessive dietary fructose consumption may underlie the development of NAFLD and the metabolic syndrome. Furthermore, we postulate that NAFLD and alcoholic fatty liver disease share the same pathogenesis.
Only industrial, not fruit fructose intake was associated with declining liver function. Same thing with high blood pressure. Fructose from added sugars was associated with hypertension; fructose from natural fruits is not. If you compare the effects of a diet restricting fructose from both added sugars and fruit to one just restricting fructose from added sugars, the diet that kept the fruit did better. People lost more weight with the extra fruit present than if all fructose was restricted.
These deleterious effects of fructose were limited to industrial fructose, meaning table sugar and high fructose corn syrup, with no evidence for a negative effect of the fructose in whole fruit. This apparent inconsistency might be explained by the positive effects of other nutrients (e.g., fiber) and antioxidants in fresh fruit.
But today, manufacturers extract and concentrate the fructose from corn, beets and sugarcane, removing the fiber and nutrients in the process. Getting frequent, high doses of fructose throughout the day, without fiber to slow it down, is more than our bodies were designed to handle.
- 31% of American adults and 13% of kids suffer from Non-Alcoholic Fatty Liver Disease (fatty liver that is not caused by drinking too much alcohol). Non-Alcoholic Fatty Liver Disease happens to people who are overweight, have diabetes, high cholesterol or high triglycerides in their blood.
- Non-alcoholic fatty liver disease (NAFLD): is characterized by excess fat build-up in the liver.
- What is alarming about NAFLD is that it can progress to Non-Alcoholic Steatohepatitis (NASH).
- Non-Alcoholic Steatohepatitis (NASH): is characterized by fatty liver, inflammation and “steatosis,” which is essentially scarring as the liver tries to heal its injuries. That scarring gradually cuts off vital blood flow to the liver. Most people with NASH also have Type II diabetes.
- Eating a lot of trans-fats, being overweight and not exercising also can contribute to NASH.
- Non-Alcoholic Steatohepatitis (NASH) is now the third-leading reason for liver transplantation in America
Nearly all added sugars contain significant amounts of fructose. Typical formulations of high-fructose corn syrup contain upwards of 50% fructose, depending on processing methods. Table sugar and even sweeteners that sound healthy, like organic cane sugar, are 50% fructose.
What’s unique about fructose is that, unlike any other sugar, it’s processed in the liver. Small amounts of fructose, meted out slowly, are not a problem for your liver. Think of eating an apple – its sweetness comes with a lot of chewing that takes time. The apple’s fiber slows down its processing in the gut.
But when we consume large amounts of fructose in added sugar, particularly in liquid form on an empty stomach, it slams the liver with more than it can handle.
As with alcohol, a little added fructose, consumed with fiber-rich foods, is OK. It’s only when we frequently consume large quantities, in concentrated form, that fructose becomes a health hazard.
Table 1: Pathological changes of major organs and molecular mechanisms of tissue dysfunction under high fructose condition.
| Organs Histopathological Changes | Dangerous Factors | Pathological Indexes | |
|---|---|---|---|
| ↑ | ↓ | ||
| Adipose tissue Inflammation response Endothelial dysfunction | FFA UA | ROS production Inflammatory cytokine flux FFA uptake Adiponectin secretion Lipid accumulation Autophagy | Insulin sensitivity Leptin sensitivity Glucose uptake Oxygen availability |
| Brain Appetite increase Psychological stress | FFA UA MG | ROS production Inflammation cytokine flux Food intake | Insulin sensitivity Leptin sensitivity |
| Heart/vessel Hypertrophy Endothelial dysfunction Plaque formation Vascular stiffness | FFA UA | ROS production FFA uptake Vascular tone RAGE production Blood pressure | Insulin sensitivity Glucose consumption Vascular vasodilation |
| Intestine Increased intestinal permeability | UA | Endotoxin translocation Bacterial composition disturbance Dysregulation of tight junction protein | Insulin sensitivity |
| Kidney CKD Endothelial dysfunction | UA MG | ROS production Inflammatory cytokine flux Dysregulation of renal organic ion transporters NO production Urine sodium retention | Insulin sensitivity UA clearance |
| Liver Steatosis NAFLD Fibrogenesis Endothelial dysfunction | Lactate FFA DAG Ceramide UA MG | Gluconeogenesis Glucose export ROS production DNL Inflammatory cytokine flux Lipid accumulation Mitochondrial dysfunction VLDL-secretion | Insulin sensitivity Glucose consumption Glucose uptake Oxygen availability |
| Pancreatic islet Glucose intolerance Increased β-cell mass Irregular insulin secretion | Glucose FFA UA | Inflammatory cytokines flux ER stress Apoptosis | Insulin sensitivity Leptin sensitivity |
| Skeletal muscle Inflammation response Endothelial dysfunction | Lactate FFA Ceramide UA | ROS production FFA uptake Autophagy Inflammatory cytokine flux Lipid accumulation | Insulin sensitivity Glucose uptake Oxygen availability |
How do you know if you have a liver problem ?
You should be concerned if you or your kids have a “sugar belly” or belly fat. If your waist is larger than your hips, you should ask your doctor for a blood test that checks for triglyceride levels.
A sugar belly occurs when the liver detects more fructose than can be used by the body for energy. That excess fructose is broken down by the liver and transformed into fat globules (triglycerides), some of which are exported into the bloodstream and selectively deposited around your midsection and internal organs. Just as people who drink too much alcohol get a “beer belly,” those who eat or drink too much fructose can get a “sugar belly.”
Fat cells that accumulate around your midsection send out disruptive hormonal messages that upset your body’s normal chemical balance. Scientists are actively studying how these hormonal imbalances become implicated in a wide variety of diseases, including heart disease, stroke, diabetes, cancer and Alzheimer’s disease.
Conclusion
Virtually every cell in the body can use glucose for energy. In contrast, only liver cells break down fructose. What happens to fructose inside liver cells is complicated. One of the end products is triglyceride, a form of fat. Uric acid and free radicals are also formed.
Fructose is widely found in natural foods, including fruits, vegetables and honeys, and is added to commercial food additives. Over consumption of fructose is a risk factor for the epidemic of metabolic syndrome, with dysfunctions in multiple tissues and organs including liver, adipose, pancreatic islet, skeletal muscle, kidney, heart, brain and intestine.
Fruit is good for you and is a minor source of fructose for most people. The big sources are refined sugar and high-fructose corn syrup.
The primary metabolites from fructolysis are produced in liver and secreted into system circulation, directly affecting tissue and organ functions; among these free fatty acids (FFA), uric acid (UA) and lactate play central roles in inducing insulin resistance in systemic and local tissue and organ, as well as causing reactive oxygen species (ROS) overproduction. These dysfunction events consequently lead to secretion of indirect dangerous factors, such as inflammatory cytokine, adiponectin, leptin and endotoxin. These indirect adverse factors give rise to inflammatory response, lipid accumulation, and endothelial dysfunction in local tissues and organs, in addition to the appetite disturbance for food intake, further aggravating the metabolic burden of fructose. Discussion of these direct and indirect adverse molecules in circulation helps us to uncover the clues for tissue and organ function disturbance and their correlation (see Table 1 above). These adverse effects of high fructose consumption remind us to be cautious about excess fructose intake in our daily diet. More importantly, relevant government departments should make policies about the quality standard and safety of food additives to improve supervisions.
Experts still have a long way to go to connect the dots between fructose and nonalcoholic fatty liver disease, obesity, diabetes, heart disease, and cancer. Higher intakes of fructose are associated with these conditions, but clinical trials have yet to show that it causes them. There are plenty of reasons to avoid sugary drinks and foods with added sugar, like empty calories, weight gain, and blood sugar swings.
The American Heart Association does not distinguish between types of added sugars — to your body they’re identical. Instead, focus on your total intake because eating too much added sugar leads to being overweight and obese, which are risk factors for diabetes 58. The American Heart Association also recommends that most women get no more than 100 calories a day of added sugar from any source, and that most men get no more than 150 calories a day of added sugar. That’s about 6 teaspoons of added sugar for women and 9 teaspoons for men by limiting the amount of sugar you get from sugar-sweetened drinks, pastries, desserts, breakfast cereals, and more, mainly to avoid gaining weight. The same strategy could also protect your liver and your arteries.
References- Rumessen JJ. Fructose and food related carbohydrates. Sources, intake, absorption, and clinical implications. Scand J Gastroenterol. 1992;27:819-828.
- Nutrients. 2017 Apr; 9(4): 335. High Dietary Fructose: Direct or Indirect Dangerous Factors Disturbing Tissue and Organ Functions. https://www.ncbi.nlm.nih.gov/pmc/articles/PMC5409674/
- Harvard University. Harvard Health Publication. Abundance of fructose not good for the liver, heart. Published: September, 2011. http://www.health.harvard.edu/heart-health/abundance-of-fructose-not-good-for-the-liver-heart
- Am J Clin Nutr. 2004 Apr;79(4):537-43. Consumption of high-fructose corn syrup in beverages may play a role in the epidemic of obesity. https://www.ncbi.nlm.nih.gov/pubmed/15051594/
- Lim J.S., Mietus-Snyder M., Valente A., Schwarz J.M., Lustig R.H. The role of fructose in the pathogenesis of NAFLD and the metabolic syndrome. Nat. Rev. Gastroenterol. Hepatol. 2010;7:251–264. doi: 10.1038/nrgastro.2010.41. https://www.ncbi.nlm.nih.gov/pubmed/20368739
- Eur J Pharmacol. 2017 Jun 7. pii: S0014-2999(17)30398-9. doi: 10.1016/j.ejphar.2017.06.003. Fructose-rich diet and insulin action in female rat heart: Estradiol friend or foe ? – http://www.sciencedirect.com/science/article/pii/S0014299917303989
- Nutr Rev. 2005 May;63(5):133-57. Dietary fructose: implications for dysregulation of energy homeostasis and lipid/carbohydrate metabolism. https://www.ncbi.nlm.nih.gov/pubmed/15971409/
- Circulation. 2010 Mar 23;121(11):1356-64. doi: 10.1161/CIRCULATIONAHA.109.876185. Sugar-sweetened beverages, obesity, type 2 diabetes mellitus, and cardiovascular disease risk. https://www.ncbi.nlm.nih.gov/pubmed/20308626/
- J Am Diet Assoc. 2006 Dec;106(12):1956-61. Fluid energy–Where’s the problem ? https://www.ncbi.nlm.nih.gov/pubmed/17126624/
- J Am Diet Assoc. 2009 Mar; 109(3): 430–437. Effects of food form and timing of ingestion on appetite and energy intake in lean and obese young adults. https://www.ncbi.nlm.nih.gov/pmc/articles/PMC2680008/
- Physiol Behav. 1990 Jul;48(1):19-26. Effects of drinks sweetened with sucrose or aspartame on hunger, thirst and food intake in men. https://www.ncbi.nlm.nih.gov/pubmed/2236270/
- Bray GA, Nielsen SJ, Popkin BM. Consumption of high-fructose corn syrup in beverages may play a role in the epidemic of obesity. Am J Clin Nutr. 2004;79(4):537–543. https://www.ncbi.nlm.nih.gov/pubmed/15051594
- Nutr Rev. 2005 May;63(5):133-57. Dietary fructose: implications for dysregulation of energy homeostasis and lipid/carbohydrate metabolism. https://www.ncbi.nlm.nih.gov/pubmed/15971409
- Johnson RJ, Perez-Pozo SE, Sautin YY, Manitius J, Sanchez-Lozada LG, Feig DI, Shafiu M, Segal M, Glassock RJ, Shimada M, Roncal C, Nakagawa T. Hypothesis: could excessive fructose intake and uric acid cause type 2 diabetes? Endo Rev. 2009;30(1):96–116. https://www.ncbi.nlm.nih.gov/pmc/articles/PMC2647706/
- Cirillo P, Gersch MS, Mu W, Scherer PM, Kim KM, Gesualdo L, Henderson GN, Johnson RJ, Sautin YY. Ketohexokinase-dependent metabolism of fructose induces proinflammatory mediators in proximal tubular cells. J Am Soc Nephrol. 2009;20(3):545–553. https://www.ncbi.nlm.nih.gov/pmc/articles/PMC2653686/
- Mattes RD. Fluid energy—Where’s the problem? J Am Diet Assoc. 2006;106(12):1956–1961. https://www.ncbi.nlm.nih.gov/pubmed/17126624
- Mattes RD, Campbell WW. Effects of food form and timing of ingestion on appetite and energy intake in lean young adults and in young adults with obesity. J Am Diet Assoc. 2009;109(3):430–437. https://www.ncbi.nlm.nih.gov/pmc/articles/PMC2680008/
- Rolls BJ, Kim S, Fedoroff IC. Effects of drinks sweetened with sucrose or aspartame on hunger, third and food intake in men. Physiol Behav. 1990;48(1):19–26. https://www.ncbi.nlm.nih.gov/pubmed/2236270
- Elliott SS, Keim NL, Stern JS, Teff K, Havel PJ. Fructose, weight gain, and the insulin resistance syndrome. Am J Clin Nutr. 2002;76(5):911–922. https://www.ncbi.nlm.nih.gov/pubmed/12399260
- Havel PJ. Dietary fructose: implications for dysregulation of energy homeostasis and lipid/carbohydrate metabolism. Nutr Rev. 2005;63(5):133–157. https://www.ncbi.nlm.nih.gov/pubmed/15971409
- Stanhope KL, Schwarz JM, Keim NL, Griffen SC, Bremer AA, Graham JL, Hatcher B, Cox CL, Dyachenko A, Zhang W, McGahan JP, Seibert A, Krauss RM, Chiu S, Schaefer EJ, Ai M, Otokozawa S, Nakajima K, Nakano T, Beysen C, Hellerstein MK, Berglund L, Havel PJ. Consuming fructose-sweetened, not glucose-sweetened, beverages increases visceral adiposity and lipids and decreases insulin sensitivity in overweight/obese humans. J Clin Invest. 2009;119(5):1322–1334. https://www.ncbi.nlm.nih.gov/pmc/articles/PMC2673878/
- Teff KL, Grudziak J, Townsend RR, Dunn TN, Grant RW, Adams SH, Keim NL, Cummings BP, Stanhope KL, Havel PJ. Endocrine and metabolic effects of consuming fructose- and glucose-sweetened beverages with meals in obese men and women: influence of insulin resistance on plasma triglyceride responses. J Clin Endocrinol Metab. 2009;94(5):1562–1569. https://www.ncbi.nlm.nih.gov/pmc/articles/PMC2684484/
- Bantle JP, Raatz SK, Thomas W, Georgopoulos A. Effects of dietary fructose on plasma lipids in healthy subjects. Am J Clin Nutr. 2000;72(5):1128–1134. https://www.ncbi.nlm.nih.gov/pubmed/11063439
- Couchepin C, Lê KA, Bortolotti M, da Encarnaçao JA, Oboni JB, Tran C, Schneiter P, Tappy L. Markedly blunted metabolic effects of fructose in healthy young female subjects compared with male subjects. Diabetes Care. 2008;31(6):1254–1256. https://www.ncbi.nlm.nih.gov/pubmed/18332156
- Tappy L, Randin JP, Felber JP, Chiolero R, Simonson DC, Jequier E, DeFronzo RA. Comparison of thermogenic effect of fructose and glucose in normal humans. Am J Physiol. 1986;250(6 Pt 1):E718–E724. https://www.ncbi.nlm.nih.gov/pubmed/3521319
- Brown CM, Dulloo AG, Yepuri G, Montani JP. Fructose ingestion acutely elevates blood pressure in healthy young humans. Am J Physiol Regul Integr Comp Physiol. 2008;294(3):R730–R737. https://www.ncbi.nlm.nih.gov/pubmed/18199590
- Raben A, Vasilaras TH, Møller AC, Astrup A. Sucrose compared with artificial sweeteners: different effects on ad libitum food intake and body weight after 10 wk of supplementation in overweight subjects. Am J Clin Nutr. 2002;76(4):721–729. https://www.ncbi.nlm.nih.gov/pubmed/12324283
- Sørensen LB, Raben A, Stender S, Astrup A. Effect of sucrose on inflammatory markers in overweight humans. Am J Clin Nutr. 2005;82(2):421–427. https://www.ncbi.nlm.nih.gov/pubmed/16087988
- Wikipedia. Fructose intolerance. https://en.wikipedia.org/wiki/Fructose_intolerance
- Mayo Foundation for Medical Education and Research. Fructose intolerance: Which foods to avoid ? – http://www.mayoclinic.org/fructose-intolerance/expert-answers/faq-20058097
- USDA National Nutrient Database. https://ndb.nal.usda.gov/ndb/
- Shepherd SJ, Gibson PR (2006). “Fructose malabsorption and symptoms of irritable bowel syndrome: guidelines for effective dietary management” (PDF). Journal of the American Dietetic Association. 106 (10): 1631–9. PMID 17000196. doi:10.1016/j.jada.2006.07.010. – in pdf – http://sacfs.asn.au/download/SueShepherd_sarticle.pdf
- Wikipedia. Fructose malabsorption. https://en.wikipedia.org/wiki/Fructose_malabsorption
- Mayo Foundation for Medical Education and Research. Fructose intolerance: Which foods to avoid ? http://www.mayoclinic.org/fructose-intolerance/expert-answers/faq-20058097
- Oku T, Nakamura S. Comparison of digestibility and breath hydrogen gas excretion of fructo-oligosaccharide, galactosyl-sucrose, and isomalto-oligosaccharide in healthy human subjects. Eur J Clin Nutr . 2003;57:1150-1156.
- Nelis GF, Vermeeren MA, Jansen W. Role of fructose-sorbitol malabsorption in the irritable bowel syndrome. Gastroenterology. 1990;99:1016-1020.
- Fernandez-Banares F, Esteve-Pardo M, de Leon R, Humbert P, Cabre E, Llovet JM, Gassull MA. Sugar malabsorption in functional bowel disease: Clinical implications.Am J Gastroenterol.1993;88:2044-2050.
- Symons P, Jones MP, Kellow JE. Symptom provocation in irritable bowel syndrome. Effects of differing doses of fructose-sorbitol. Scan J Gastroenterol. 1992;27:940-944.
- Goldstein R, Braverman D, Stankiewicz H. Carbohydrate malabsorption and the effect of dietary restriction on symptoms of irritable bowel syndrome and functional bowel complaints. Isr Med Assoc J. 2000;2:583-587.
- Andersson DE, Nygren A. Four cases of long-standing diarrhoea and colic pains cured by fructose-free diet—A pathogenic discussion. Acta Med Scand. 1978;203:87-92.
- http://sacfs.asn.au/download/SueShepherd_sarticle.pdf
- Ledochowski M, et al. (2001). Fructose Malabsorption (In German) – http://www.kup.at/kup/pdf/305.pdf
- Berni Canani R, Pezzella V, Amoroso A, Cozzolino T, Di Scala C, Passariello A (Mar 10, 2016). “Diagnosing and Treating Intolerance to Carbohydrates in Children”. Nutrients (Review). 8 (3): pii: E157. https://www.ncbi.nlm.nih.gov/pmc/articles/PMC4808885/
- Fructose malabsorption and symptoms of Irritable Bowel Syndrome Guidelines for effective dietary management” – http://sacfs.asn.au/download/SueShepherd_sarticle.pdf
- Fructose Malabsorption and Symptoms of Irritable Bowel Syndrome: Guidelines for Effective Dietary Management. http://sacfs.asn.au/download/SueShepherd_sarticle.pdf
- Kaiser, Ursula B.; Hegele, Robert A. (December 1991). “Case report: Heterogeneity of aldolase B in hereditary fructose intolerance”. The American Journal of the Medical Sciences. 302 (6): 364–368. PMID 1772121. doi:10.1097/00000441-199112000-00008. https://www.ncbi.nlm.nih.gov/pubmed/1772121
- Steinmann, Beat; Santer, Rene (2012). “Disorders of Fructose Metabolism”. In Saudubray, Jean-Marie; van den Berghe, Georges; Walter, John H. Inborn Metabolic Diseases: Diagnosis and Treatment (5th ed.). New York: Springer. pp. 157–165. ISBN 978-3-642-15719-6.
- Online Mendelian Inheritance in Man (OMIM) 229600. https://omim.org/entry/229600
- Jones H.F., Butler R.N., Brooks D.A. Intestinal fructose transport and malabsorption in humans. Am. J. Physiol. Gastrointest. Liver Physiol. 2011;300:G202–G206. doi: 10.1152/ajpgi.00457.2010. https://www.ncbi.nlm.nih.gov/pubmed/21148401
- Mayes P.A. Intermediary metabolism of fructose. Am. J. Clin. Nutr. 1993;58:S754–S765. https://www.ncbi.nlm.nih.gov/pubmed/8213607
- Abdelmalek M.F., Lazo M., Horska A., Bonekamp S., Lipkin E.W., Balasubramanyam A., Bantle J.P., Johnson R.J., Diehl A.M., Clark J.M. Higher dietary fructose is associated with impaired hepatic adenosine triphosphate homeostasis in obese individuals with type 2 diabetes. Hepatology. 2012;56:952–960. doi: 10.1002/hep.25741. https://www.ncbi.nlm.nih.gov/pmc/articles/PMC3406258/
- US Food and Drug Administration (FDA). High Fructose Corn Syrup: Questions and Answers. https://www.fda.gov/food/ingredientspackaginglabeling/foodadditivesingredients/ucm324856.htm
- https://health.gov/dietaryguidelines/2015/
- Nat Rev Gastroenterol Hepatol. 2010 May;7(5):251-64. doi: 10.1038/nrgastro.2010.41. Epub 2010 Apr 6. The role of fructose in the pathogenesis of NAFLD and the metabolic syndrome. https://www.ncbi.nlm.nih.gov/pubmed/20368739
- Harvard University. Harvard Health Publications. Too much fructose a hazard for heart health, from the Harvard Heart Letter. Published: September, 2011. http://www.health.harvard.edu/press_releases/too-much-fructose-a-hazard-for-heart-health
- The Journal of Clinical Investigation April 20, 2009. Consuming fructose-sweetened, not glucose-sweetened, beverages increases visceral adiposity and lipids and decreases insulin sensitivity in overweight/obese humans – http://www.jci.org/articles/view/37385
- Harvard University. Harvard Medical Publication. Abundance of fructose not good for the liver, heart.Published: September, 2011. http://www.health.harvard.edu/heart-health/abundance-of-fructose-not-good-for-the-liver-heart
- American Heart Association. Is high-fructose corn syrup worse than other added sugars ? http://heartinsight.heart.org/Spring-2016/Is-high-fructose-corn-syrup-worse-than-other-added-sugars/

