As the videos above showed, it is easy to over-consume sugar, because sugar (added and hidden sugar) can be found in the foods you eat every day ! Sugar-sweetened beverages such as sodas, energy drinks, and sports drinks are by far the biggest sources of added sugar in the average American’s diet. They account for more than one-third of the added sugar we consume as a nation. Other important sources include cookies, cakes, pastries, and similar treats; fruit drinks; ice cream, frozen yogurt and the like; candy; and ready-to-eat cereals.
What is Sugar ?
Sugars are the smallest and simplest type of carbohydrate. They are easily digested and absorbed by the body. Sugars are found naturally in fruits (fructose) and fluid milk and milk products (lactose). Sugar is a type of carbohydrate and sugar can also be known as agave nectar, barley malt, dextrose, rice syrup, isomalt or high fructose corn sugar. It is easy to over-consume sugar in juice and sweet drinks, as they contain mostly water and sugar. One glass of orange juice can contain concentrated sugar from five or six whole oranges. And while it is easy to drink that much sugar, you would be less likely to eat that many oranges in one go.
There are two types of sugars, and most foods contain some of each kind.
| Single sugars (monosaccharides) are small enough to be absorbed directly into the bloodstream. They include: | Sugars that contain two molecules of sugar linked together (disaccharides) are broken down in your body into single sugars. They include: |
|---|---|
| Fructose | Sucrose (table sugar ) = glucose + fructose |
| Galactose | Lactose (milk sugar) = glucose + galactose |
| Glucose | Maltose (malt sugar) = glucose + glucose |
Where Are Sugars Found 1
Sugars are found naturally in many nutritious foods and beverages and are also added to foods and beverages for taste, texture, and preservation.

(Sucrose (table sugar) is made of two simpler sugars called glucose and fructose. )
Naturally occurring sugars are found in a variety of foods, including:
- Dairy products
- Fruit (fresh, frozen, dried, and canned in 100% fruit juice)
- 100% fruit and vegetable juice
- Vegetables

Added sugars are often found in foods low in other nutrients, including:
- Dairy desserts (such as ice cream, other frozen desserts, and puddings)
- Grain-based desserts (such as brownies, cakes, cookies, doughnuts, pastries, pies, and sweet rolls)
- Sugar-sweetened beverages (such as energy drinks, flavored waters, fruit drinks, soft drinks, sports drinks, and sweetened coffee and tea)
- Sweets (such as candies, jams, sweet toppings, and syrups)
What Does Sugars Do In Your Body
- Sugars provide calories, or “energy,” for the body. Each gram of sugar provides 4 calories.
- The human body breaks down sugars into glucose. Glucose in the blood (often referred to as “blood sugar”) is the primary energy source for the body.
- Glucose can be used immediately or stored in the liver and muscles for later use.
- Sugars are used to sweeten, preserve, and improve the functional attributes of foods and beverages (such as viscosity, texture, body, color, and browning capability).
Sugar Health Facts
- Most Americans exceed the recommended limits for added sugars in the diet. On average, Americans consume more than 13% of total calories (or almost 270 calories) per day from added sugars, with intakes particularly high among children, adolescents, and young adults. The main sources of added sugars in U.S. diet are sugar-sweetened beverages, desserts, and sweets.
- Diets lower in added sugars and higher in nutrient-dense* foods and beverages can reduce the risk of cardiovascular disease.
- Diets higher in both added and naturally occurring sugars can increase the risk of developing cavities (also known as “dental caries”).
*Nutrient-Dense: Defined Nutrient-dense foods and beverages contain vitamins, minerals, dietary fiber, and other beneficial substances that may have positive health effects. They are also naturally lean or low in saturated fat and have little or no added saturated fat, sugars, refined starches, and sodium. Examples of nutrient dense foods are: beans and peas, eggs, fat-free (skim) and low-fat (1%) dairy products, fruits, lean meats and poultry, seafood, unsalted nuts and seeds, vegetables, and whole grains.
High-fructose corn syrup is one of the most widely used food ingredients in nearly all soft drinks, canned jams, breakfast cereals and baked goods. An analysis of food consumption patterns by using US Department of Agriculture food consumption tables from 1967 to 2000. The consumption of high-fructose corn syrup increased > 1000% between 1970 and 1990, far exceeding the changes in intake of any other food or food group 2. High-fructose corn syrup now represents > 40% of caloric sweeteners added to foods and beverages and is the sole caloric sweetener in soft drinks in the United States. Our most conservative estimate of the consumption of high-fructose corn syrup indicates a daily average of 132 kcal for all Americans aged > or = 2 y, and the top 20% of consumers of caloric sweeteners ingest 316 kcal from high-fructose corn syrup/day. The increased use of high-fructose corn syrup in the United States mirrors the rapid increase in obesity 2. The digestion, absorption, and metabolism of fructose differ from those of glucose. Hepatic metabolism of fructose favors de novo lipogenesis 3. In addition, unlike glucose, fructose does not stimulate insulin secretion or enhance leptin production. Because insulin and leptin act as key afferent signals in the regulation of food intake and body weight, this suggests that dietary fructose may contribute to increased energy intake and weight gain. Furthermore, calorically sweetened beverages may enhance caloric overconsumption. Thus, the increase in consumption of high-fructose corn syrup has a temporal relation to the epidemic of obesity, and the overconsumption of high-fructose corn syrup in calorically sweetened beverages may play a role in the epidemic of obesity.
The 2015-2020 Dietary Guidelines for Americans 4 recommends consuming less than 10% of calories per day from added sugars. The guidelines also note that many foods and beverages that contain added sugars also tend to be high in calories and provide few or no important nutrients or dietary fiber.
The majority of sugars in typical American diets are sugars added to foods during processing, preparation, or at the table. These “added sugars” sweeten the flavor of foods and beverages and improve their palatability. They also are added to foods for preservation purposes and to provide functional attributes, such as viscosity, texture, body, and browning capacity.
Although the body’s response to sugars does not depend on whether they are naturally present in food or added to foods, sugars found naturally in foods are part of the food’s total package of nutrients and other healthful components. In contrast, many foods that contain added sugars often supply calories, but few or no essential nutrients and no dietary fiber.
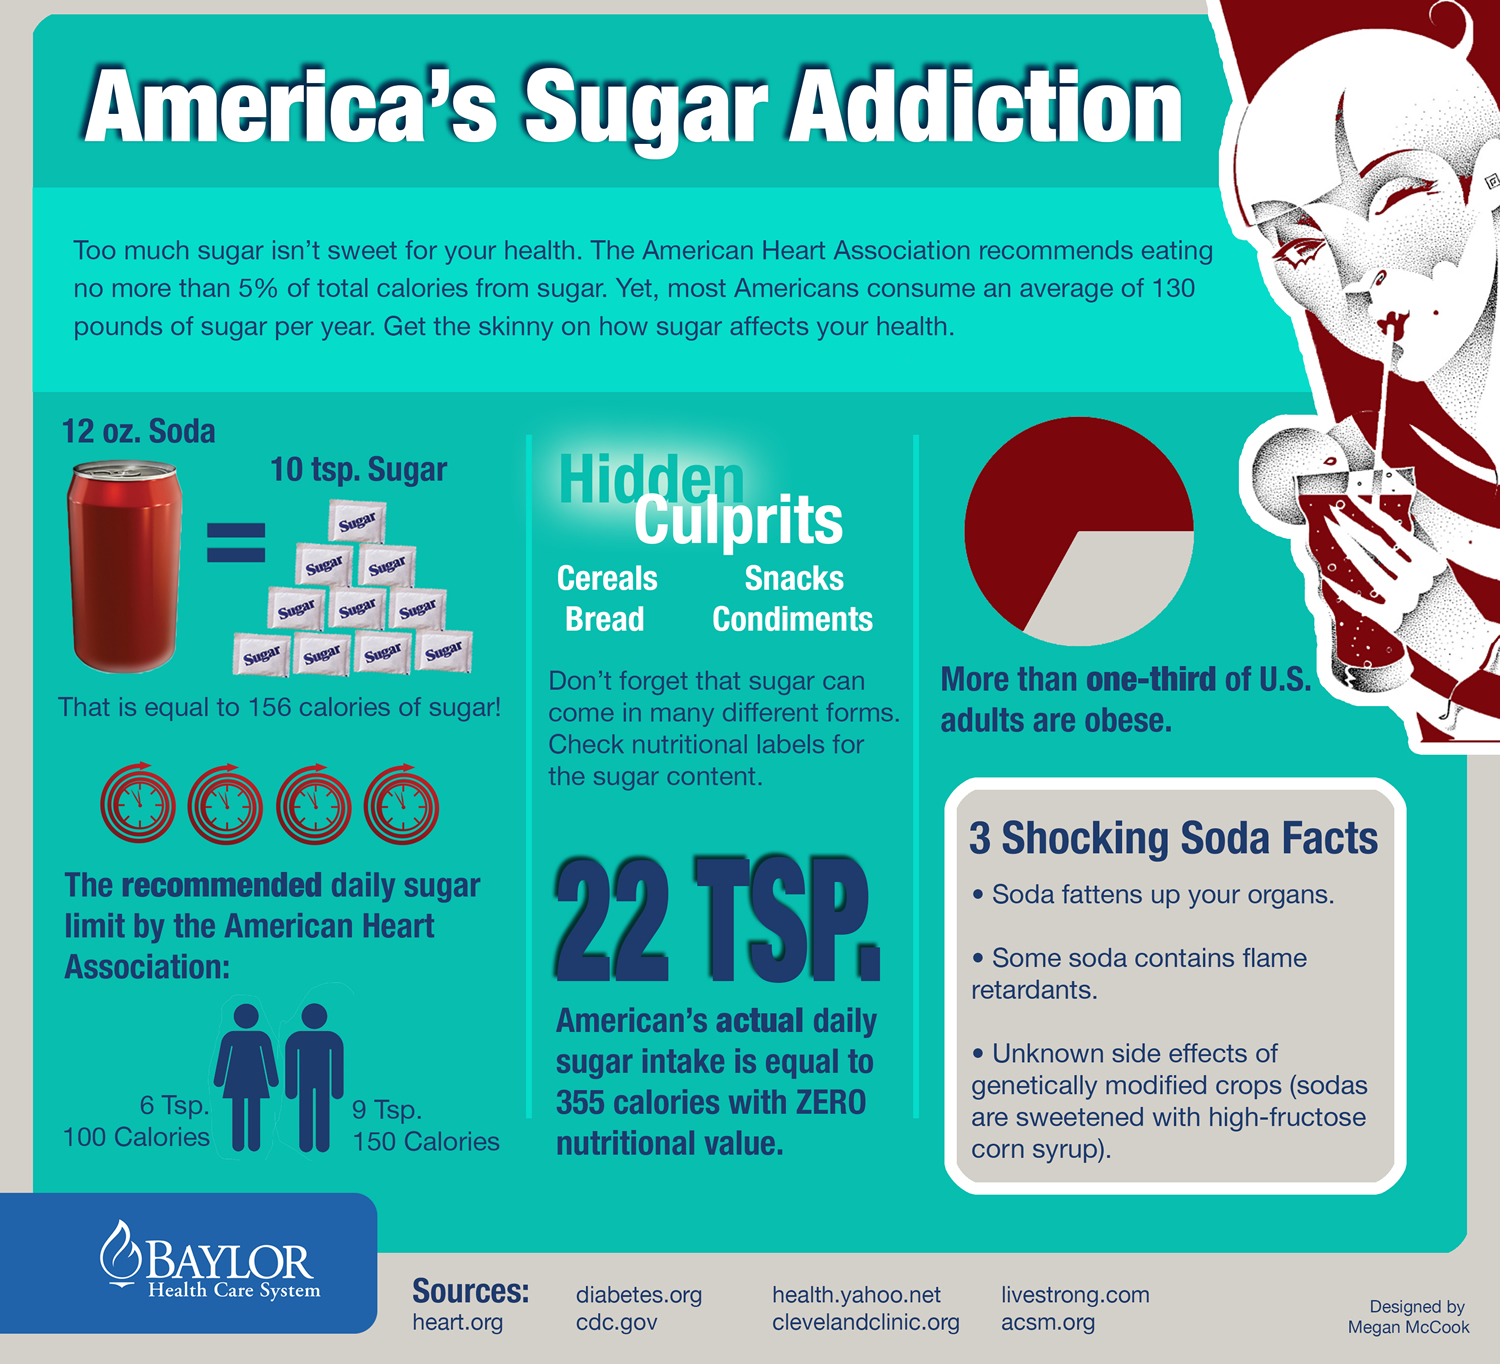
For example, fizzy drinks do not make you feel full as quickly as foods do. This makes them easy to over-consume. And a small fizzy drink contains nine teaspoons of added sugar, so drinking just one can means that you have almost reached your recommended maximum intake for that whole day.
Facts About Sugar
There is now strong evidence from mostly prospective cohort studies and also randomized controlled trials showing that eating patterns that include lower intake of sources of added sugars are associated with reduced risk of cardiovascular disease (high blood pressure, heart attacks, stroke) in adults, and moderate evidence indicates that these eating patterns are associated with reduced risk of obesity, type 2 diabetes, and some types of cancer in adults 5.
There is also moderate evidence indicates a relationship between added sugars and dental caries in children and adults. (source 6).
A 6 year follow up study supported by the National Heart, Lung and Blood Institute published in the American Heart Association journal, Circulation, linked regular consumption of sugar-sweetened drinks (such as sodas and fruit drinks) to increased visceral fat, a type of body fat that may contribute to a higher risk of diabetes and heart disease 7.
Soft drinks and other sugar-sweetened beverages are the primary sources of added sugars in Americans’ diets, including that of children and adolescents 8, 9, 10, 11. Between 1970 and 2000, per person daily consumption of caloric soft drinks increased 70%, from 7.8 ounces to 13.2 ounces 11.
In the setting of a pandemic of obesity and related chronic diseases, the American Heart Association recently released a scientific statement recommending reductions in added sugar intake to no more than 100 calories per day for most American women and no more than 150 calories per day for most American men from added sugars 12. The statement identified sugar sweetened beverages as the primary source of added sugars in the American diet 13. While it has long been suspected that sugar sweetened beverages contribute at least in part to the obesity epidemic, only in recent years have large epidemiologic studies been able to substantiate the relationship between sugar sweetened beverage consumption and long-term weight gain, type 2 diabetes and cardiovascular risk. It is thought that sugar sweetened beverages’ contribute to weight gain due to their high added sugar content, low satiety and potential incomplete compensation for total energy leading to increased energy intake 14, 15. In addition, because of their high amounts of rapidly absorbable carbohydrates such as various forms of sugar and high-fructose corn syrup and large quantities consumed, sugar sweetened beverages’ may increase type 2 diabetes mellitus and cardiovascular risk, independent of obesity as a contributor to a high dietary glycemic load leading to inflammation, insulin resistance, and impaired ß-cell function 16. Fructose from any sugar or high fructose corn syrup may also increase blood pressure, and promote accumulation of visceral adiposity, dyslipidemia and ectopic fat deposition due to increased hepatic de novo lipogenesis10. Here, we review temporal patterns in SSB consumption, and clinically relevant effects on obesity, type 2 diabetes and cardiovascular disease risk.
Likewise, total calorie intake has increased by approximately 150-300 calories per day, with half of these calories coming from liquid sources, eg. sugar sweetened beverages 17, 18. Because there has been no concomitant change in physical activity 18, 19, the net result is the well known rise in overweight and obesity that currently plague our nation in epidemic proportions 20.
Positive energy balance with as few as 110-165 calorie surplus daily can yield an excess of ten or more pounds over one year’s time 17, 18. “Supersized” portions in the U.S. have maximized energy content of numerous foods and beverages. From 1977 to 1996, “typical” servings for soda and other sugary beverages have increased by 50 and 68 calories, respectively 21.
Current Guidelines for Sugar Intake
| US Department of Agriculture and US Department of Health and Human Services (2015-2020) | Limit consumption of added sugars to <10% of calories per day |
| World Health Organization (March 2015) | Restrict added sugar consumption to <10% of daily calories |
| American Heart Association (2009) | Limit added sugars to 5% of daily calories (for women, 100 calories/day; for men, 150 calories/day) |
The American Heart Association 22 recommends no more than half of your daily discretionary calorie allowance come from added sugars. Your daily discretionary calorie allowance consists of calories available after meeting nutrient needs. This is no more than 100 calories per day for most American women and no more than 150 per day for men (or about 6 teaspoons a day for women and 9 teaspoons a day for men).
The United Kingdom’s Scientific Advisory Committee on Nutrition published its final report “Carbohydrates and Health” in July 2015 5. It included recommendations that the average population intake of sugar should not exceed 5% of total dietary energy for the population aged two years upwards (halving the previous recommendation, in line with the American Heart Association and 50% less than the <10% recommended by the US Department of Agriculture and US Department of Health and Human ) and that consumption of sugar sweetened drinks should be minimised by both adults and children. These recommendations are based on United Kingdom Scientific Advisory Committee on Nutrition’s review of the evidence, which demonstrated that:
- in adults, when consuming an unrestricted daily diet, increasing the percentage of total energy from sugar leads to increases in energy intake
- greater consumption of sugar sweetened drinks is associated with increased risk of type 2 diabetes
- consumption of sugar sweetened drinks, compared to non-sugar sweetened drinks, results in greater weight gain and increases in body mass index in children and adolescents due to increased energy consumption
- higher consumption of sugar and sugar containing foods and drinks is associated with a greater risk of dental caries.
The evidence from the United Kingdom’s Scientific Advisory Committee on Nutrition published ‘Carbohydrates and Health’ report clearly and robustly presents the case for action to reduce sugar intakes to the new 5% recommendation and also to minimise consumption of sugar sweetened drinks.
This is the first time the United Kingdom’s Scientific Advisory Committee on Nutrition has made a recommendation to minimise consumption of a specific food and its importance must not be underestimated.
The report also includes recommendations for increasing fibre intake and confirmation that carbohydrates should provide around 50% of energy intakes (which also includes the new maximum sugar recommendation).
Sugar by Any Other Name
You don’t always see the word “sugar” on a food label. It sometimes goes by another name, like these:
- White sugar
- Brown sugar
- Raw sugar
- Agave nectar
- Brown rice syrup
- Corn syrup
- Corn syrup solids
- Coconut sugar
- Coconut palm sugar
- High-fructose corn syrup
- Invert sugar
- Dextrose
- Anhydrous dextrose
- Crystal dextrose
- Dextrin
- Evaporated cane juice
- Fructose sweetener
- Liquid fructose
- Glucose
- Lactose
- Honey
- Malt syrup
- Maple syrup
- Molasses
- Pancake syrup
- Sucrose
- Trehalose
- Turbinado sugar
- Isoglucose
- Levulose
Watch out for items that list any form of sugar in the first few ingredients, or have more than 4 total grams of sugar.
Sugar Nutrition
One Tablespoon of table sugar (also known as sucrose), contains approximately 48 calories and about 12 grams of sugar.
- 1 tablespoon of maple syrup contains about 51 calories and just over 12 grams of sugar,
- 1 tablespoon of corn syrup has approximately 57 calories and 13 grams of sugar,
- 1 tablespoon of honey provides about 63 calories and 13.5 grams of sugar.
On the other hand a Teaspoon of sugar provides about 16 calories and 4 grams of sugar.
Knowing how many calories and grams of refined sugar are in a specific unit of measurement, whether it’s a teaspoon or a tablespoon, generally allows you to calculate the number of calories in foods with added sugar.
For example, a tablespoon of one popular brand of tomato ketchup has 4 grams of sugar and most people add about 3 tablespoons of ketchup to their burgers. That 12 grams of sugar from the ketchup alone is more sugar than you’d find in a serving of two store-bought chocolate chip cookies, which contains only 9 grams of sugar ! And a store-bought vegetable juice would seem like a healthy choice at only 60 calories in a single 1-cup (8 ounce) serving — but that single serving size still contains 11 grams of natural sugar, even though the label doesn’t list any added sugar.
Sugar and Addiction
High sugar consumption contributes to the rising prevalence of obesity. Sugar can have rewarding effects that are similar to, but less strong than, the effects of addictive substances. There is an increasing societal concern that consumption of specific foods such as sugar might become ‘addictive’ and hence, promote weight gain. People who consume large amounts of sugar also tend to use more addictive substances.
Claims about the addictiveness of sugar however are based largely on findings from few animal studies, whereas there is a lack of direct human evidence for symptoms of sugar-related substance dependence. The current study examined in a large sample of human participants whether foods mainly containing sugar in particular might cause ‘addiction-like’ problems that meet clinical criteria for substance dependence, and, also whether in turn this relates to body weight and negative affectivity (depressed mood). The current findings indicate that sugary foods contribute minimally to ‘food dependence’ and increased risk of weight gain. Instead, they are consistent with the current scientific notion that food energy density, and the unique individual experience of eating, plays an important role in determining the reward value of food and promoting excessive energy intake. (source 23).
In another study 24, they found that positive association between high sugar consumption and high substance use was partly due to unique environmental factors (e.g., social situations). Genetic factors were also of influence, suggesting that neuronal circuits underlying the development of addiction and obesity are related. Further research is needed to identify genes that influence sugar consumption and those that overlap with substance use.
Conclusion from a recent literature review on food and sugar addiction 25 and considered the evidence suggesting the addictiveness of highly processed foods, particularly those with high sugar content. They examined the addictive potential of sugar by contrasting evidence from the animal and human neuroscience literature on drug and sugar addiction. Found little evidence to support sugar addiction in humans, and findings from the animal literature suggest that addiction-like behaviours, such as bingeing, occur only in the context of intermittent access to sugar. Given the lack of evidence supporting it, they argue against a premature incorporation of sugar addiction into the scientific literature and public policy recommendations.
Sugar and Children’s Weight and Health
Perhaps most disturbing is the impact these dietary and lifestyle changes have had on America’s youth 20, 26, 27.
Children who consume more calories due to larger portion sizes do not eat less at other times. Sugary beverages contribute up to 10%-15% of total daily energy intake among children 9. A meta-analysis examining the link between sweetened beverages and weight gain reported that higher intakes of soda and other sugary drinks are positively correlated with weight gain in the pediatric population 28.
Recommendations to reduce added sugars are highly relevant 29.
The Dietary Guidelines for Americans 2015-2020 30 indicates that the healthiest way to reduce caloric intake is to decrease your consumption of added sugars, fats, and alcohol, all of which provide calories but few or no essential nutrients.
The 2015-2020 Dietary Guidelines for Americans focuses on shifts to emphasize the need to make substitutions, choosing nutrient-dense foods and beverages in place of less healthy choices.
Nutrient Dense: is a characteristic of foods and beverages that provide vitamins, minerals, and other substances that contribute to adequate nutrient intakes or may have positive health effects, with little or no solid fats and added sugars, refined starches, and sodium. Ideally, these foods and beverages also are in forms that retain naturally occurring components, such as dietary fiber. All vegetables, fruits, whole grains, seafood, eggs, beans and peas, unsalted nuts and seeds, fat-free and low-fat dairy products, and lean meats and poultry—when prepared with little or no added solid fats, sugars, refined starches, and sodium—are nutrient dense foods. These foods contribute to meeting food group recommendations within calorie and sodium limits. The term “nutrient dense” indicates the nutrients and other beneficial substances in a food have not been “diluted” by the addition of calories from added solid fats, sugars, or refined starches, or by the solid fats naturally present in the food.
For most individuals, achieving a healthy eating pattern will require changes in food and beverage choices.
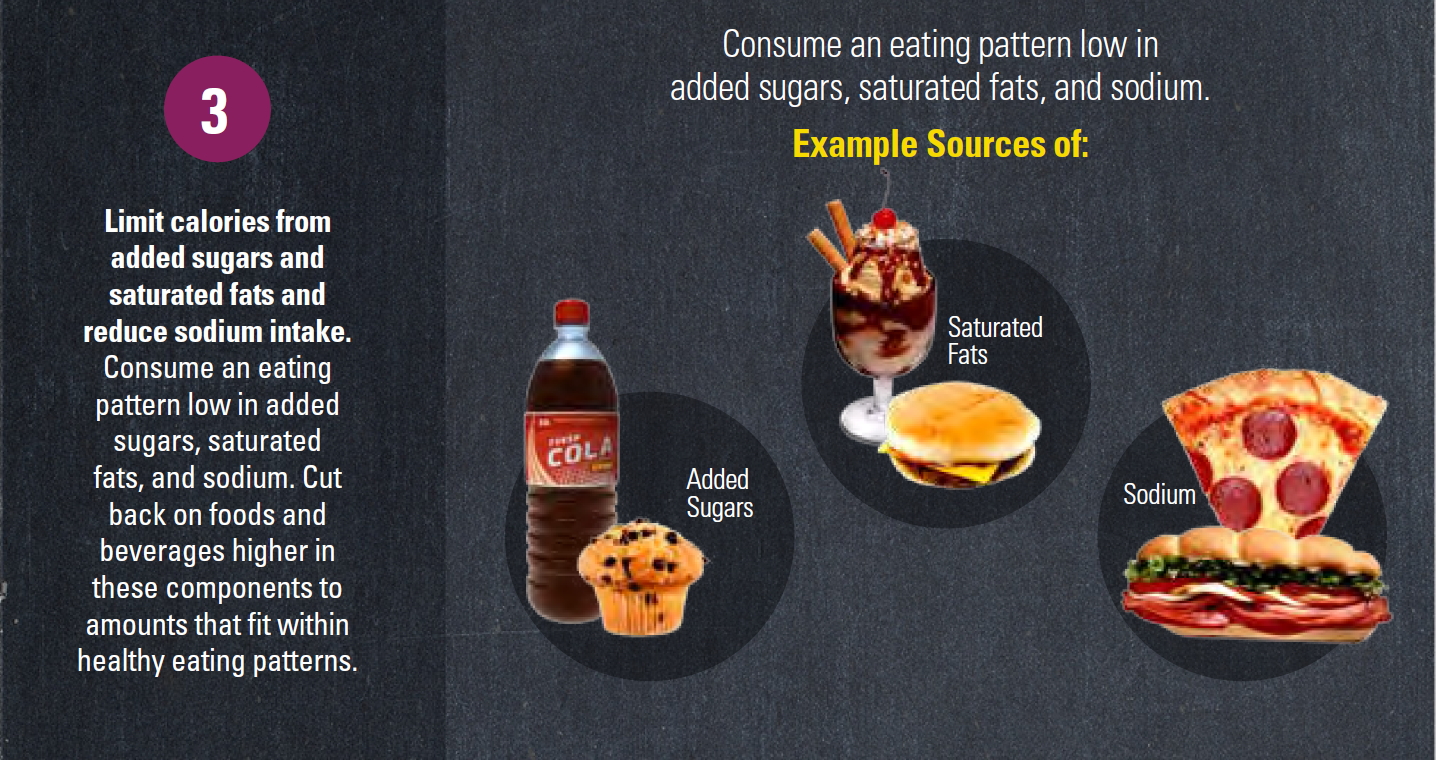
- Consume Less than 10 percent of calories per day from added sugars 31
- Consume Less than 10 percent of calories per day from saturated fats 32
- Consume less than 2,300 milligrams (mg) per day of sodium 33
- If alcohol is consumed, it should be consumed in moderation—up to one drink per day for women and up to two drinks per day for men—and only by adults of legal drinking age. 34
In tandem with the recommendations above, Americans of all ages—children, adolescents, adults, and older adults—should meet the Physical Activity Guidelines for Americans to help promote health and reduce the risk of chronic disease. Americans should aim to achieve and maintain a healthy body weight. The relationship between diet and physical activity contributes to calorie balance and managing body weight.
One way for people to reduce their intake of added sugars and help manage their weight is to reduce the amount of sugar-sweetened beverages they drink.
Both naturally occurring sugars and added sugars increase the risk of dental caries. Added sugars contribute an average of 16 percent of the total calories in American diets. Added sugars include high fructose corn syrup, white sugar, brown sugar, corn syrup, corn syrup solids, raw sugar, malt syrup, maple syrup, pancake syrup, fructose sweetener, liquid fructose, honey, molasses, anhydrous dextrose, and crystal dextrose. (Source 35).
Added Sugar
Added sugars include syrups and other caloric sweeteners. When sugars are added to foods and beverages to sweeten them, they add calories without contributing essential nutrients. Consumption of added sugars can make it difficult for you to meet your nutrient needs while staying within calorie limits. Naturally occurring sugars, such as those in fruit or milk, are not added sugars.
The two main sources of added sugars in U.S. diets are sugar-sweetened beverages and snacks and sweets. Many foods high in calories from added sugars provide few or no essential nutrients or dietary fiber and, therefore, may contribute to excess calorie intake without contributing to diet quality; intake of these foods should be limited to help achieve healthy eating patterns within calorie limits. (Source 36).

Sugar-sweetened Beverages
Sugar-sweetened beverages are significant sources of added sugars in the diet of U.S. adults 37 and account for approximately one third of added sugar consumption (source 38). Among adults, frequent (i.e., at least once a day) sugar-sweetened beverages intake is associated with adverse health consequences, including obesity, type 2 diabetes, and cardiovascular disease (source 39).
According to the 2009–2010 National Health and Nutrition Examination Survey, 50.6% of U.S. adults consumed at least one sugar-sweetened beverages on a given day (source 40).
Why calories from added sugars are a particular concern
Increased consumption of added sugars, which are sweeteners added to processed and prepared foods, has been linked to a decrease in intake of essential micronutrients 41, 42 and an increase in body weight 43.
Solid fats and added sugars are consumed in excessive amounts, and their intake should be limited. Together, they contribute a substantial portion of the calories consumed by Americans—35 percent on average, or nearly 800 calories per day—without contributing importantly to overall nutrient adequacy of the diet. Moreover, they have implications for weight management. Foods containing solid fats and added sugars are no more likely to contribute to weight gain than any other source of calories in an eating pattern that is within calorie limits. However, as the amount of solid fats and/or added sugars increases in the diet, it becomes more difficult to also eat foods with sufficient dietary fiber and essential vitamins and minerals, and still stay within calorie limits. For most people, no more than about 5 to 15 percent of calories from solid fats and added sugars can be reasonably accommodated in the USDA Food Patterns, which are designed to meet nutrient needs within calorie limits. (Source 35).
Reducing the consumption of solid fats and added sugars allows for increased intake of nutrient-dense foods without exceeding overall calorie needs. Because solid fats and added sugars are added to foods and beverages by manufacturers and by consumers at home, Americans can reduce their consumption of these food components in a variety of ways:
- Focus on eating the most nutrient-dense forms of foods from all food groups.
- Limit the amount of solid fats and added sugars when cooking or eating (e.g., trimming fat from meat, using less butter and stick margarine, and using less table sugar).
- Consume fewer and smaller portions of foods and beverages that contain solid fats and/or added sugars, such as grain-based desserts, sodas, and other sugar-sweetened beverages.
Sugar and Cardiovascular Disease
This paper 44 helps place into context the role of sugar in the diet and how it now appears to contribute to risk of developing cardiovascular disease through several potential pathways.
Whether it is purely the added calories and resulting weight gain that indirectly impact cardiovascular risk or possible direct influences on blood pressure, blood lipids, insulin or insulin resistance, there is a need to pay attention to excessive sugar intake. Regardless of its form, e.g. fructose, sucrose or high fructose corn syrup, etc, sugar appears to be a potentially serious contributor to cardiovascular risk. In this obeseogenic era when the majority of the population is in positive energy balance, providing effective guidance on the specific impact of sweetened beverages, excessive intake of nutrient-poor discretionary calories, and the special needs of children warrants urgent attention 45.
Increasingly, people are aware of the dangers of too much sugar in their diet. Consuming excess sugar can lead to a condition called metabolic syndrome, which is characterized by high blood pressure, high blood sugar, unhealthy cholesterol levels, and abdominal fat. Excess sugar also contributes to widespread inflammation and even leads to a higher risk of cardiovascular disease and type 2 diabetes.
Excess sugar intake can be bad for your brain, too. Studies have found that high sugar intake has a negative effect on cognition, and it has also been implicated in hyperactivity and inattention in children and adolescents.
But what does “too much sugar” look like ? On the one hand, we have the well-known “problem foods” like sugar-sweetened sodas, candy, and baked treats. On the other hand, we have the naturally occurring sugars in some whole foods (like plain yogurt, milk, or fruit) that are part of a healthy diet.
Sugar can hide in foods where you least expect it. Although they don’t seem sweet, ketchup, barbecue sauce, and pasta sauce can have loads of sugar. So can reduced-fat salad dressings, bread, baked beans, and some flavored coffees. Get in the habit of reading labels. Filter out high-sugar foods before they hit your shopping cart.
On average, Americans consume 66 pounds of added sugar each year ! (that is equivalent to a single leather couch in weight)

A) 66 Pound Leather Couch

B) 16.5 Bags of 4 Lbs Sugar
The 2 most commonly consumed sugars in America and also the most over-consumed are:
- Table Sugar (Sucrose) and
- High-Fructose Corn Syrup (HFCS)
Lactose is a sugar that naturally occurs in milk and is not counted as an added sugar in food. Both sucrose and high fructose corn syrup are made up of about half glucose and half fructose, although high fructose corn syrup can range from as low as 42% fructose to 65% or even higher. Fructose is unique from a metabolic standpoint, in that it is largely broken down in the liver. When the liver has to deal with large amounts of fructose, it processes the sugar into fat globules called triglycerides. Some of those fats are exported into the bloodstream, leading to metabolic diseases. Others are deposited in the liver, causing a condition known as non-alcoholic fatty liver disease. Fatty liver disease is a growing health concern for both adults and children.
When sugars are added to foods and beverages to sweeten them, they add calories without contributing essential nutrients. Consumption of added sugars can make it difficult for individuals to meet their nutrient needs while staying within calorie limits. Naturally occurring sugars, such as those in fruit or milk, are not added sugars. Specific examples of added sugars that can be listed as an ingredient include brown sugar, corn sweetener, corn syrup, dextrose, fructose, glucose, high-fructose corn syrup, honey, invert sugar, lactose, malt syrup, maltose, molasses, raw sugar, sucrose, trehalose, and turbinado sugar.
Healthy eating patterns limit added sugars to less than 10 percent of calories per day. This recommendation is a target to help the public achieve a healthy eating pattern, which means meeting nutrient and food group needs through nutrient-dense food and beverage choices and staying within calorie limits. When added sugars in foods and beverages exceed 10 percent of calories, a healthy eating pattern may be difficult to achieve.
Consuming Too Much Added Sugar Leads To Weight Gain
A data review completed by the Department of Health and Human Services noted that American adults consume 13.4% of their calories (270 calories) from hidden sugars, and in children, this figure is a whopping 17%. The main sources of the hidden sugars in the typical U.S. diet were snacks and sweets (31%), added sugars in beverages (47%), and soda (25%). Of course, few people would be surprised that soda is high in sugar.
Consuming too much added sugar over long periods of time also can affect the natural balance of hormones that drive critical functions in the body. Eating sugar increases levels of glucose in the bloodstream, which leads the pancreas to release insulin. Higher levels of insulin, in turn, cause the body to store more food calories as fat.
Insulin also affects a hormone called leptin, which is our natural appetite suppressant that tells our brains we are full and can stop eating. Imbalanced insulin levels, along with high consumption of certain sugars, such as fructose, has been linked to a condition called leptin resistance, in which the brain no longer “hears” the message to stop eating, thus promoting weight gain and obesity 46.
Leptin resistance enabled our ancestors to survive long periods of limited food supply by encouraging them to overeat during times of plenty and enabling them to conserve more calories as fat. In the modern world, that’s not a benefit. To make matters worse, people with leptin resistance also tend to feel sluggish, making it difficult to be active and contributing to further weight gain.
Does Sugar Cause Diabetes ?
Sugar itself doesn’t cause diabetes. But lots of sugar splurges can point you there. Too much of anything, including sugar, can pack on pounds, for one thing. Heavy bodies may have a harder time using insulin, the hormone that controls blood sugar. When your body resists insulin, blood sugar and your risk of diabetes go up.
Sugar Leaves You Craving For More
Research also shows that, for some people, eating sugar produces characteristics of craving and withdrawal, along with chemical changes in the brain’s reward center, the limbic region.
Using brain-scanning technology, scientists at the U.S. National Institute on Drug Abuse were among the first to show that sugar causes changes in peoples’ brains similar to those in people addicted to drugs such as cocaine and alcohol. These changes are linked to a heightened craving for more sugar – you crave sugar, lose control, and eat more than you planned. Your brain also sees sugar as a reward, which makes you keep wanting more of it. If you often eat a lot of sugar, you’re reinforcing that reward, which can make it tough to break the habit. This important evidence has set off a flood of research on the potentially addictive properties of sugar.
Furthermore, when you drink the same amount of sugar in sugary drinks, it doesn’t include that fiber. As a result, the journey from liquid sugar to blood sugar happens quickly, delivering more sugar to the body’s vital organs than they can handle. Over time, that can overload the pancreas and liver, leading to serious diseases like diabetes, heart disease and liver disease.
What Makes Sweet Drinks Different ?
Research suggests that our bodies process liquid sugar differently than sugar in foods, especially those containing fiber. Studies also show that when we drink high-calorie beverages, we don’t feel as full as we would if we had eaten the same number of calories. So it’s easy to down 9 teaspoons (38 grams) of sugar in a single soda – about twice as many as in an apple – and hardly notice.
When we eat an apple, for example, we may be getting as many as 18 grams of sugar, but the sugar is “packaged” with about one-fifth of our daily requirement of fiber. Because it takes our bodies a long time to digest that fiber, the apple’s sugar is slowly released into our blood stream, giving us a sustained source of energy.
When we drink sugary drinks, our bodies respond to that blast of sugar by producing triglycerides. Some of those fat globules will be stored in the liver; others will be exported into the bloodstream and, once there, may end up lining our arteries, putting us at risk for a heart attack.
You don’t need sugar as much as you think you do. In fact, you can train your taste buds to enjoy things that aren’t as sweet. Try cutting out one sweet food from your diet each week. For example, pass on dessert after dinner. Start putting less sugar in your coffee or cereal. Over time, you will lose your need for that sugar taste.
Do Sugar Detox Diets Work ?
Can you beat your sugar habit by quitting cold turkey ? Some sugar detox plans urge you to avoid all sweets. That means all fruit, dairy, and refined grains. The idea is to purge your system of sugar. Diet changes like this are too drastic to keep up. Changes that you can do only for the short term mean you’ll fall back to your old habits.
If you make small, simple changes to your diet, it’s easy to keep them up. Start by eating more fruits and vegetables. Drink extra water. Check food labels, and pick those that don’t have a lot of sugar. Cut out a little bit of sugar each week. After a few weeks, you’ll be surprised at how little you miss it.
You don’t have to give up sweetness. Just get it from other sources. Try fresh berries or pureed fruit on oatmeal instead of sugar. Explore fruit that’s dried, frozen, or canned (without too much added sugar). A glass of milk or low-sugar yogurt can help.
Eating protein is an easy way to curb sugar cravings. High-protein foods digest more slowly, keeping you feeling full for longer. Protein doesn’t make your blood sugar spike the way refined carbs and sugars do. Pick proteins like lean chicken, low-fat yogurt, eggs, nuts, or beans.
Fiber helps fight a sugar cravings in many ways. First, it keeps you full. High-fiber foods also give you more energy. Because they don’t raise your blood sugar, there’s no hungry crash after. Choose fruits like apple, grapefruit and vegetables, and whole grains for a protein/fiber combo.
Exercise can help wipe out those sugar cravings and change the way you eat in general. You start to feel better and want healthier foods. Do what you like, such as walking, riding your bike, or swimming. Start out slow, and work toward at least 30 minutes at a time, 7 days a week.
Sugar Metabolism Disorders
Metabolism is the process your body uses to make energy from the food you eat. Food is made up of proteins, carbohydrates, and fats. Chemicals in your digestive system (enzymes) break the food parts down into sugars and acids, your body’s fuel. Your body can use this fuel right away, or it can store the energy in your body tissues. If you have a metabolic disorder, something goes wrong with this process.
Sucrose (table sugar) is made of two simpler sugars called glucose and fructose. Lactose (milk sugar) is made of glucose and galactose. Both sucrose and lactose must be broken down into their component sugars by enzymes before the body can absorb and use them. The carbohydrates in bread, pasta, rice, and other carbohydrate-containing foods are long chains of simple sugar molecules. These longer molecules must also be broken down by the body. If an enzyme needed to process a certain sugar is missing, the sugar can accumulate in the body, causing problems.
Sugar metabolism disorders are a group of metabolic disorders. Normally your enzymes break carbohydrates down into glucose (a type of sugar). If you have one of these disorders, you may not have enough enzymes to break down the carbohydrates. Or the enzymes may not work properly. This causes a harmful amount of sugar to build up in your body. That can lead to health problems, some of which can be serious. Some of the disorders are fatal 47.
These disorders are inherited 47. Newborn babies get screened for many of them, using blood tests. If there is a family history of one of these disorders, parents can get genetic testing to see whether they carry the gene. Other genetic tests can tell whether the fetus has the disorder or carries the gene for the disorder.
Treatments may include special diets, supplements, and medicines. Some babies may also need additional treatments, if there are complications. For some disorders, there is no cure, but treatments may help with symptoms 47.
Hereditary Fructose Intolerance
Hereditary fructose intolerance is caused by lack of the enzyme needed to metabolize fructose. Very small amounts of fructose cause low blood sugar levels and can lead to kidney and liver damage 48.
In this disorder, the body is missing an enzyme that allows it to use fructose, a sugar present in table sugar (sucrose) and many fruits. As a result, a by-product of fructose accumulates in the body, blocking the formation of glycogen and its conversion to glucose for use as energy. Ingesting more than tiny amounts of fructose or sucrose causes low blood sugar levels (hypoglycemia), with sweating, confusion, and sometimes seizures and coma. Children who continue to eat foods containing fructose develop kidney and liver damage, resulting in jaundice, vomiting, mental deterioration, seizures, and death. Chronic symptoms include poor eating, failure to thrive, digestive symptoms, liver failure, and kidney damage. For most types of this disorder, early diagnosis and dietary restrictions started early in infancy can help prevent these more serious problems.
The diagnosis is made when a chemical examination of a sample of liver tissue determines that the enzyme is missing. Treatment involves excluding fructose (generally present in sweet fruits), sucrose, and sorbitol (a sugar substitute) from the diet. Severe attacks of hypoglycemia respond to glucose given by vein. Milder attacks are treated with glucose tablets, which should be carried by anyone who has hereditary fructose intolerance 48.
Mucopolysaccharidoses
Complex sugar molecules called mucopolysaccharides are essential parts of many body tissues. In mucopolysaccharidoses, the body lacks enzymes needed to break down and store mucopolysaccharides. As a result, excess mucopolysaccharides enter the blood and are deposited in abnormal locations throughout the body.
Mucopolysaccharidoses are a group of inherited metabolic diseases, classified as lysosomal storage diseases, in which a defective or missing enzyme causes large amounts of complex sugar molecules, called lysosomes accumulate, to accumulate in harmful amounts in the body’s cells and tissues. This accumulation causes permanent, progressive cellular damage that affects appearance, physical abilities, organ and system functioning, and, in most cases, mental development. Depending on the type of mucopolysaccharidosis, affected individuals may have normal intellect or may be profoundly impaired, may experience developmental delay, or have severe behavioral problems. Physical symptoms generally include coarse or rough facial features, thick lips, an enlarged mouth and tongue, short stature with a disproportionately short trunk (dwarfism), abnormal bone size or shape (and other skeletal irregularities), thickened skin, enlarged organs such as the liver or spleen, hernias, and excessive body hair growth 49, 48.
- Mucopolysaccharidoses occur when the body lacks enzymes needed to break down and store complex sugar molecules (mucopolysaccharides).
- Typically, symptoms include short stature, hairiness, stiff finger joints, and coarseness of the face.
- The diagnosis is based on symptoms and a physical examination.
- Although a normal life span is possible, some types cause premature death.
- A bone marrow transplant may help.
During infancy and childhood, short stature, hairiness, and abnormal development become noticeable. The face may appear coarse. Some types of mucopolysaccharidoses cause intellectual disability to develop over several years. In some types, vision or hearing may become impaired. The arteries or heart valves can be affected. Finger joints are often stiff.
A doctor usually bases the diagnosis on the symptoms and a physical examination. The presence of a mucopolysaccharidosis in other family members also suggests the diagnosis. Urine tests may help but are sometimes inaccurate. X-rays may show characteristic bone abnormalities. Mucopolysaccharidoses can be diagnosed before birth by using amniocentesis or chorionic villus sampling.
Who is at risk of Mucopolysaccharidoses ?
It is estimated that one in every 25,000 babies born in the United States will have some form of the mucopolysaccharidoses. They are autosomal recessive disorders, meaning that only individuals inheriting the defective gene from both parents are affected. (The exception is MPS II, or Hunter syndrome, in which the mother alone passes along the defective gene to a son.) When both people in a couple have the defective gene, each pregnancy carries with it a one in four chance that the child will be affected. The parents and siblings of an affected child may have no sign of the disorder. Unaffected siblings and select relatives of a child with one of the mucopolysaccharidoses may carry the recessive gene and could pass it to their own children 49.
In general, the following factors may increase the chance of getting or passing on a genetic disease:
- A family history of a genetic disease.
- Parents who are closely related or part of a distinct ethnic or geographic circle.
- Parents who do not show disease symptoms but carry a disease gene.
What are the different types of the mucopolysaccharidoses ?
Seven distinct clinical types and numerous subtypes of the mucopolysaccharidoses have been identified. Although each mucopolysaccharidosis (MPS) differs clinically, most patients generally experience a period of normal development followed by a decline in physical and/or mental function 49.
- MPS I has historically been divided into three broad groups based on severity of symptoms–Hurler, Hurler-Scheie, and Scheie (in decreasing order of severity). It is now more appropriate to view MPS I as a continuous spectrum of disease, with the most severely affected individuals on one, the less severely affected (attenuated) on the other end, and a wide range of different severities in between. All individuals with MPS I have an absence of, or insufficient levels of, the enzyme alpha-L-iduronidase. Children with MPS I inherit a defective gene from both their mother and father.
In the more severe form of MPS I, developmental delay is evident by the end of the first year, and patients usually stop developing between ages 2 and 4. This is followed by progressive mental decline and loss of physical skills. Language may be limited due to hearing loss and an enlarged tongue. In time, the clear layers of the cornea become clouded and retinas may begin to degenerate. Carpal tunnel syndrome (or similar compression of nerves elsewhere in the body) and restricted joint movement are common.
Affected children may be quite large at birth and appear normal but may have inguinal (in the groin) or umbilical (where the umbilical cord passes through the abdomen) hernias. Growth in height may be faster than normal but begins to slow before the end of the first year and often ends around age 3. Many children develop a short body trunk and a maximum stature of less than 4 feet. Distinct facial features (including flat face, depressed nasal bridge, and bulging forehead) become more evident in the second year. By age 2, the ribs have widened and are oar-shaped. The liver, spleen, and heart are often enlarged. Children may experience noisy breathing and recurring upper respiratory tract and ear infections. Feeding may be difficult for some children, and many experience periodic bowel problems. Children with severe MPS I often die before age 10 from obstructive airway disease, respiratory infections, or cardiac complications.
Although symptoms generally begin to appear after age 5 in children with attenuated MPS I, the diagnosis is most commonly made after age 10. Children with attenuated MPS I have normal intelligence or may have mild learning disabilities; some may have psychiatric problems. Glaucoma, retinal degeneration, and clouded corneas may significantly impair vision. Other problems include carpal tunnel syndrome or other nerve compression, stiff joints, claw hands and deformed feet, a short neck, and aortic valve disease. Some affected individuals also have obstructive airway disease and sleep apnea. Persons with attenuated MPS I can live into adulthood.
Within the MPS I disease spectrum are children whose symptoms generally begin between ages 3 and 8. Children may have moderate mental impairment and learning difficulties. Skeletal and systemic irregularities include short stature, marked smallness in the jaws, progressive joint stiffness, compressed spinal cord, clouded corneas, hearing loss, heart disease, coarse facial features, and umbilical hernia. Respiratory problems, sleep apnea, and heart disease may develop in adolescence. Some persons need continuous positive airway pressure during sleep to ease breathing. Life expectancy is generally into the late teens or early twenties.
Although no studies have been done to determine the frequency of MPS I in the United States, studies in British Columbia estimate that one in 100,000 babies born has severe MPS I. The estimate for attenuated MPS I is one in 500,000 births and one in 115,000 births for individuals whose disease symptoms fall between severe and attenuated.
- MPS II, Hunter syndrome, is caused by lack of the enzyme iduronate sulfatase. Although it was once divided into two groups based on the severity of symptoms, MPS II is now considered a continuous spectrum of disease. MPS II is the only one of the mucopolysaccharidoses in which the mother alone can pass the defective gene to a son. The incidence of MPS II syndrome is estimated to be one in every 100,000 to 150,000 male births.
Children with the more severe form of MPS II share many of the same clinical features associated with severe MPS I but with milder symptoms. Onset of the disease is usually between ages 2 and 4. Developmental decline is usually noticed between the ages of 18 and 36 months, followed by progressive loss of skills. Other clinical features include coarse facial features, skeletal irregularities, obstructive airway and respiratory complications, short stature, joint stiffness, retinal degeneration (but no corneal clouding), communicating hydrocephalus, chronic diarrhea, enlarged liver and spleen, and progressive hearing loss. Whitish skin lesions may be found on the upper arms, back, and upper legs. Death from upper airway disease or cardiovascular failure usually occurs by age 15.
Physical characteristics of children with a less severe form of MPS II are less obvious and progress at a much slower rate. Diagnosis is often made in the second decade of life. Intellect and social development are not affected. Skeletal problems may be less severe, but carpal tunnel syndrome and joint stiffness can restrict movement and height is somewhat less than normal. Other clinical symptoms include hearing loss, poor peripheral vision, diarrhea, and sleep apnea, although respiratory and cardiac complications can contribute to premature death. Persons with attenuated MPS II may live into their 50s or beyond.
- MPS III, Sanfilippo syndrome, is marked by severe neurological symptoms. These include progressive dementia, aggressive behavior, hyperactivity, seizures, some deafness and loss of vision, and an inability to sleep for more than a few hours at a time. MPS III affects children differently, and its progress will be faster in some than in others. Early mental and motor skill development may be somewhat delayed. Affected children show a marked decline in learning between ages 2 and 6, followed by eventual loss of language skills and loss of some or all hearing. Some children may never learn to speak. Aggressive behavior, hyperactivity, profound dementia, and irregular sleep may make children difficult to manage, particularly those who retain normal physical strength. As the disease progresses, children become increasingly unsteady on their feet and most are unable to walk by age 10.
Thickened skin and mild changes in facial features, bone, and skeletal structures become noticeable with age. Growth in height usually stops by age 10. Other problems may include narrowing of the airway passage in the throat and enlargement of the tonsils and adenoids, making it difficult to eat or swallow. Recurring respiratory infections are common.
There are four distinct types of MPS III, each caused by alteration of a different enzyme needed to completely break down the heparan sulfate sugar chain. Little clinical difference exists between these four types but symptoms appear most severe and seem to progress more quickly in children with type A. Life expectancy in MPS III is extremely varied. Most persons with MPS III live into their teenage years, and some live longer, into their twenties or thirties.
- MPS IIIA is caused by the missing or altered enzyme heparan N-sulfatase.
- MPS IIIB is caused by the missing or deficient enzyme alpha-N-acetylglucosaminidase.
- MPS IIIC results from the missing or altered enzyme acetyl-CoAlpha-glucosaminide acetyltransferase.
- MPS IIID is caused by the missing or deficient enzyme N-acetylglucosamine 6-sulfatase.
The incidence of MPS III (for all four types combined) is about one in 70,000 births.
- MPS IV, Morquio syndrome, is estimated to occur in one of every 200,000 births. Its two subtypes result from the missing or deficient enzymes N-acetylgalactosamine 6-sulfatase (Type A) or beta-galactosidase (Type B) needed to break down the keratan sulfate sugar chain. Clinical features are similar in both types but appear milder in MPS IVB. Onset is between ages 1 and 3. Neurological complications include spinal nerve and nerve root compression resulting from extreme, progressive skeletal changes, particularly in the ribs and chest; conductive and/or neurosensitive loss of hearing (see “What are the signs and symptoms?”); and clouded corneas. Intelligence is normal unless hydrocephalus develops and is not treated.
Physical growth slows and often stops around age 8. Skeletal abnormalities include a bell-shaped chest, a flattening or curvature of the spine, shortened long bones, and dysplasia of the hips, knees, ankles, and wrists. The bones that stabilize the connection between the head and neck can be malformed (odontoid hypoplasia); in these cases, a surgical procedure called spinal cervical bone fusion can be lifesaving. Restricted breathing, joint stiffness, and heart disease are also common. Children with the more severe form of MPS IV may not live beyond their twenties or thirties.
- Children with MPS VI, Maroteaux-Lamy syndrome, usually have normal intellectual development but share many of the physical symptoms found in severe MPS I. Caused by the deficient enzyme N-acetylgalactosamine 4-sulfatase, MPS VI has a variable spectrum of severe symptoms. Neurological complications include clouded corneas, deafness, thickening of the dura (the membrane that surrounds and protects the brain and spinal cord), and pain caused by compressed or traumatized nerves and nerve roots.
Growth is normal at first but stops suddenly around age 8. By age 10 children have developed a shortened trunk, crouched stance, and restricted joint movement. In more severe cases, children also develop a protruding abdomen and forward-curving spine. Skeletal changes (particularly in the pelvic region) are progressive and limit movement. Many children also have umbilical or inguinal hernias. Nearly all children have some form of heart disease, usually involving valve dysfunction.
- MPS VII, Sly syndrome, one of the least common forms of the mucopolysaccharidoses, is estimated to occur in fewer than one in 250,000 births. The disorder is caused by deficiency of the enzyme beta-glucuronidase. In its rarest form, MPS VII causes children to be born with hydrops fetalis, in which extreme amounts of fluid are retained in the body. Survival is usually a few months or less. Most children with MPS VII are less severely affected. Neurological symptoms may include mild to moderate intellectual impairment by age 3, communicating hydrocephalus, nerve entrapment, corneal clouding, and some loss of peripheral and night vision. Other symptoms include short stature, some skeletal irregularities, joint stiffness and restricted movement, and umbilical and/or inguinal hernias. Some patients may have repeated bouts of pneumonia during their first years of life. Most children with MPS VII live into the teenage or young adult years.
- As of 2001, only one case of MPS IX had been reported. The disorder results from hyaluronidase deficiency. Symptoms included nodular soft-tissue masses located around joints, with episodes of painful swelling of the masses and pain that ended spontaneously within 3 days. Pelvic radiography showed multiple soft-tissue masses and some bone erosion. Other traits included mild facial changes, acquired short stature as seen in other MPS disorders, and normal joint movement and intelligence.
What are the signs and symptoms of mucopolysaccharidoses ?
The mucopolysaccharidoses share many clinical features but have varying degrees of severity. These features may not be apparent at birth but progress as storage of glycosaminoglycans affects bone, skeletal structure, connective tissues, and organs. Neurological complications may include damage to neurons (which send and receive signals throughout the body) as well as pain and impaired motor function. This results from compression of nerves or nerve roots in the spinal cord or in the peripheral nervous system, the part of the nervous system that connects the brain and spinal cord to sensory organs such as the eyes and to other organs, muscles, and tissues throughout the body.
Depending on the mucopolysaccharidoses subtype, affected individuals may have normal intellect or may be profoundly impaired, may experience developmental delay, or may have severe behavioral problems. Many individuals have hearing loss, either conductive (in which pressure behind the ear drum causes fluid from the lining of the middle ear to build up and eventually congeal), neurosensitive (in which tiny hair cells in the inner ear are damaged), or both. Communicating hydrocephalus, in which the normal circulation of cerebrospinal fluid becomes blocked over time and causes increased pressure inside the head, is common in some of the mucopolysaccharidoses. Surgically inserting a shunt into the brain can drain fluid. The eye’s cornea often becomes cloudy from intracellular storage, and degeneration of the retina and glaucoma also may affect the patient’s vision.
Physical symptoms generally include coarse or rough facial features (including a flat nasal bridge, thick lips, and enlarged mouth and tongue), short stature with disproportionately short trunk (dwarfism), dysplasia (abnormal bone size and/or shape) and other skeletal irregularities, thickened skin, enlarged organs such as liver or spleen, hernias, and excessive body hair growth. Short and often claw-like hands, progressive joint stiffness, and carpal tunnel syndrome can restrict hand mobility and function. Recurring respiratory infections are common, as are obstructive airway disease and obstructive sleep apnea. Many affected individuals also have heart disease, often involving enlarged or diseased heart valves.
Another lysosomal storage disease often confused with the mucopolysaccharidoses is mucolipidosis. In this disorder, excessive amounts of fatty materials known as lipids (another principal component of living cells) are stored, in addition to sugars. Persons with mucolipidosis may share some of the clinical features associated with the mucopolysaccharidoses (certain facial features, bony structure abnormalities, and damage to the brain), and increased amounts of the enzymes needed to break down the lipids are found in the blood.
How are the Mucopolysaccharidoses diagnosed ?
Clinical examination and urine tests (excess mucopolysaccharides are excreted in the urine) are the first steps in the diagnosis of an MPS disease. Enzyme assays (testing a variety of cells or blood in culture for enzyme deficiency) are also used to provide definitive diagnosis of one of the mucopolysaccharidoses. Prenatal diagnosis using amniocentesis and chorionic villus sampling can verify if a fetus is affected with the disorder. Genetic counseling can help parents who have a family history of the mucopolysaccharidoses determine if they are carrying the mutated gene that causes the disorders.
Prognosis and Treatment of Mucopolysaccharidoses
Currently there is no cure for these disease syndromes. The prognosis depends on the type of mucopolysaccharidosis. A normal life span is possible. Some types, usually those that affect the heart, cause premature death.
In one type of mucopolysaccharidosis, attempts at replacing the abnormal enzyme have had limited, temporary success. Bone marrow transplantation and umbilical cord blood transplantation have had limited success in treating the mucopolysaccharidoses in some people. Bone marrow transplantation and umbilical cord blood transplantation are high-risk procedures and are usually performed only after family members receive extensive evaluation and counseling 49. However, death or disability often results, and this treatment remains controversial 48.
Disorders of Pyruvate Metabolism
Pyruvate is a substance that is formed in the processing of carbohydrates and proteins and that serves as an energy source for cells. Problems with pyruvate metabolism can limit a cell’s ability to produce energy and allow a buildup of lactic acid, a waste product. Many enzymes are involved in pyruvate metabolism. A hereditary deficiency in any one of these enzymes results in one of a variety of disorders, depending on which enzyme is missing.
Pyruvate metabolism disorders are caused by a lack of the ability to metabolize a substance called pyruvate. These disorders cause a buildup of lactic acid and a variety of neurologic abnormalities 48.
- A deficiency in any one of the enzymes involved in pyruvate metabolism leads to one of many disorders.
- Symptoms include seizures, intellectual disability, muscle weakness, and coordination problems.
- Some of these disorders are fatal.
- Some children are helped by diets that are either high in fat and low in carbohydrates or high in carbohydrates and low in protein.
Symptoms may develop any time between early infancy and late adulthood. Exercise and infections can worsen symptoms, leading to severe lactic acidosis. These disorders are diagnosed by measuring enzyme activity in cells from the liver or skin.
Pyruvate Dehydrogenase Complex Deficiency
This disorder is caused by a lack of a group of enzymes needed to process pyruvate. This deficiency results in a variety of symptoms, ranging from mild to severe. Some newborns with this deficiency have brain malformations. Other children appear normal at birth but develop symptoms, including weak muscles, seizures, poor coordination, and a severe balance problem, later in infancy or childhood. Intellectual disability is common.
This disorder cannot be cured, but some children are helped by a diet that is high in fat and low in carbohydrates 48.
Absence of Pyruvate Carboxylase
Pyruvate carboxylase is an enzyme. A lack of this enzyme causes a very rare condition that interferes with or blocks the production of glucose from pyruvate in the body. Lactic acid and ketones build up in the blood. Often, this disease is fatal. Children who survive have seizures and severe intellectual disability, although there are recent reports of children with milder symptoms. There is no cure, but some children are helped by eating frequent carbohydrate-rich meals and restricting dietary protein 48.
Glycogen Storage Diseases
Glycogen is made of many glucose molecules linked together. The sugar glucose is the body’s main source of energy for the muscles (including the heart) and brain. Any glucose that is not used immediately for energy is held in reserve in the liver, muscles, and kidneys in the form of glycogen and is released when needed by the body.
Glycogen storage diseases occur when there is a defect in the enzymes that are involved in the metabolism of glycogen, resulting in growth abnormalities, weakness, and confusion 48.
- Glycogen storage diseases are caused by lack of an enzyme needed to change glucose into glycogen and break down glycogen into glucose.
- Typical symptoms include weakness, sweating, confusion, kidney stones, and stunted growth.
- The diagnosis is made by examining a piece of tissue under a microscope (biopsy).
Treatment depends on the type of glycogen storage disease and usually involves regulating the intake of carbohydrates.
There are many different glycogen storage diseases (also called glycogenoses), each identified by a roman numeral. These diseases are caused by a hereditary lack of one of the enzymes that is essential to the process of forming glucose into glycogen and breaking down glycogen into glucose. About 1 in 20,000 infants has some form of glycogen storage disease.
Types and Characteristics of Glycogen Storage Diseases
Name | Affected Organs, Tissues, or Cells | Symptoms |
| Type O | Liver or muscle | Episodes of low blood sugar levels (hypoglycemia) during fasting if the liver is affected |
| von Gierke’s disease (type IA) | Liver and kidney | Enlarged liver and kidney, slowed growth, very low blood sugar levels, and abnormally high levels of acid, fats, and uric acid in blood |
| Type IB | Liver and white blood cells | Same as in von Gierke’s disease but may be less severe
Low white blood cell count, recurring infections, and inflammatory bowel disease |
| Pompe’s disease (type II) | All organs | Enlarged liver and heart and muscle weakness |
| Forbes’ disease (type III) | Liver, muscle, and heart | Enlarged liver or cirrhosis, low blood sugar levels, muscle damage, heart damage, and weak bones in some people |
| Andersen’s disease (type IV) | Liver, muscle, and most tissues | Cirrhosis, muscle damage, and delayed growth and development |
| McArdle disease (type V) | Muscle | Muscle cramps or weakness during physical activity |
| Hers’ disease (type VI) | Liver | Enlarged liver
Episodes of low blood sugar during fasting
Often no symptoms |
| Tarui’s disease (type VII) | Skeletal muscle and red blood cells | Muscle cramps during physical activity and red blood cell destruction (hemolysis) |
(Source 48)
Symptoms
Some of these diseases cause few symptoms. Others are fatal. The specific symptoms, age at which symptoms start, and their severity vary considerably among these diseases. For types II, V, and VII, the main symptom is usually weakness. For types I, III, and VI, symptoms are low levels of sugar in the blood and protrusion of the abdomen (because excess or abnormal glycogen may enlarge the liver). Low levels of sugar in the blood cause weakness, sweating, confusion, and sometimes seizures and coma. Other consequences for children may include stunted growth, frequent infections, and sores in the mouth and intestines.
Glycogen storage diseases tend to cause uric acid (a waste product) to accumulate in the joints, which can cause gout, and in the kidneys, which can cause kidney stones. In type I glycogen storage disease, kidney failure is common in the second decade of life or later.
Diagnosis and Treatment
The specific type of glycogen storage disease is diagnosed by examining a piece of muscle or liver tissue under a microscope (biopsy).
Treatment depends on the type of glycogen storage disease. For most types, eating many small carbohydrate-rich meals every day helps prevent blood sugar levels from dropping. For people who have glycogen storage diseases that cause low blood sugar levels, levels are maintained by giving uncooked cornstarch every 4 to 6 hours around the clock. For others, it is sometimes necessary to give carbohydrate solutions through a stomach tube all night to prevent low blood sugar levels from occurring at night.
Galactosemia
Galactose is a sugar that is present in milk and in some fruits and vegetables. A deficient enzyme or liver dysfunction can alter the metabolism, which can lead to high levels of galactose in the blood (galactosemia). There are different forms of galactosemia, but the most common and the most severe form is referred to as classic galactosemia.
Galactosemia (a high blood level of galactose) is caused by lack of one of the enzymes necessary for metabolizing galactose, a sugar present in lactose (milk sugar). A metabolite that is toxic to the liver and kidneys builds up. The metabolite also damages the lens of the eye, causing cataracts 48.
- Galactosemia is caused by lack of one of the enzymes needed to metabolize the sugar in milk.
- Symptoms include vomiting, jaundice, diarrhea, and abnormal growth.
- The diagnosis is based on a blood test.
- Even with adequate treatment, affected children still develop mental and physical problems.
- Treatment involves completely eliminating milk and milk products from the diet.
What causes galactosemia ?
Classic galactosemia is a rare genetic metabolic disorder. The gene defect for Galactosemia is a recessive genetic trait. This faulty gene only emerges when two carriers have children together and pass it to their offspring. For each pregnancy of two such carriers, there is a 25% chance that the child will be born with the disease and a 50% chance that the child will be a carrier for the gene defect. A child born with classic galactosemia inherits a gene for galactosemia from both parents, who are carriers. A child with Duarte galactosemia inherits a gene for classic galactosemia from one parent and a Duarte variant gene from the other parent 50.
Symptoms
Newborns with galactosemia seem normal at first but, within a few days or weeks, lose their appetite, vomit, become jaundiced, have diarrhea, and stop growing normally. White blood cell function is affected, and serious infections can develop. If treatment is delayed, affected children remain short and become intellectually disabled or may die.
Diagnosis
Galactosemia is detectable with a blood test. This test is done as a routine screening test for newborns in all states in the United States. Before conception, adults with a sibling or child known to have the disorder can be tested to find out whether they carry the gene that causes the disease. If two carriers conceive a child, that child has a 1 in 4 chance of being born with the disease.
Prognosis
If galactosemia is recognized at birth and adequately treated, liver and kidney problems do not develop, and initial mental development is normal. However, even with adequate treatment, children with galactosemia may have a lower intelligence quotient (IQ) than their siblings, and they often have speech problems. Girls often have ovaries that do not function, and only a few are able to conceive naturally. Boys, however, have normal testicular function.
Treatment
Galactosemia is treated by completely eliminating milk and milk products—the source of galactose—from an affected child’s diet. Galactose is also present in some fruits, vegetables, and sea products, such as seaweed. Doctors are not sure whether the small amounts in these foods cause problems in the long term. People who have the disorder must restrict galactose intake throughout life.
References- US Food and Drug Administration (FDA). Sugars. https://www.accessdata.fda.gov/scripts/interactivenutritionfactslabel/sugars.html or for pdf go to https://www.accessdata.fda.gov/scripts/interactivenutritionfactslabel/factsheets/Sugars.pdf
- Am J Clin Nutr. 2004 Apr;79(4):537-43. Consumption of high-fructose corn syrup in beverages may play a role in the epidemic of obesity. https://www.ncbi.nlm.nih.gov/pubmed/15051594/
- Nutr Rev. 2005 May;63(5):133-57. Dietary fructose: implications for dysregulation of energy homeostasis and lipid/carbohydrate metabolism. https://www.ncbi.nlm.nih.gov/pubmed/15971409/
- The 2015-2020 Dietary Guidelines for Americans. https://health.gov/dietaryguidelines/2015/
- The Scientific Advisory Committee on Nutrition. (2015) Carbohydrates and Health. Online. Available from: https://www.gov.uk/government/groups/scientific-advisory-committee-on-nutrition
- Department of Health. (1989) Dietary Sugars and Human Disease. Report on the panel on dietary sugars, 37. London: HMSO.
- Circulation. 2016;CIRCULATION AHA.115.018704. Sugar-Sweetened Beverage Consumption is Associated With Change of Visceral Adipose Tissue Over 6 Years of Follow-Up. http://circ.ahajournals.org/content/early/2016/01/06/CIRCULATIONAHA.115.018704
- Guthrie JF, Morton JF. Food sources of added sweeteners in the diets of Americans. J Am Diet Assoc 2000;100(51):43-48.
- Wang YC, Bleich SN, Gortmaker SL. Increasing caloric contribution from sugar-sweetened beverages and 100% fruit juices among US children and adolescents, 1988-2004. Pediatrics 2008;121(6):e1604-1614.
- Frazao E, Allshouse J. Strategies for intervention: commentary and debate. J of Nutr 2003;844S-847S.
- Briefel RR, Johnson CL. Secular trends in dietary intake in the United States. Annu Rev Nutr 2004;24:401-431.
- Circulation. 2009 Sep 15;120(11):1011-20. doi: 10.1161/CIRCULATIONAHA.109.192627. Epub 2009 Aug 24. Dietary sugars intake and cardiovascular health: a scientific statement from the American Heart Association. https://www.ncbi.nlm.nih.gov/pubmed/19704096/
- Block G. Foods contributing to energy intake in the US: data from NHANES III and NHANES 1999-2000. Journal of Food Composition and Analysis. 2004;14:439–447.
- Int J Obes Relat Metab Disord. 2000 Jun;24(6):794-800. Liquid versus solid carbohydrate: effects on food intake and body weight. https://www.ncbi.nlm.nih.gov/pubmed/10878689/
- Physiol Behav. 1996 Jan;59(1):179-87. Dietary compensation by humans for supplemental energy provided as ethanol or carbohydrate in fluids. https://www.ncbi.nlm.nih.gov/pubmed/8848479/
- Am J Clin Nutr. 2004 Aug;80(2):348-56. Glycemic index, glycemic load, and dietary fiber intake and incidence of type 2 diabetes in younger and middle-aged women. https://www.ncbi.nlm.nih.gov/pubmed/15277155/
- Nielsen SJ, Siega-Riz AM, Popkin BM. Trends in energy intake in U.S. between 1977 and 1996: similar shifts seen across age groups. Obes Res 2002;10(5):370-378.
- French SA, Story M, Jeffery RW. Environmental influences on eating and physical activity. Ann Rev Public Health 2001;22:308-335.
- Ogden CL, Carroll MD, Curtin LR, et al. Prevalence of overweight and obesity in the United States, 1999-2004. JAMA. 2006;295(13):1549-1555.
- Agras WS, Mascola AJ. Risk factors for childhood overweight. Curr Opin Pediatr 2005;17(5):648-652.
- Mensink RP, Zock PL, Kester AD, Katan MB. Effects of dietary fatty acids and carbohydrates on the ratio of serum total to HDL cholesterol and on serum lipids and apolipoproteins: a meta-analysis of 60 controlled trials. Am J Clin Nutr 2003;77:1146-1155.
- American Heart Association – Sugar Intake – http://www.heart.org/HEARTORG/Encyclopedia/Heart-and-Stroke-Encyclopedia_UCM_445084_ContentIndex.jsp?title=sugar%20intake
- Appetite. 2017 Jul 1;114:64-72. doi: 10.1016/j.appet.2017.03.024. Epub 2017 Mar 19. – ‘Eating dependence and weight gain; no human evidence for a ‘sugar-addiction’ model of overweight.’
- Am J Clin Nutr. 2016 Oct;104(4):1144-1150. Epub 2016 Aug 31. – Heritability of high sugar consumption through drinks and the genetic correlation with substance use.
- Sugar addiction: the state of the science. – Eur J Nutr. 2016 Nov;55(Suppl 2):55-69. doi: 10.1007/s00394-016-1229-6. Epub 2016 Jul 2.
- Barlow SE. Expert committee recommendations regarding the prevention, assessment, and treatment of child and adolescent overweight and obesity: summary report. Pediatrics 2007;120:S164-192.
- Miller J, Rosenbloom A, Silverstein J. Childhood obesity. J Clin Endocrinol Metab 2004;89(9):4211-4218.
- Forshee RA, Anderson PA, Storey ML. Sugar-sweetened beverages and body mass index in children and adolescents: a meta-analysis. Am J Clin Nutr 2008;87:1662-1671.
- Expert Committee Recommendations on the Assessment, Prevention, and Treatment of Child and Adolescent Overweight and Obesity. January 25, 2007.
- https://www.cnpp.usda.gov/dietary-guidelines
- The recommendation to limit intake of calories from added sugars to less than 10 percent per day is a target based on food pattern modeling and national data on intakes of calories from added sugars that demonstrate the public health need to limit calories from added sugars to meet food group and nutrient needs within calorie limits. For most calorie levels, there are not enough calories available after meeting food group needs to consume 10 percent of calories from added sugars and 10 percent of calories from saturated fats and still stay within calorie limits.
- The recommendation to limit intake of calories from saturated fats to less than 10 percent per day is a target based on evidence that replacing saturated fats with unsaturated fats is associated with reduced risk of cardiovascular disease. For most calorie levels, there are not enough calories available after meeting food group needs to consume 10 percent of calories from added sugars and 10 percent of calories from saturated fats and still stay within calorie limits.
- The recommendation to limit intake of sodium to less than 2,300 mg per day is the UL for individuals ages 14 years and older set by the IOM. The recommendations for children younger than 14 years of age are the IOM age- and sex-appropriate ULs (see Appendix 7. Nutritional Goals for Age-Sex Groups Based on Dietary Reference Intakes and Dietary Guidelines Recommendations).
- It is not recommended that individuals begin drinking or drink more for any reason. The amount of alcohol and calories in beverages varies and should be accounted for within the limits of healthy eating patterns. Alcohol should be consumed only by adults of legal drinking age. There are many circumstances in which individuals should not drink, such as during pregnancy. See Appendix 9. Alcohol for additional information.
- U.S. Department of Agriculture & U.S. Department of Health and Human Services: Dietary Guidelines for Americans 2010 – https://www.cnpp.usda.gov/sites/default/files/dietary_guidelines_for_americans/PolicyDoc.pdf
- The Dietary Guidelines for Americans 2015-2020 – https://www.cnpp.usda.gov/dietary-guidelines
- Centers for Disease Control and Prevention – Morbidity and Mortality Weekly Report February 26,2016 – https://www.cdc.gov/mmwr/volumes/65/wr/pdfs/mm6507.pdf
- Drewnowski A, Rehm CD. Consumption of added sugars among US children and adults by food purchase location and food source. Am J Clin Nutr 2014;100:901–7. http://dx.doi.org/10.3945/ajcn.114.089458
- Malik VS, Popkin BM, Bray GA, Després J-P, Hu FB. Sugar-sweetened beverages, obesity, type 2 diabetes mellitus, and cardiovascular disease risk. Circulation 2010;121:1356–64. http://dx.doi.org/10.1161/CIRCULATION American Heart Association.109.876185
- Kit BK, Fakhouri TH, Park S, Nielsen SJ, Ogden CL. Trends in sugar-sweetened beverage consumption among youth and adults in the United
States: 1999–2010. Am J Clin Nutr 2013;98:180–8. http://dx.doi.org/10.3945/ajcn.112.057943 - Marriott BP, Olsho L, Hadden L, Conner P. Intake of added sugars and selected nutrients in the United States, National Health and Nutrition Examination Survey (NHANES) 2003–2006. Crit Rev Food Sci Nutr 50(3):228–58. 2010.
- Bowman SA. Diets of individuals based on energy intakes from added sugars. Family Economics and Nutrition Review. 12(2):31–8. 1999.
- Vartanian LR, Schwartz MB, Brownell KD. Effects of soft drink consumption on nutrition and health: A systematic review and meta-analysis. Am J Public Health 97:667–75. 2007.
- Johnson RK, Appel LJ, Brands M, et al. on behalf of the American Heart Association Nutrition Committee of the Council on Nutrition, Physical Activity, and Metabolism and the Council on Epidemiology and Prevention. Dietary sugars intake and cardiovascular health: a scientific statement from the American Heart Association. Circulation 2009. Published online before print August 24, 2009. 10.1161/CIRCULATION American Heart Association.109.192627.
- American Heart Association Sugar and Cardiovascular Disease: Refining the Message on a Complex Topic – http://professional.heart.org/professional/ScienceNews/UCM_433029_Sugar-and-Cardiovascular-Disease-Refining-the-Message-on-a-Complex-Topic.jsp
- Butland B, Jebb S, Kopelman P, et al. (2007) Tackling obesities: future choices – project report (2nd Ed). London: Foresight Programme of the Government Office for Science. Online. Available from: http://www.bis.gov.uk/assets/foresight/docs/obesity/17.pdf
- U.S. National Library of Medicine. Medline Plus. Carbohydrate Metabolism Disorders. https://medlineplus.gov/carbohydratemetabolismdisorders.html
- Merck Sharp & Dohme Corp. Merck Manual. Disorders of Carbohydrate Metabolism. https://www.merckmanuals.com/home/children-s-health-issues/hereditary-metabolic-disorders/disorders-of-carbohydrate-metabolism
- National Institute of Neurological Disorders and Stroke. Mucopolysaccharidoses Information Page. https://www.ninds.nih.gov/Disorders/All-Disorders/Mucopolysaccharidoses-Information-Page
- American Liver Foundation. Galactosemia. http://www.liverfoundation.org/abouttheliver/info/galactosemia/
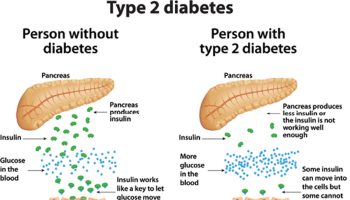


