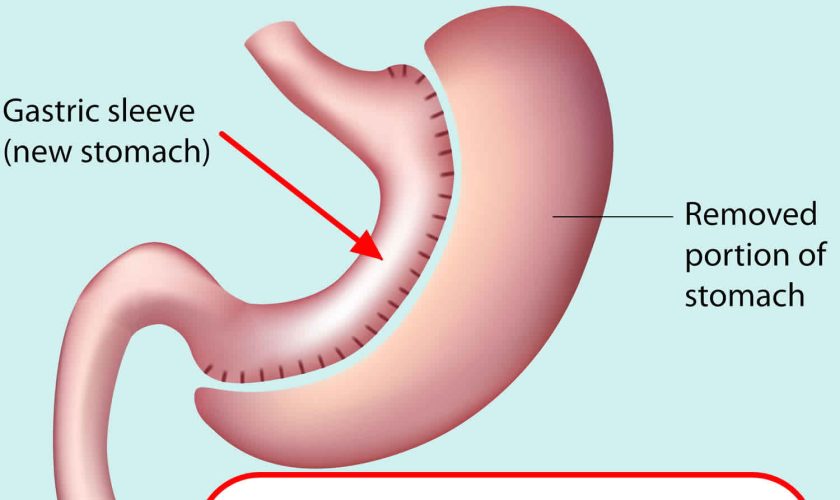
Gastric sleeve surgery
Gastric sleeve surgery, also called “vertical sleeve gastrectomy” (VSG) or “sleeve gastrectomy“, is a newer type of weight loss surgery (bariatric surgery) where a surgeon removes most of your stomach (removing approximately 80 to 85% of the greater curvature of stomach) and makes a narrow tube or “gastric sleeve” out of the remaining stomach, leaving only a banana-shaped section that is closed with staples (Figure 1) 1, 2, 3, 4. Your new, banana-shaped stomach is much smaller than your original stomach. After the gastric sleeve surgery, your stomach will hold only about a tenth of what it did before, making you feel full sooner after eating a small amount of food and be less hungry. You might also feel less hungry because your smaller stomach will produce lower levels of a hormone called ghrelin, which causes hunger and you may lose from 50 to 90 pounds. Taking out part of your stomach may also affect other hormones and bacteria in your gastrointestinal system that affect appetite and metabolism. Gastric sleeve surgery cannot be reversed because some of your stomach is permanently removed. Endoscopic gastric sleeve surgery is less invasive and cheaper than other forms of bariatric surgery.
Gastric sleeve surgery is done as a laparoscopic surgery, with small incisions in the upper abdomen. Most of the left part of the stomach is removed. The remaining stomach is then a narrow tube called a sleeve. Food empties out of the bottom of the stomach into the small intestine the same way that it did before surgery. The small intestine is not operated on or changed. After the surgery, less food will make you full when eating.
Like other weight-loss procedures, endoscopic gastric sleeve surgery requires commitment to a healthier lifestyle. Gastric sleeve surgery isn’t a “fix it and forget it” kind of surgery. To be considered for gastric sleeve surgery, a person must be committed to changing his or her eating and exercise habits over the long term to help ensure the long-term success of endoscopic gastric sleeve surgery. Not everyone who wants the gastric sleeve surgery will be eligible to get it.
Figure 1. Gastric sleeve surgery
Gastric sleeve surgery is typically done only after you’ve tried to lose weight by improving your diet and exercise habits.
Doctors consider a number of things when deciding if weight loss surgery is the right choice for you. These include whether you are:
- at least 14 years old and near adult height with more than 100 pounds of extra weight to lose
- healthy enough to handle surgery
- have medical problems that could improve with significant weight loss, such as sleep apnea, diabetes, or heart problems
- have proved that you can stick to a healthy diet and get regular exercise
- have family members who will provide emotional and practical support (like driving to every doctor’s visit or buying healthy food)
In general, gastric sleeve surgery could be an option for you if 5, 6, 7, 8:
- Your body mass index (BMI) is 40 kg/m² or higher (extreme obesity).
- Your BMI is 35 to 39.9 kg/m² (obesity), and you have a serious weight-related health problem, such as type 2 diabetes, high blood pressure or severe obstructive sleep apnea. In some cases, you may qualify for certain types of weight-loss surgery if your BMI is 30 to 34 kg/m² and you have serious weight-related health problems.
You must also be willing to make permanent changes to lead a healthier lifestyle. You may be required to participate in long-term follow-up plans that include monitoring your nutrition, your lifestyle and behavior, and your medical conditions.
Check with your health insurance plan or your regional Medicare or Medicaid office to find out if your policy covers weight-loss surgery.
Endoscopic gastric sleeve surgery can lead to significant weight loss. The amount of weight you lose also depends on how much you can change your lifestyle habits.
But studies have shown promising results. A recent study of people with an average body mass index (BMI) around 38 kg/m² found that endoscopic sleeve gastroplasty led to an average weight loss of 39 pounds (17.8 kilograms) after 6 months. After 12 months, weight loss was 42 pounds (19 kilograms).
In a study of people with an average body mass index (BMI) of about 45 kg/m², the procedure resulted in an average weight loss of about 73 pounds (33 kilograms) during the first six months.
As with other weight loss procedures and surgeries that lead to significant weight loss, endoscopic gastric sleeve surgery may improve conditions often related to being overweight, including:
- Gastroesophageal reflux disease (GERD)
- Heart disease
- Stroke
- High blood pressure
- High cholesterol
- Obstructive sleep apnea
- Type 2 diabetes
- Stroke
- Cancer
- Infertility
How much weight can I expect to lose?
The number of pounds people lose after weight-loss surgery depends on the individual and on the type of surgery 2. One study found that after 1 year, people undergoing adjustable gastric banding, gastric sleeve, and gastric bypass lost between 38 and 87 pounds. Of the three most common procedures, gastric bypass produced greater weight loss, on average, but had more complications in the month after surgery. Most people regained some weight over time, but that amount was usually small compared with their initial weight loss 9.
Your weight loss could be different. Remember, reaching your goal depends not only on the surgery but also on sticking with healthy lifestyle habits.
When weight-loss surgery doesn’t work
It’s possible to not lose enough weight or to regain weight after any type of weight-loss procedure, even if the procedure itself works correctly. Up to 18% of patients fail to achieve a body mass index (BMI)<35kg/m², and unsuccessful weight loss has been reported in 10–30% of patients who have undergone weight loss surgery 10. This weight gain can happen if you don’t follow the recommended lifestyle changes. To help avoid regaining weight, you must make permanent healthy changes in your diet and get regular physical activity and exercise.
Gastric sleeve surgery disadvantages
When you get gastric sleeve surgery, you’re making a huge change to the way your body handles food. It can take a while to get used to your body’s new normal.
Here are some of the problems you might have in the months after gastric sleeve surgery:
- If you eat too much food or eat too fast, you might throw up, have diarrhea, or get acid reflux.
- Food might move too fast through your digestive system, causing nausea, cramps, and diarrhea (doctors call this “dumping syndrome”).
- If you don’t eat enough nutritious food and don’t take your daily vitamin and mineral supplements, you might develop vitamin and mineral deficiencies. This also may happen if your body can’t absorb enough nutrients.
- After you lose lots of weight, you may have loose skin.
If you have a lot of pain or bloating in your belly or you throw up a lot, call your doctor right away. It could be a sign there’s a problem that needs medical attention.
Gastric sleeve surgery is not for everyone. But it can really help people who have serious health problems or are at risk for health problems because of their weight. If you’re worried about your weight or think you may benefit from weight loss surgery, talk to your doctor.
Where to find a weight loss surgeon near me?
To find a board certified weight loss surgeon (the American Society for Metabolic and Bariatric Surgery) please go here https://asmbs.org/patients/find-a-provider
Gastric sleeve vs Gastric bypass surgery
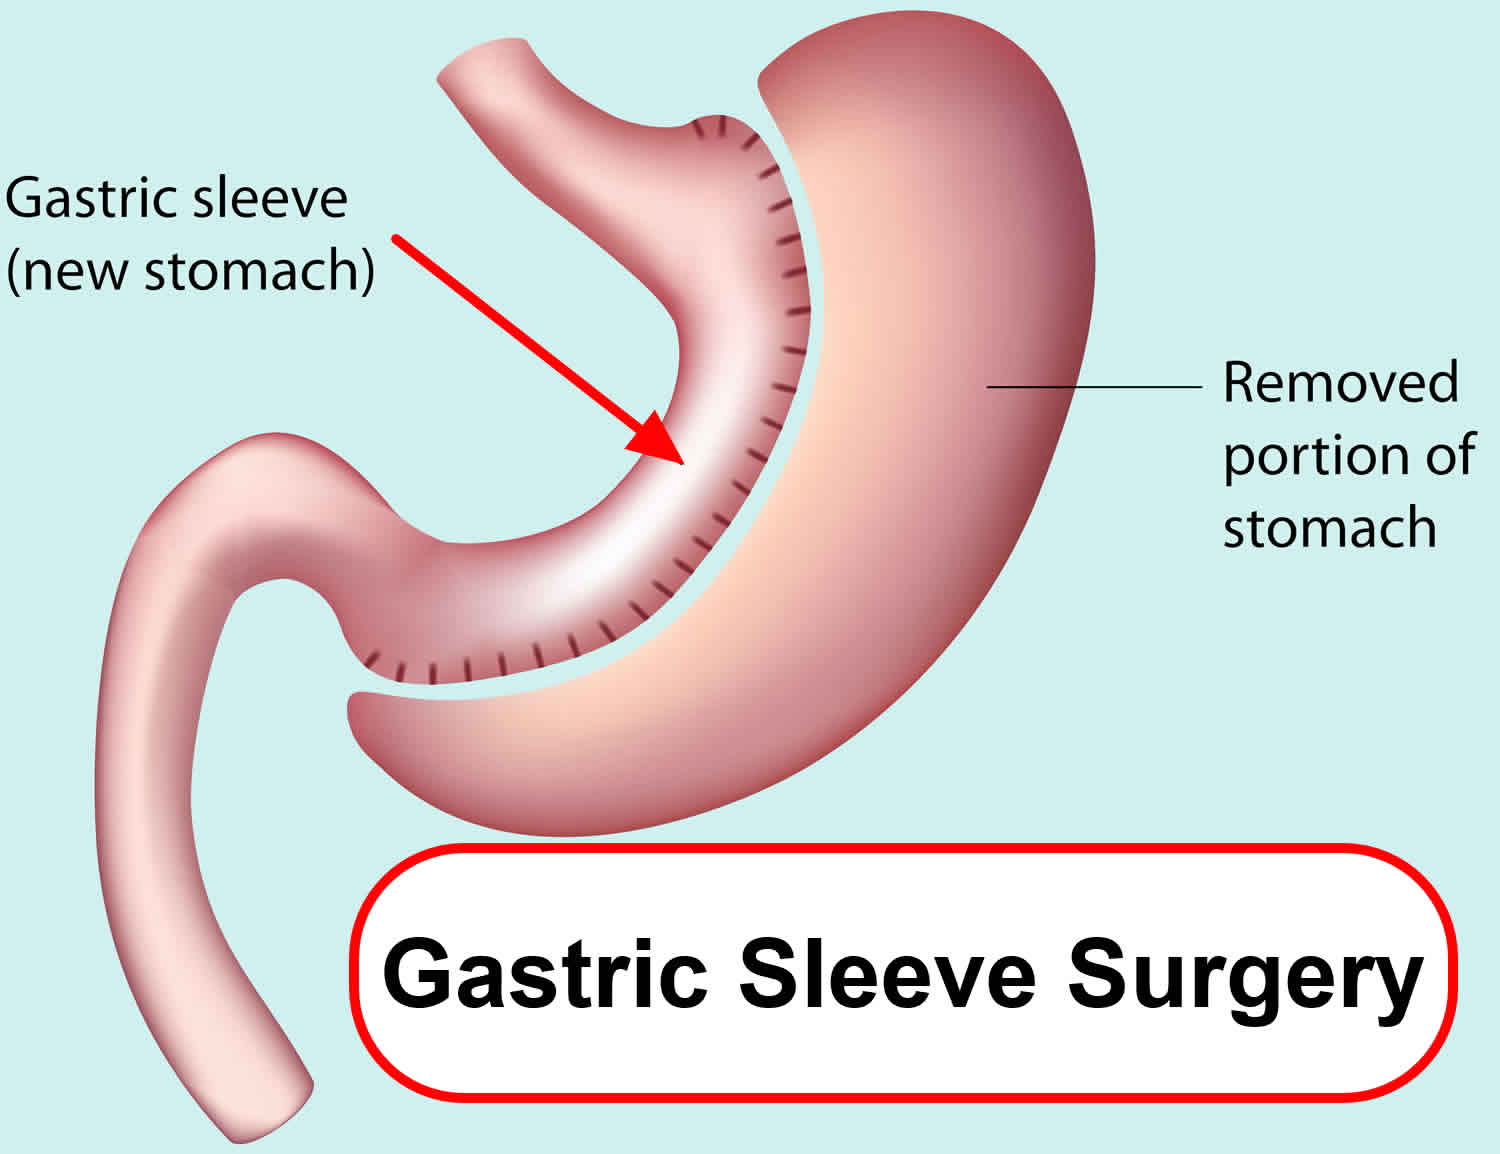
Gastric sleeve surgery, also called “vertical sleeve gastrectomy” (VSG) or “sleeve gastrectomy“, is a newer type of weight loss surgery (bariatric surgery) where a surgeon removes most of your stomach (removing approximately 80% of the stomach) and makes a narrow tube or “sleeve” out of the remaining stomach, leaving only a banana-shaped section that is closed with staples (Figure 1). Your new, banana-shaped stomach is much smaller than your original stomach. After the gastric sleeve surgery, your stomach will hold only about a tenth of what it did before, making you feel full sooner after eating a small amount of food and be less hungry. You might also feel less hungry because your smaller stomach will produce lower levels of a hormone called ghrelin, which causes hunger and you may lose from 50 to 90 pounds. Taking out part of your stomach may also affect other hormones and bacteria in your gastrointestinal system that affect appetite and metabolism. Gastric sleeve surgery cannot be reversed because some of your stomach is permanently removed. Endoscopic gastric sleeve surgery is less invasive and cheaper than other forms of bariatric surgery.
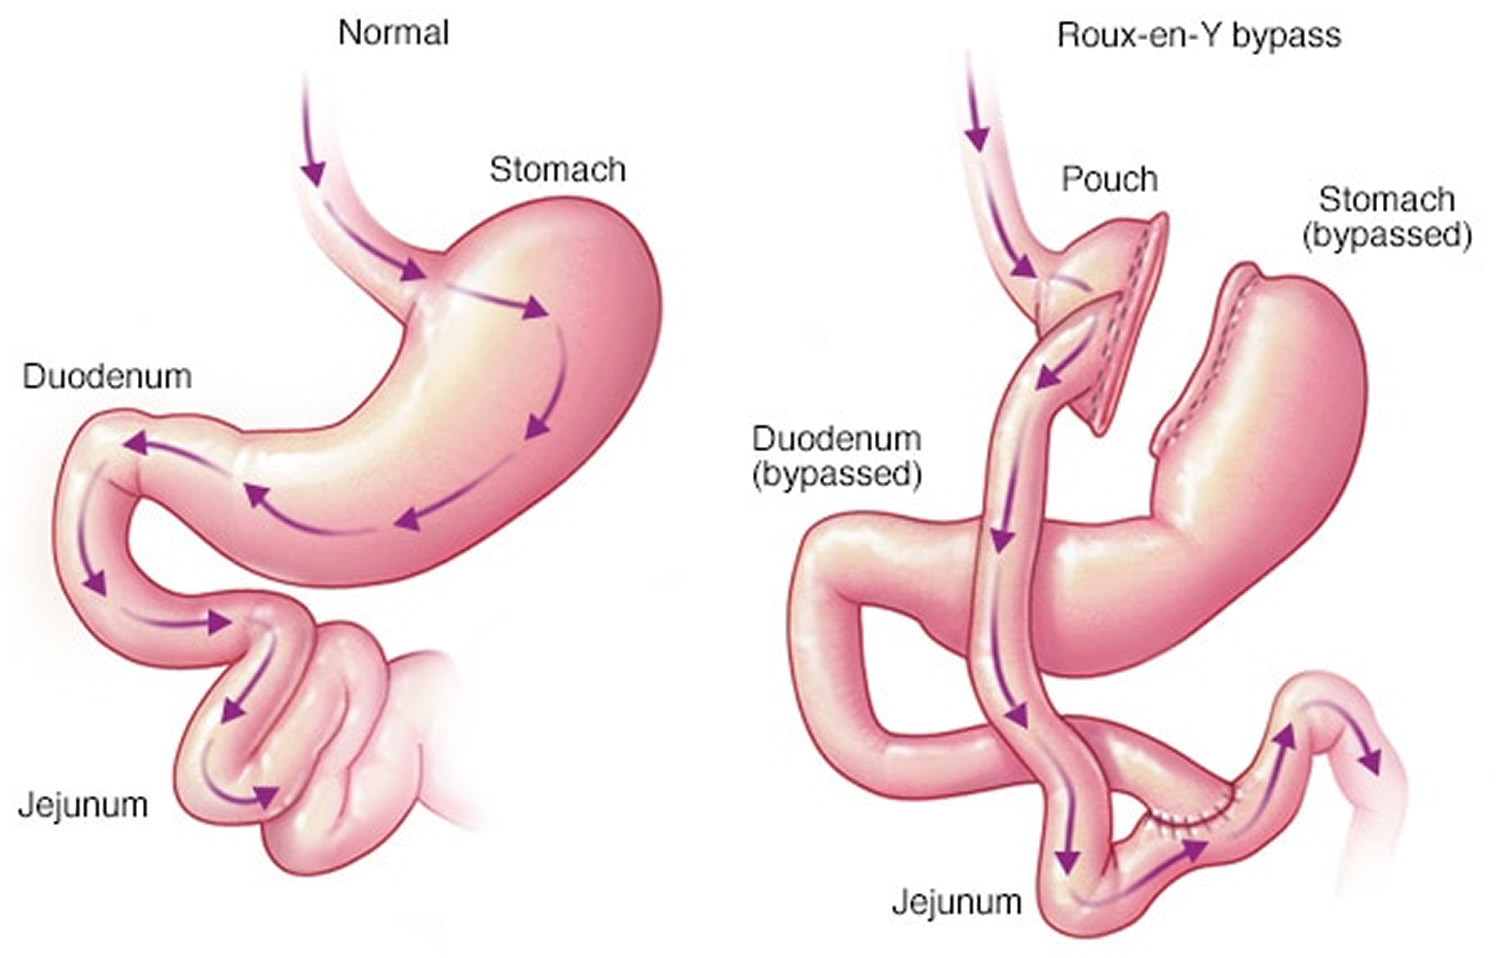
In contrast, a gastric bypass surgery also called Roux-en-Y gastric bypass is a type of weight-loss surgery (bariatric surgery) where surgical staples are used to create a small pouch at the top of your stomach (Figure 2). This pouch will hold about 1 cup of food. The pouch is then connected to your small intestine, bypassing (missing out) the rest of the stomach. This means it takes less food to make you feel full and you’ll absorb fewer calories from the food you eat because the food you eat will bypass most of your stomach and the upper part of your small intestine. Gastric bypass surgery is one of the most common types of bariatric surgery in the United States. Gastric bypass surgery is done when diet and exercise haven’t worked or when you have serious health problems because of your weight.
Unlike gastric sleeve, in gastric bypass surgery or Roux-en-Y gastric bypass surgery, the rest of your stomach will still be there, but food won’t go to it. The small pouch at the top of your stomach is the only part of your stomach that receives food. This greatly limits the amount that you can comfortably eat and drink at one time.
Next, your small intestine is then cut a short distance below the main stomach and connected to the new pouch. Your surgeon will attach one end of your small intestine to the small stomach pouch and the other end lower down on the small intestine, making a “Y” shape. That’s the bypass part of the procedure. This allows digestive juices in your stomach to flow from the bypassed part of the small intestine to the lower part of the small intestine, so that food can be fully digested. The main part of the stomach, however, continues to make digestive juices. The portion of the small intestine still attached to the main stomach is reattached farther down. This allows the digestive juices to flow to the small intestine. Because food now bypasses the first portion of your small intestine called the duodenum, fewer nutrients and calories are absorbed.
The gastric bypass surgery also changes hormones, bacteria, and other substances in the gastrointestinal tract that may affect appetite and metabolism. The rest of your stomach is still there. It delivers chemicals from the pancreas to help digest food that comes from the small pouch. Doctors use the laparoscopic method for most gastric bypasses.
Gastric bypass is difficult to reverse, although a surgeon may do it if medically necessary.
Gastric bypass surgery can provide long-term weight loss. The amount of weight you lose depends on your type of surgery and your change in lifestyle habits. It may be possible to lose 60 percent, or even more, of your excess weight within two years.
Most people lose weight for 1 to 2 years after gastric bypass or gastric sleeve surgery, then they stop losing weight. However, neither gastric bypass surgery nor gastric sleeve surgery is a miracle procedure — and it isn’t for everyone. Having gastric bypass or other weight-loss surgery doesn’t guarantee that you’ll lose all your excess weight or that you’ll keep it off over the long term. Nor is it a way to avoid making changes in your diet and exercise habits. In fact, you can regain the weight you lose with gastric bypass surgery if you don’t stick with the lifestyle changes. But if you think gastric bypass surgery or gastric sleeve surgery might be right for you, talk with your doctor 11.
Many factors will determine which type of surgery is the best type for you, including how much weight you need to lose and any illnesses you might have.
Your doctor will do a detailed assessment and discuss with you the best option, including the risks.
Iron deficiency and anemia are more common after a gastric bypass than after a sleeve gastrectomy or an adjustable gastric band. This is especially true in women. In fact, iron deficiency can occur in more than half of women who are past menopause when they have gastric bypass surgery.
Figure 2. Gastric sleeve vs Gastric bypass
Comparison of Bariatric Surgical Effectiveness
Quantifying the comparative outcomes of bariatric surgery have been challenging because of the evolution of surgical procedures, the availability of laparoscopic vs. open techniques, categorization of short- vs. long-term consequences and the difference in presurgical risk among patients 12. The National Institutes of Health–initiated Longitudinal Assessment of Bariatric Surgery Consortium is conducting prospective, multicenter, cohort studies using standardized techniques to assess the safety and clinical response of bariatric surgery 13.
In general, Roux-en-Y gastric bypass seems to lead to the greatest weight loss during the first two postsurgical years, followed by laparoscopic sleeve gastrectomy and laparoscopic adjustable gastric banding. It is unclear if there is a significant long-term difference in weight loss between Roux-en-Y gastric bypass and laparoscopic sleeve gastrectomy (Table 2) 14, 15. Increasing evidence that laparoscopic adjustable gastric banding results in more long-term complications, more reoperations, and less weight loss has made this procedure less common 16. Dyslipidemia, type 2 diabetes, hypertension, and perception of quality of life improved after weight loss surgery 17. In this cohort study 18, patients undergoing Roux-en-Y gastric bypass lost 21% more of their baseline weight than matched nonsurgical patients at 10 years, and Roux-en-Y gastric bypass induced significantly greater weight loss than sleeve gastrectomy or adjustable gastric banding at 4 years.
Remission of type 2 diabetes occurs in 60% to 80% of Roux-en-Y gastric bypass patients at one to two years postsurgery 19. Recent longer-term studies indicate that this remission is retained in approximately 40% of patients at 10 years and 30% at 15 years 20. Several recent reviews support bariatric surgery for the treatment of diabetes in patients with a BMI less than 35 kg/m² 21.
The Swedish Obese Subjects prospective cohort study found that surgery was associated with a 29% lower mortality risk from any cause after 16 years 22. In a retrospective cohort study of almost 8,000 patients undergoing bariatric surgery, mortality from disease, including cardiovascular disease and cancer, decreased by 40% compared with the control group 23. In a more recent retrospective cohort study of 2,500 surgical patients and 7,462 matched controls receiving care in the Veterans Administration system, the surgical patients had a significant reduction in 10-year all-cause mortality 24.
In 2017, investigators in the United States 25 and Sweden 26 simultaneously reported long-term outcomes for weight loss and comorbidities in adolescents who underwent gastric bypass surgery. Eight-year (United States) and 5-year (Sweden) post-gastric bypass surgery follow-up assessments indicated 30% and 28% BMI reductions, respectively. Both research groups documented important improvements in health. In summary, the two long-term, prospective studies demonstrate excellent durability of weight loss and response of comorbidities for adolescents who have gastric bypass surgery. These studies also reported the typical nutritional consequences of gastric bypass surgery that are commonly seen in studies in adults, and this must be taken into consideration when counseling patients about long-term risks of gastric bypass surgery.
In the U.S. study, remission of type 2 diabetes occurred in 88% (n = 7) 25. The study did not report any incident type 2 diabetes during the 8 years 25. The study also reported dyslipidemia (abnormally elevated cholesterol or fats in your blood) remission in 64% (n = 29) and incident dyslipidemia in four of eight subjects who did not have dyslipidemia at baseline 25. The study reported high blood pressure (hypertension) remission in 76% (n = 19) and incident hypertension in only 10% (3 of 29) participants without hypertension at baseline 27.
The Swedish study reported similar health improvements, with remission of comorbid conditions in 74% to 100% of participants 26. The study reported remission of type 2 diabetes in 3 of 3 participants, disturbed glucose homeostasis in 18 of 21, dyslipidemia in 43 of 52, elevated blood pressure in 11 of 12, inflammation (high-sensitivity C-reactive protein ≥ 2 mg/L) in 45 of 61, and elevated liver enzymes in 19 of 19 participants 26.
Both studies also reported long-term nutritional effects. The U.S. study reported mild anemia in 46% (n = 25), hyperparathyroidism in 45% (n = 22), and low vitamin B12 levels in 16% (n = 8) at long-term follow-up. At 5 years in the Swedish study, 63% (46 of 73) had vitamin D (25-hydroxy vitamin D) insufficiency (<50 nmol/L) and 66% (51 of 77) had low ferritin and/or iron levels. The prevalence of anemia rose from 10% (8 of 78) to 32% (25 of 77), and 22% had low vitamin B12 levels.
Weight regain is a concern in a subset of patients following weight loss surgery; the cause appears to be multifactorial. A systematic review from 2013 identified nutritional indiscretion, mental health issues, endocrine and metabolic alterations, physical inactivity, and anatomic surgical failure as principal causes 28. Endoscopic or surgical revision is an option in some patients who experience weight regain. Further study is necessary to determine predictors of suboptimal weight loss and weight regain, as well as the effectiveness of treatment with surgical revision or other modalities 29.
Recently, the Longitudinal Assessment of Bariatric Surgery (LABORATORIES) (a multicenter bariatric surgery research consortium funded by the National Institutes of Health) reported a 30-day overall bariatric surgery mortality rate of 0.3%. For laparoscopic gastric bypass surgery, it reported a 30-day mortality rate of 0.2% 30.
A serious complication occurred in 4.1% of all patients 27. Factors that predicted a major complication include high BMI, extreme obstructive sleep apnea, inability to walk 200 feet, and a history of deep vein thrombosis. Other studies have reported different risk profiles. Studies consistently report that the experience of both the surgeon and the surgical center are predictors of safety 30.
Mid-term and longer term complications have been well described, although determining their incidence is limited by a progressively greater number of patients lost to follow-up 31. These include, but are not limited to, intestinal obstruction, marginal ulcer, ventral hernia, and gallstones. Metabolic complications reported include kidney stones, osteoporosis, and low blood sugar levels (hypoglycemia). Mineral and vitamin deficiencies and weight regain are reported in variable numbers of patients. Micronutrient deficiencies following gastric bypass include: iron, 33% to 55%; calcium/vitamin D, 24% to 60%; vitamin B12, 24% to 70%; copper, 10% to 15%; and thiamine, <5% 32. Established guidelines recommend routine nutrient supplementation to include multivitamins, vitamin B12, iron, minerals, calcium, and vitamin D 33, 34.
Perioperative complications specific to laparoscopic gastric band are less frequent, with near zero mortality 27. Longer term complications, however, continue to occur at a rate of ∼2% per year 27. These longer term complications include erosion of the gastric wall by the band and slippage or herniation of the body of the stomach, thereby creating obstructions within the band. Inadequate weight loss is the most common cause of laparoscopic gastric band failure. Complications following other device placement procedures occur but are infrequent and generally less severe. However, there is a tradeoff between reduced complication rates and the severity of complications vs efficacy of weight loss.
In summary, both perioperative and longer term complications occur after all weight loss surgical procedures 27.
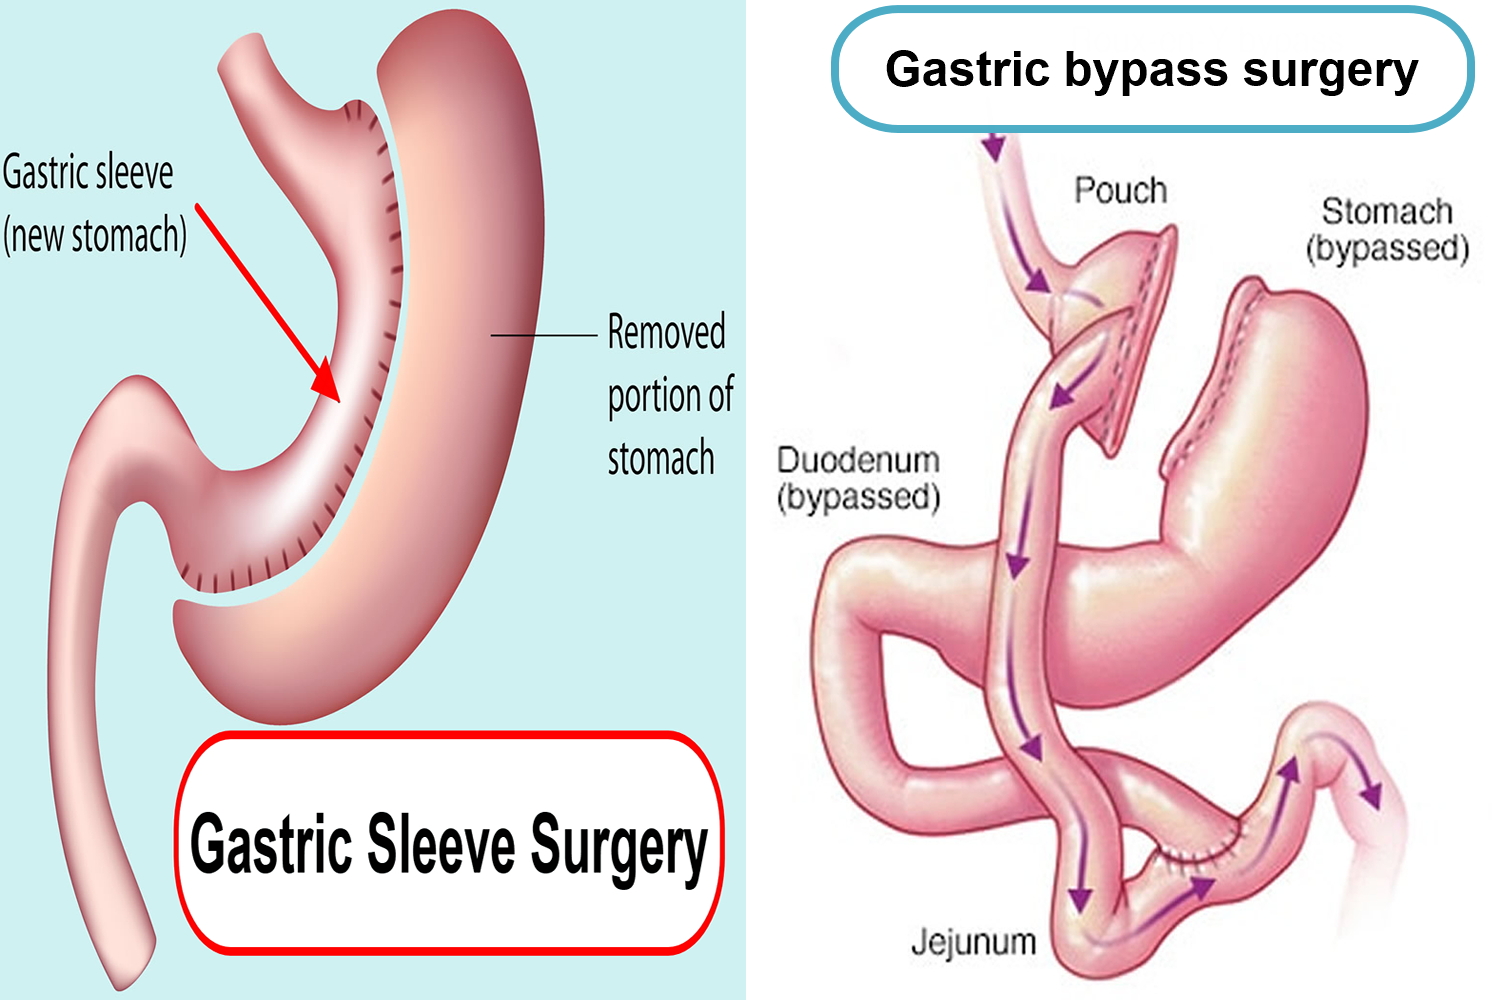
Figure 3. The three most commonly performed weight loss operations
Footnote: (A) The laparoscopic gastric band is placed around the upper stomach to restrict the transit of ingested food. (B) Laparoscopic sleeve gastrectomy involves separation of the greater curvature from the omentum and splenic attachments. (C) Gastric bypass surgery (Roux-en-Y gastric bypass) involves the rearrangement of the alimentary canal, such that food bypasses most of the stomach, all of the duodenum, and a portion of the proximal jejunum.
[Source 27 ]Table 1. Comparison of outcomes for bariatric surgical procedures
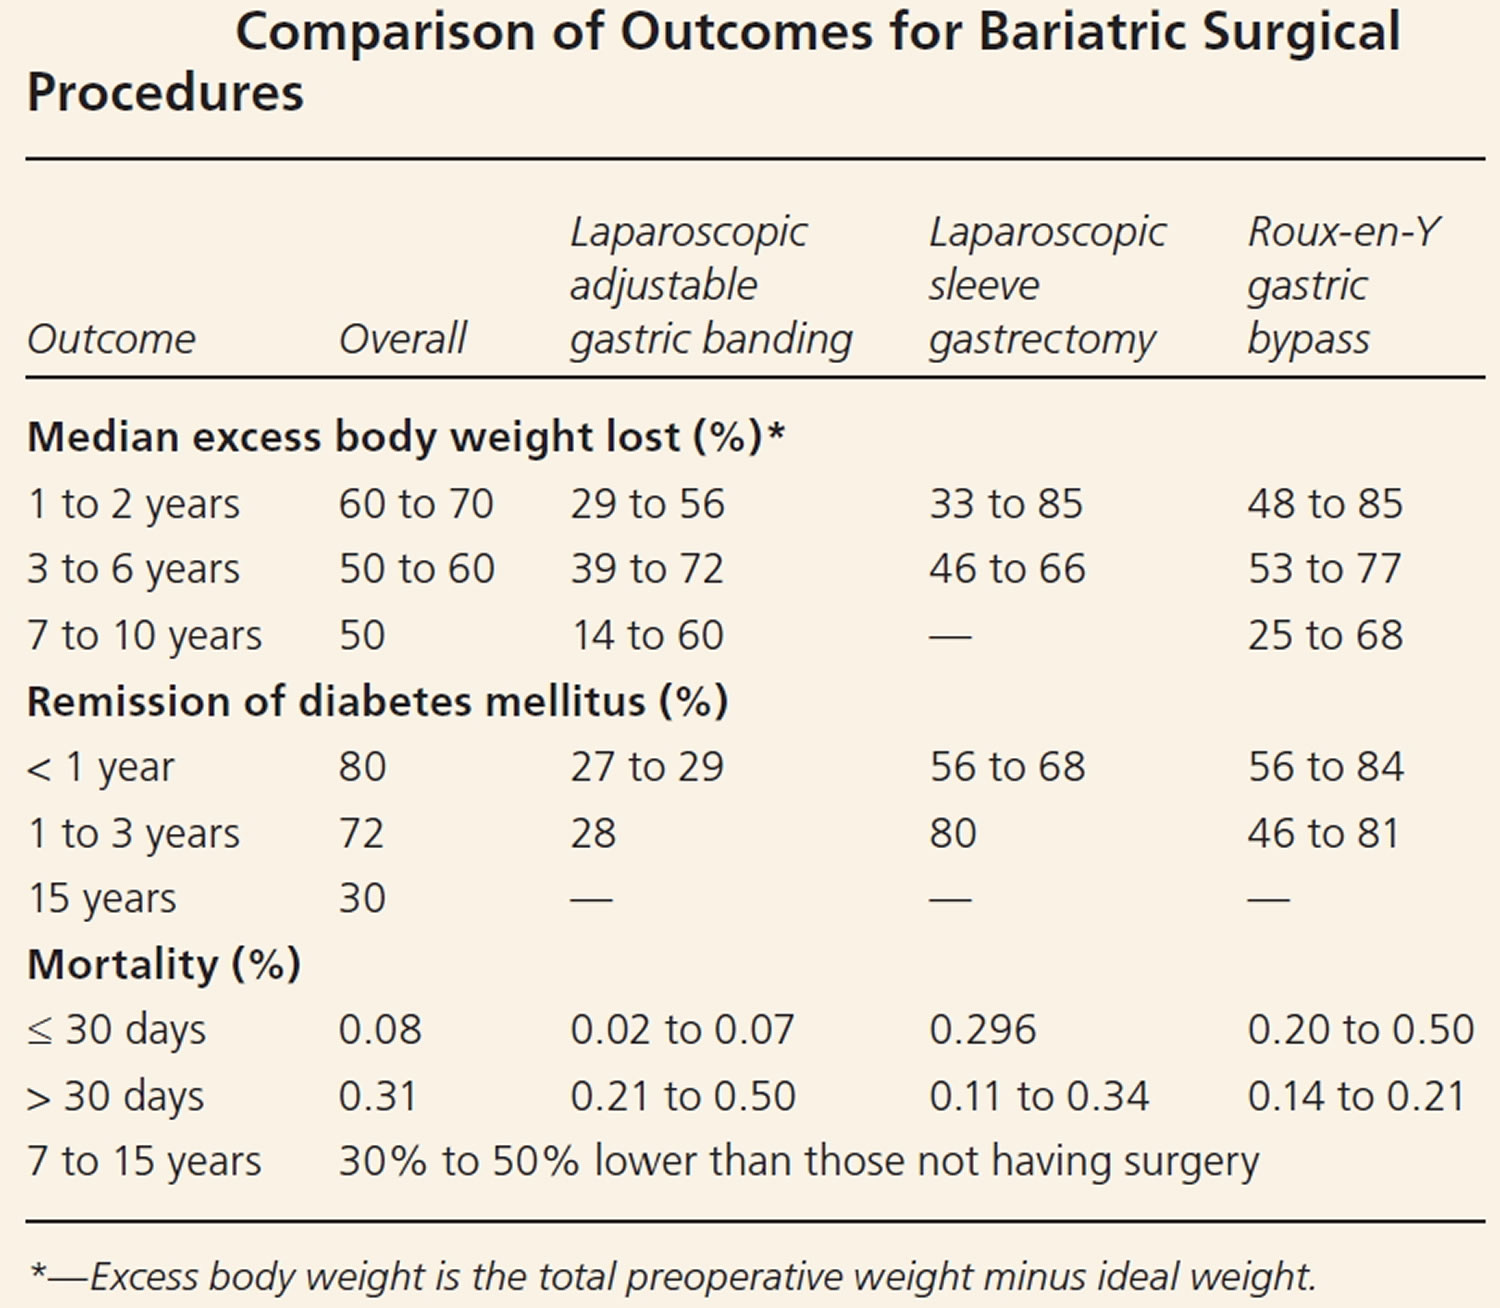
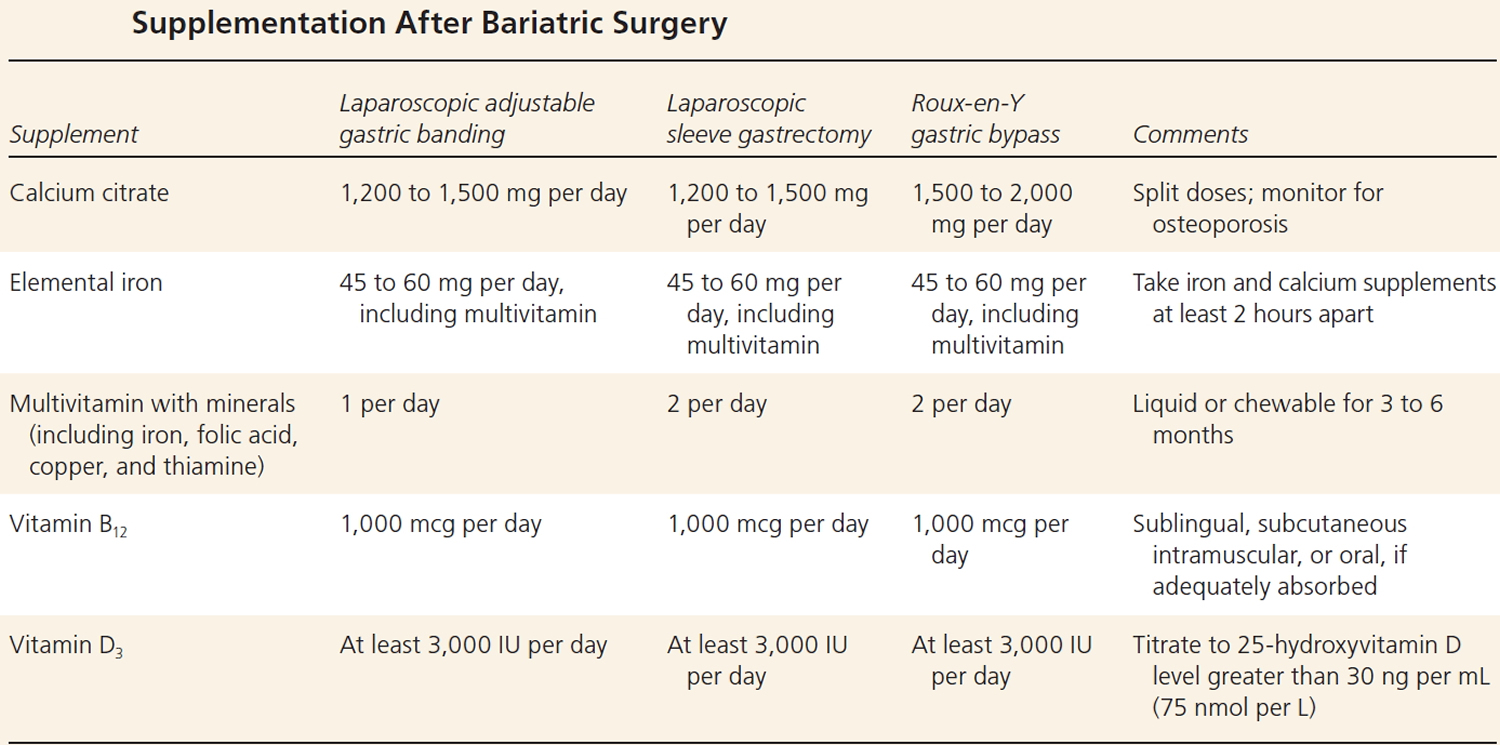
Table 2. Supplementation After Weight Loss Surgery
Stomach anatomy
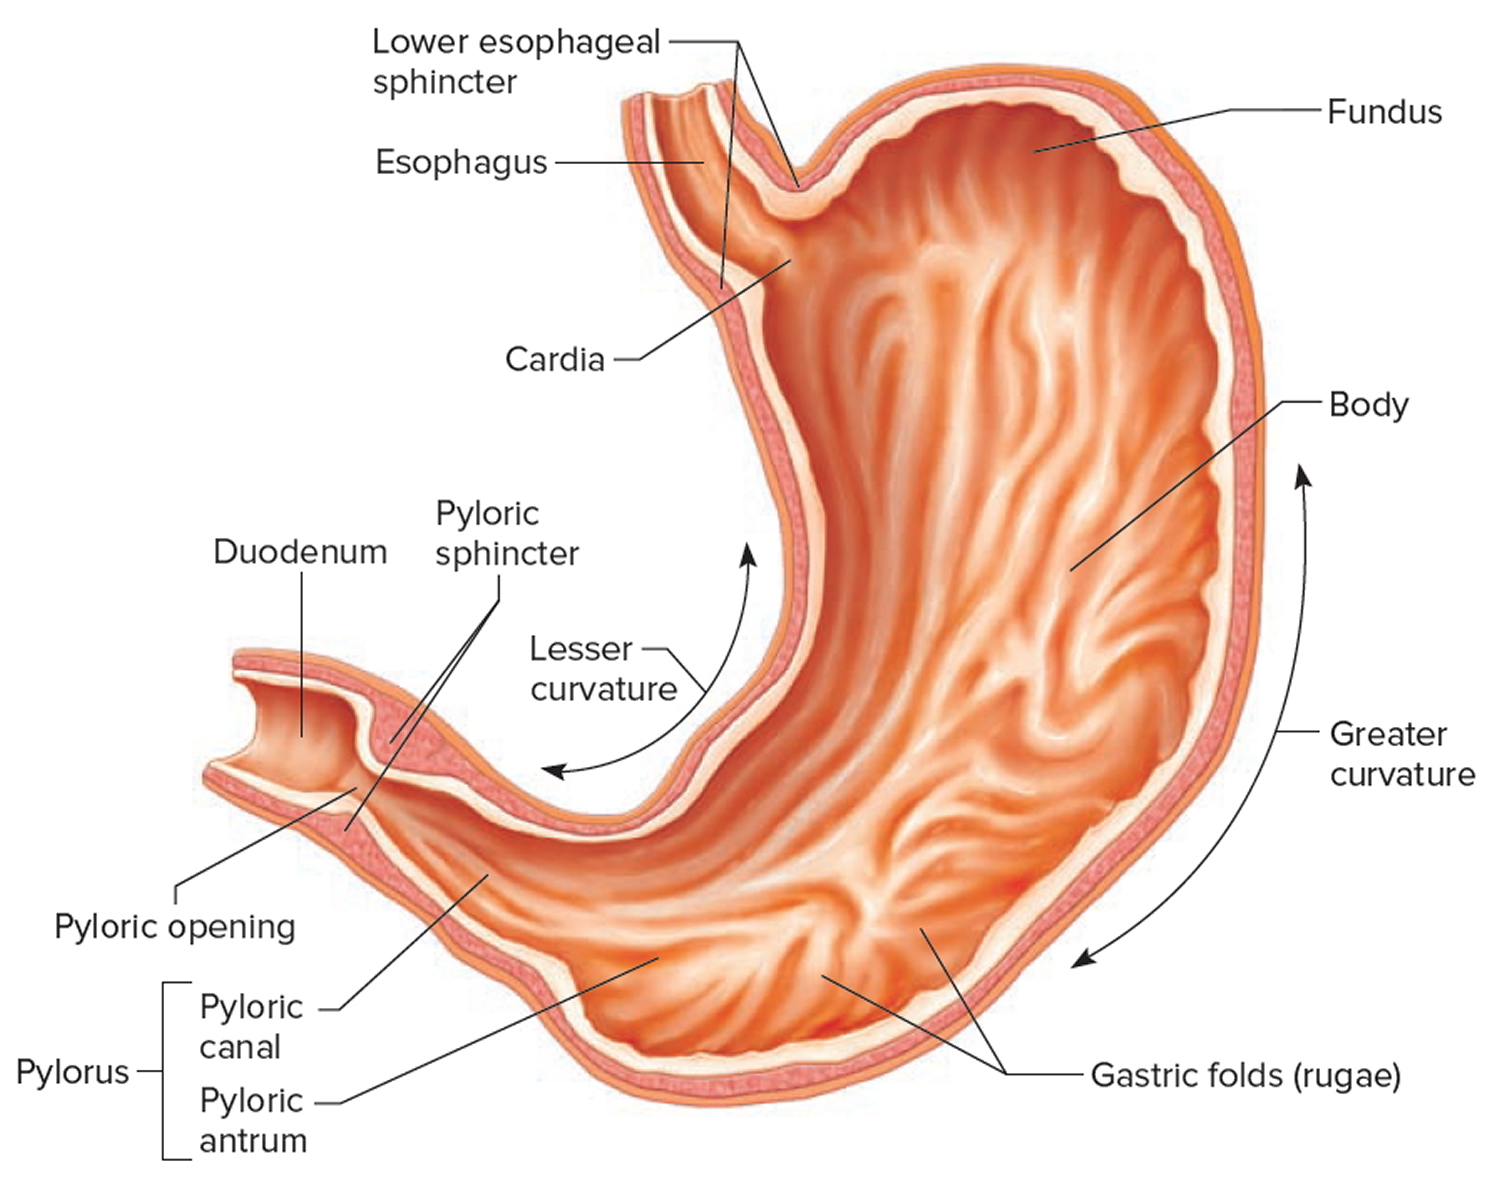
The stomach is a muscular J-shaped pouchlike hollow organ that hangs inferior to the diaphragm in the upper left portion of the abdominal cavity and has a capacity of about 1 liter or more (Figure 4) 35. The stomach’s shape and size vary from person to person, depending on things like people’s sex and build, but also on how much they eat.
At the point where the esophagus leads into the stomach, the digestive tube is usually kept shut by muscles of the esophagus and diaphragm (Figure 5). When you swallow, these muscles relax and the lower end of the esophagus opens, allowing food to enter the stomach. If this mechanism does not work properly, acidic gastric juice might get into the esophagus, leading to heartburn or an inflammation (Figure 5).
Thick folds (rugae) of mucosal and submucosal layers mark the stomach’s inner lining and disappear when the stomach wall is distended. The stomach receives food from the esophagus, mixes the food with gastric juice, initiates protein digestion, carries on limited absorption, and moves food into the small intestine (Figure 6).
Figure 4. Stomach
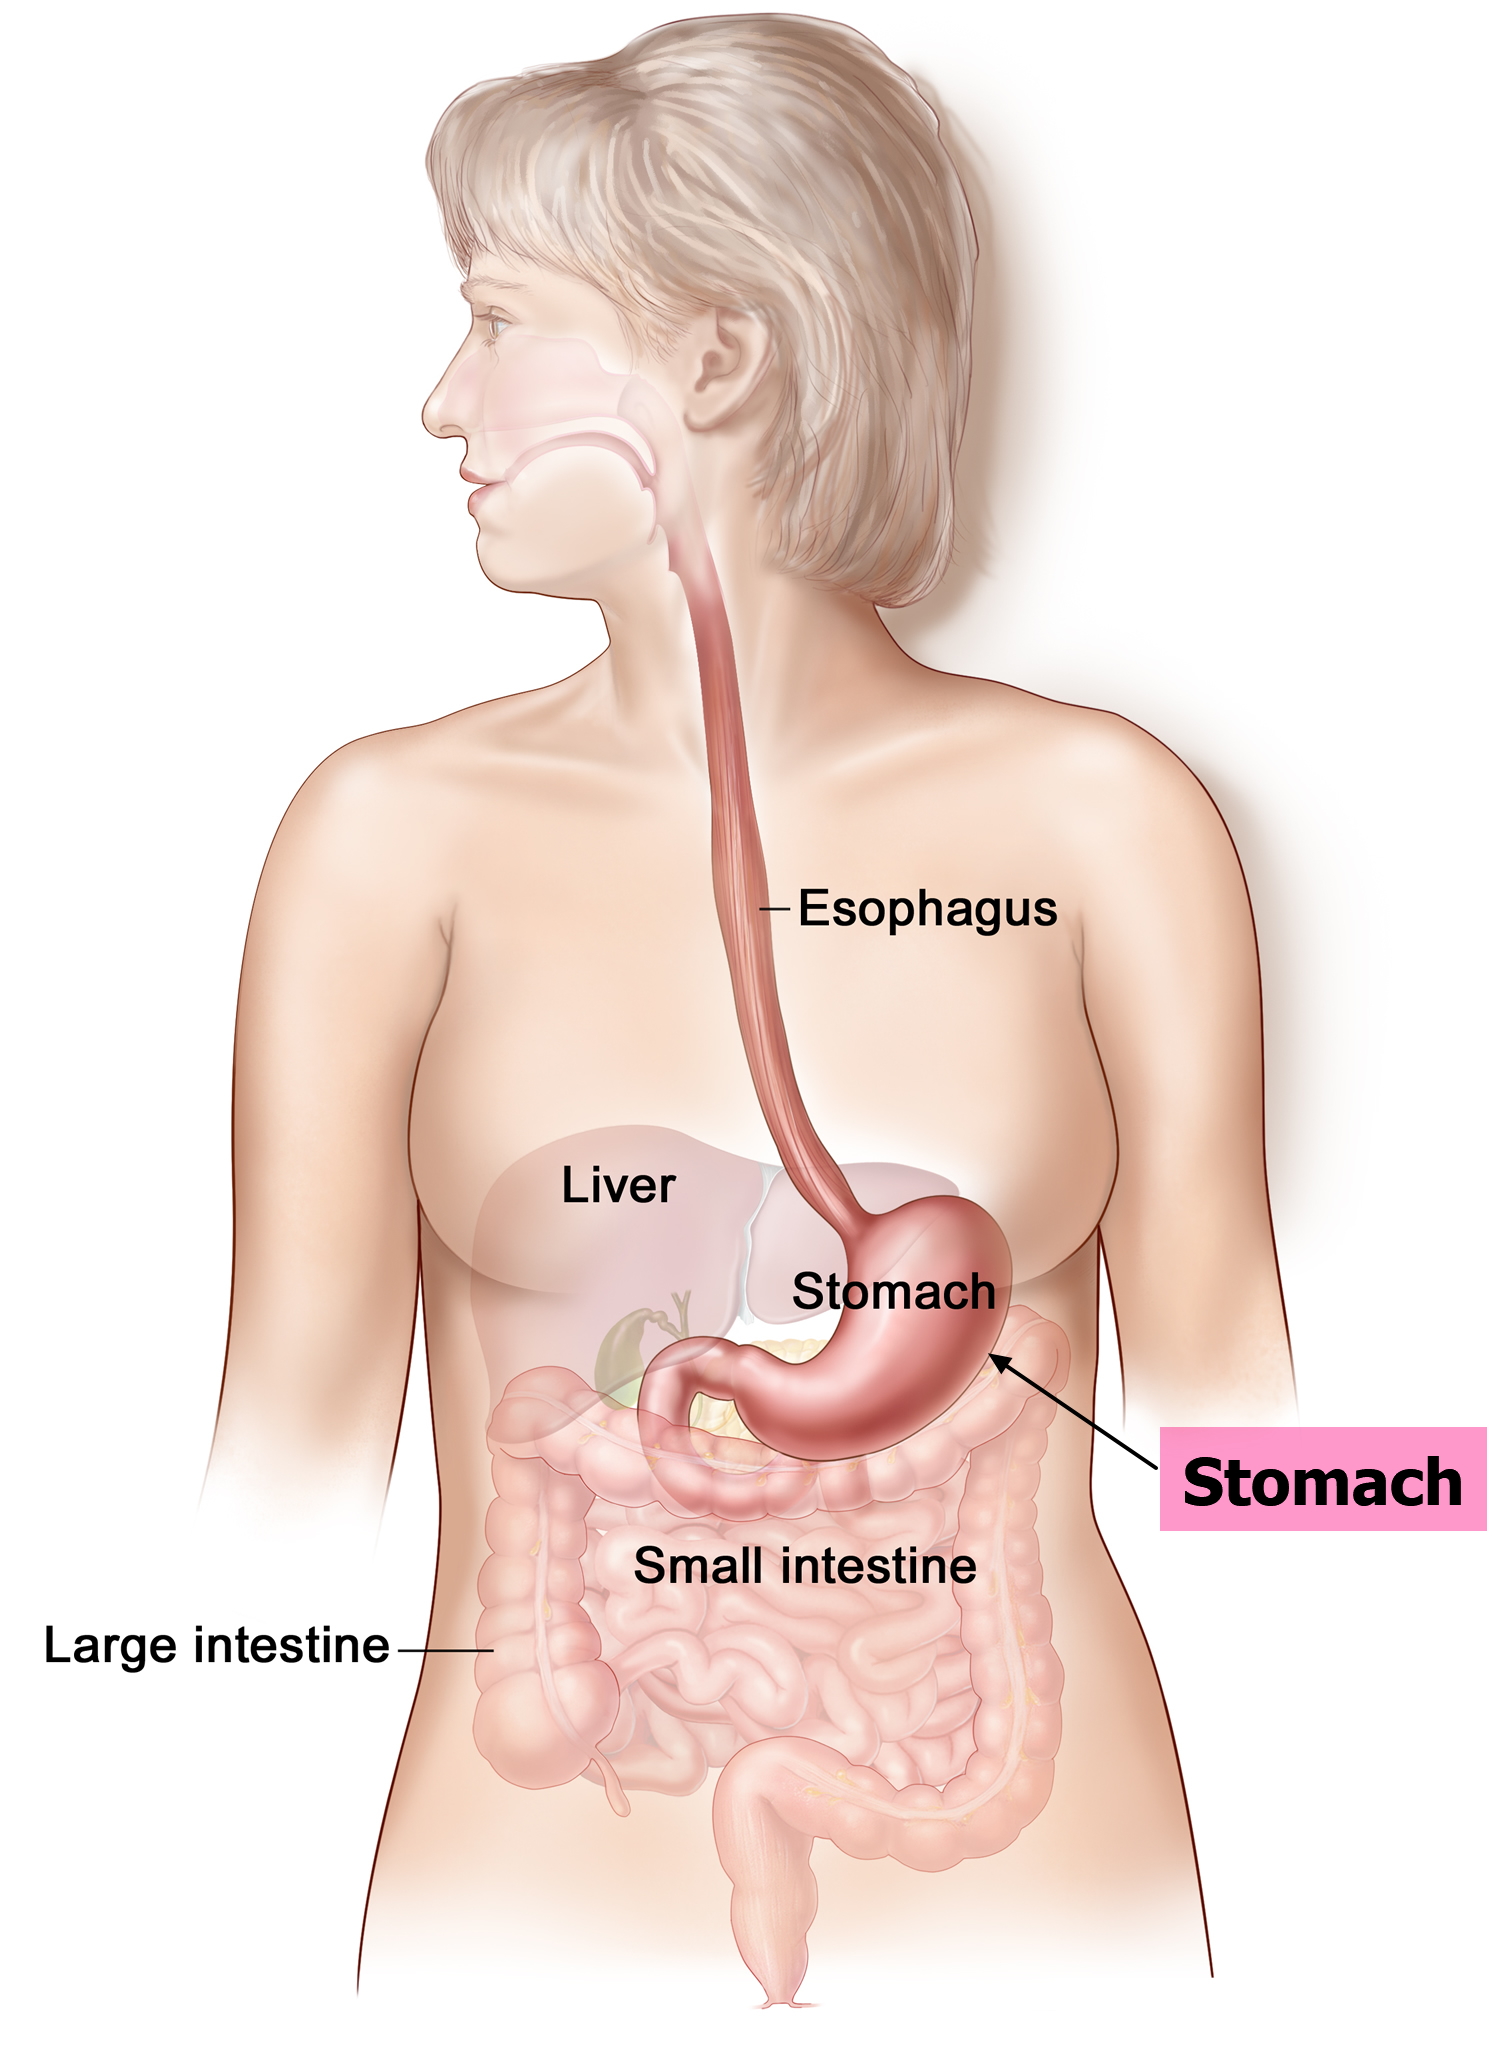
Figure 5. Gastroesophageal junction
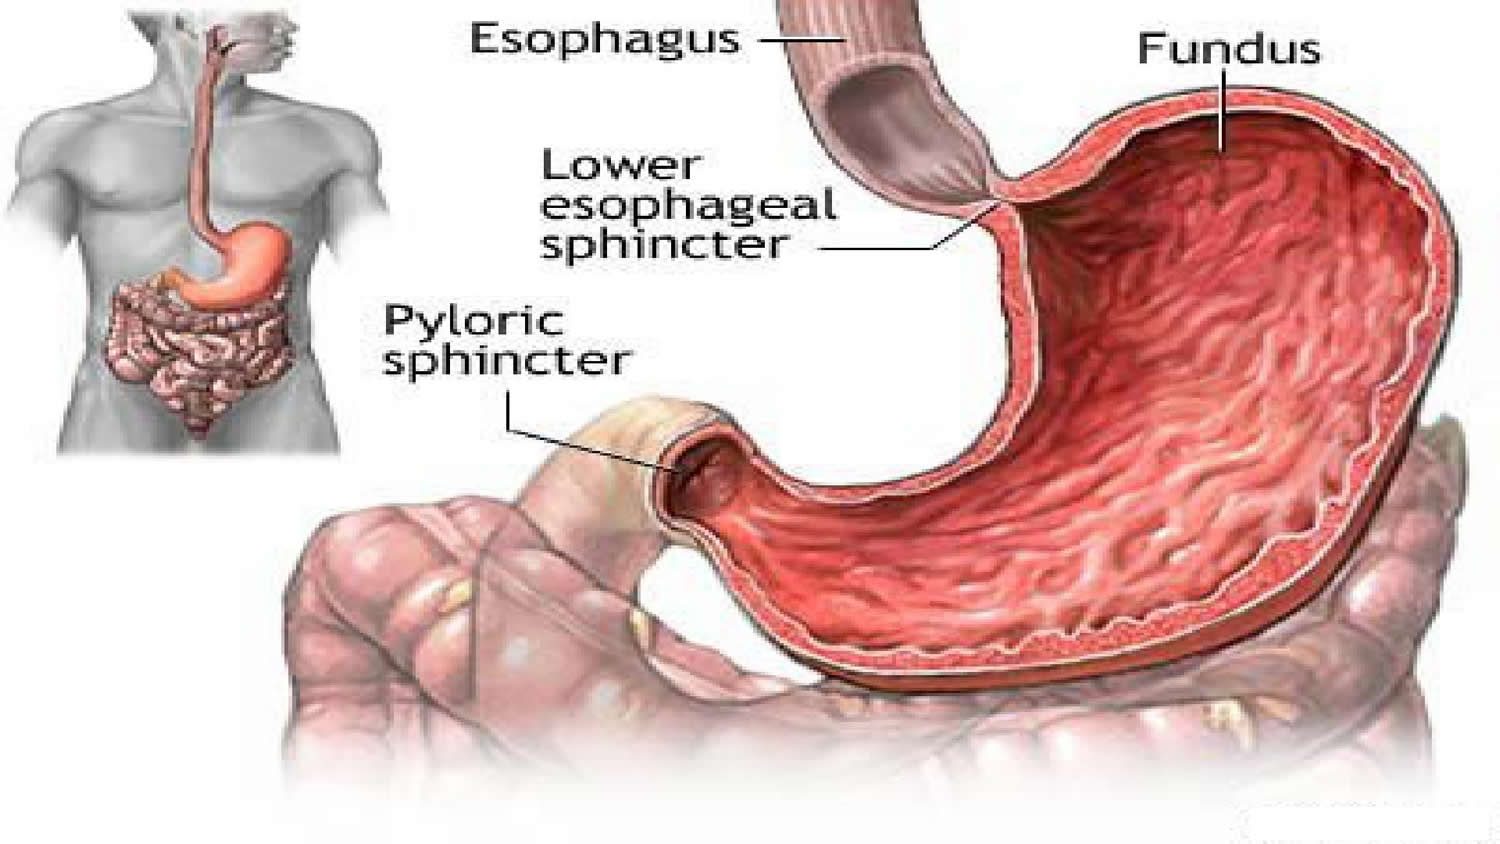
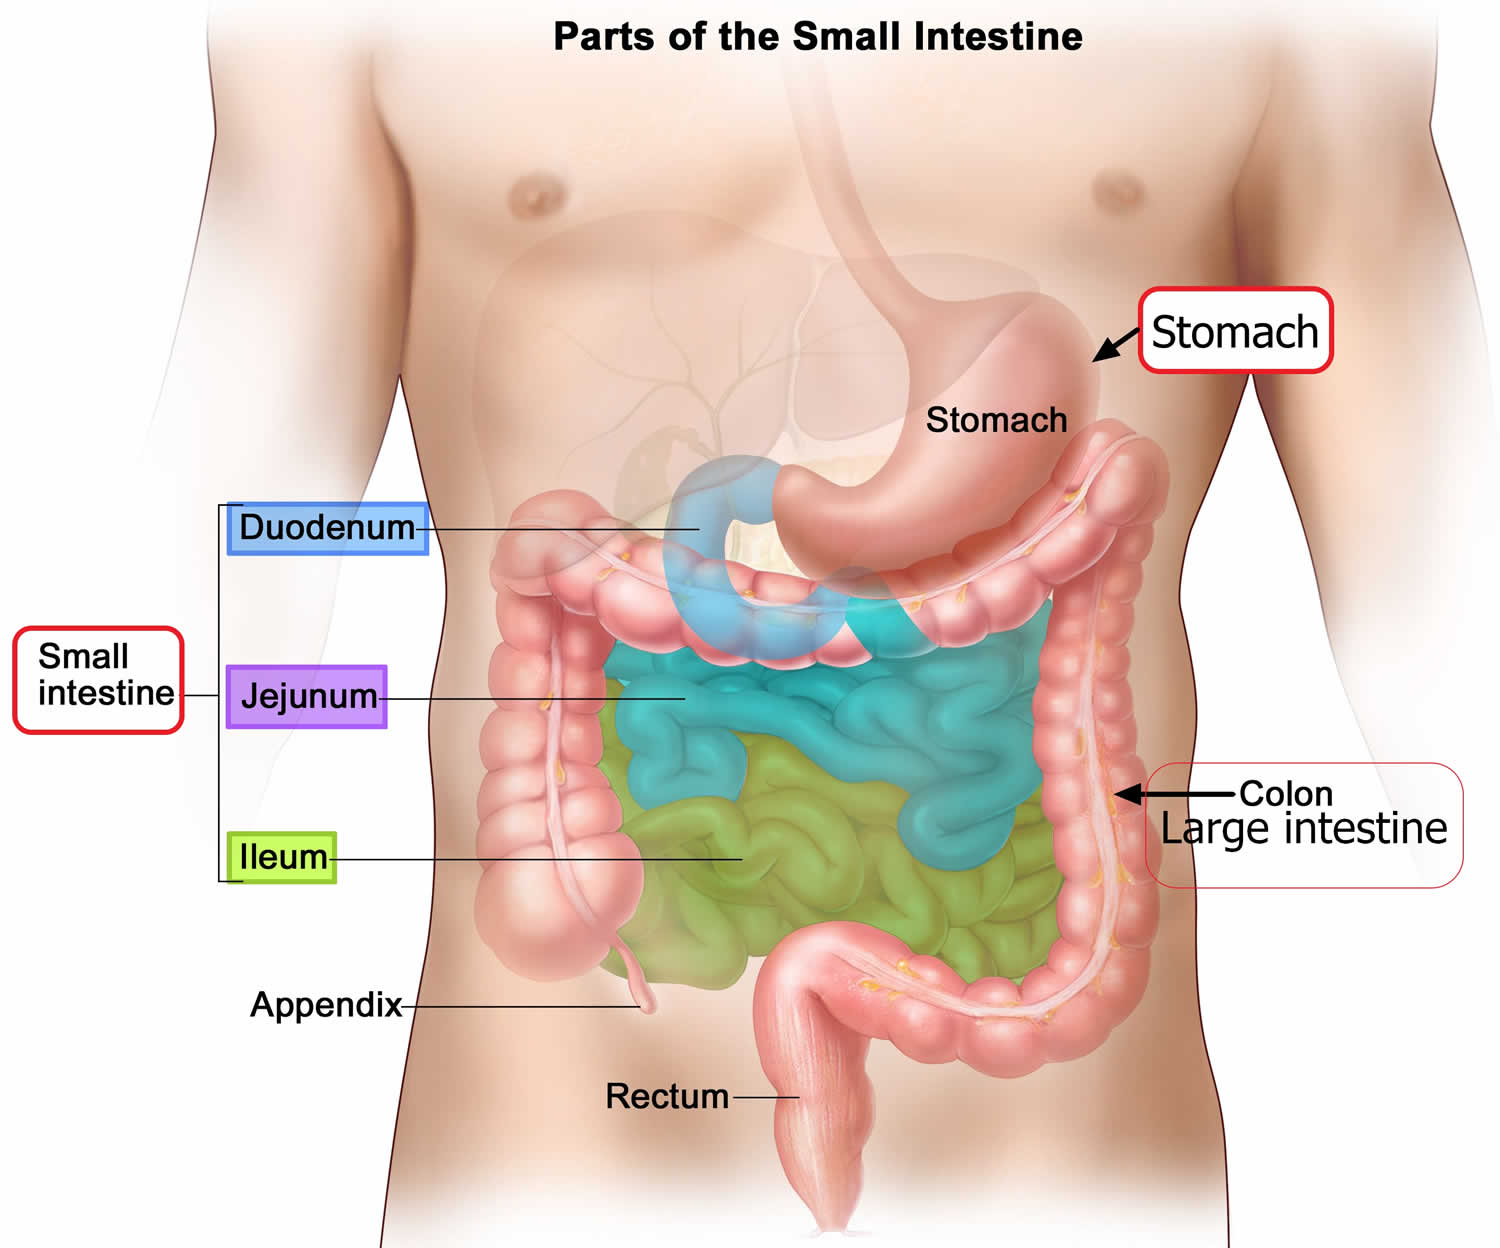
Figure 6. Parts of the small intestine
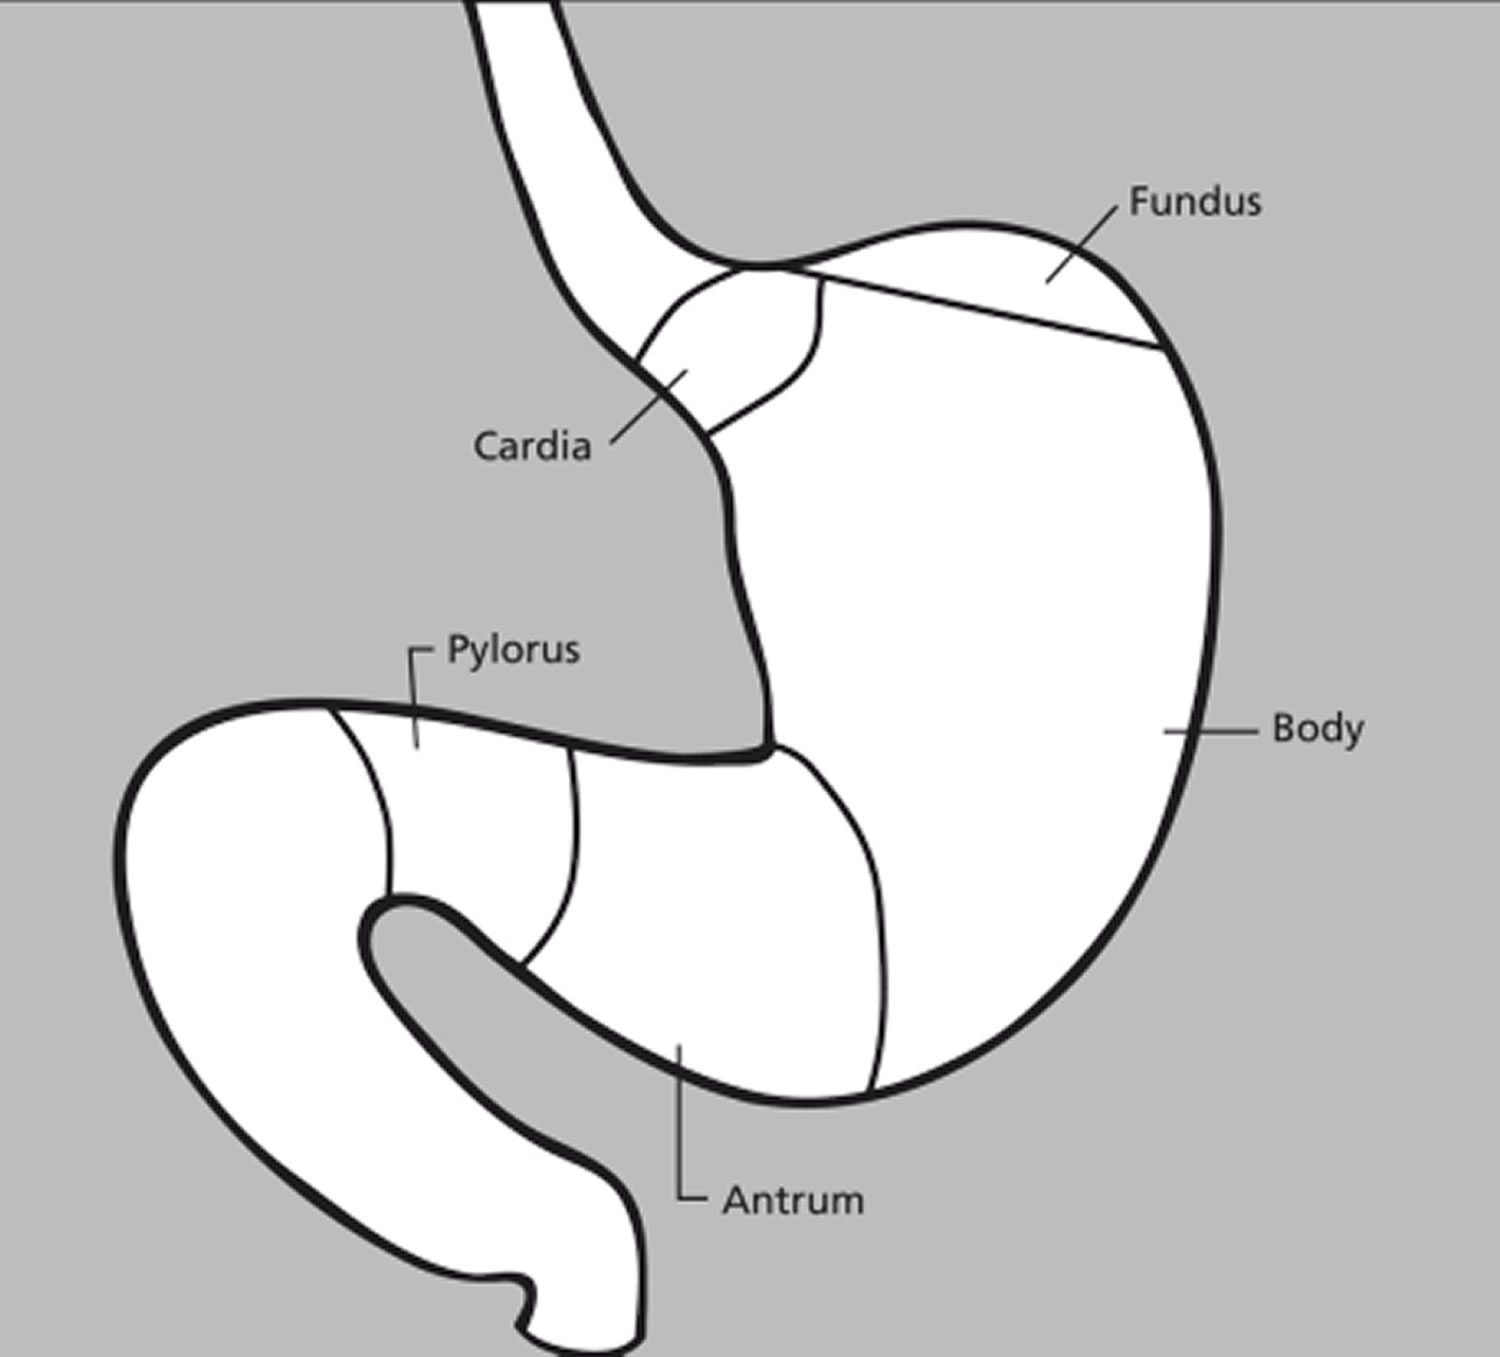
Parts of the Stomach
The stomach has 5 parts (Figure 7):
The cardia is a small area near the esophageal opening.
The fundus, which balloons superior to the cardia, is a temporary storage area. It is usually filled with air that enters the stomach when you swallow.
The dilated body region, called the body (corpus), which is the main part of the stomach, lies between the fundus and pylorus. In the body of the stomach food is churned and broken into smaller pieces, mixed with acidic gastric juice and enzymes, and pre-digested.
The antrum – the lower portion (near the intestine), where the food is mixed with gastric juice
The pylorus is the distal portion and the last part of the stomach where it approaches the small intestine. The pyloric canal is a narrowing of the pylorus as it approaches the small intestine. At the end of the pyloric canal the muscular wall thickens, forming a powerful circular muscle, the pyloric sphincter. This muscle is a valve that controls gastric emptying.
The first 3 parts of the stomach, the cardia, fundus, and body, are sometimes called the proximal stomach. Some cells in these parts of the stomach make acid and pepsin (a digestive enzyme), the parts of the gastric juice that help digest food. They also make a protein called intrinsic factor, which the body needs to absorb vitamin B12.
The lower 2 parts, the antrum and pylorus, are called the distal stomach. The stomach has 2 curves, which form its inner and outer borders. They are called the lesser curvature and greater curvature, respectively.
Figure 7. Parts of the stomach
Stomach function
The stomach takes in food from the esophagus (gullet or food pipe), mixes it, breaks it down, and then passes it on to the small intestine in small portions. Following a meal, the mixing movements of the stomach wall aid in producing a semifluid paste of food particles and gastric juice called chyme. Peristaltic waves push the chyme toward the pylorus of the stomach. As chyme accumulates near the pyloric sphincter, the sphincter begins to relax. Stomach contractions push chyme a little at a time into the small intestine.
The rate at which the stomach empties depends on the fluidity of the chyme and the type of food present. Liquids usually pass through the stomach rapidly, but solids remain until they are well mixed with gastric juice. Fatty foods may remain in the stomach from three to six hours; foods high in proteins move through more quickly; carbohydrates usually pass through faster than either fats or proteins.
As chyme enters the duodenum (the proximal portion of the small intestine), accessory organs—the pancreas, liver, and gallbladder—add their secretions.
Gastric secretions
The mucous membrane that forms the inner lining of the stomach is thick. Its surface is studded with many small openings called gastric pits located at the ends of tubular gastric glands (Figure 8).
Gastric glands generally contain three types of secretory cells. Mucous cells, in the necks of the glands near the openings of the gastric pits, secrete mucus. Chief cells and parietal cells are in the deeper parts of the glands. The chief cells secrete digestive enzymes, and the parietal cells release a solution containing hydrochloric acid. The products of the mucous cells, chief cells, and parietal cells together form gastric juice.
Pepsin is by far the most important digestive enzyme in gastric juice. The chief cells secrete pepsin in the form of an inactive enzyme precursor called pepsinogen. When pepsinogen contacts hydrochloric acid from the parietal cells, it breaks down rapidly, forming pepsin. Pepsin begins the digestion of nearly all types of dietary protein into polypeptides. This enzyme is most active in an acidic environment, which is provided by the hydrochloric acid in gastric juice.
The mucous cells of the gastric glands (mucous neck cells) and the mucous cells associated with the stomach’s inner surface release a viscous, alkaline secretion that coats the inside of the stomach wall. This coating normally prevents the stomach from digesting itself.
Another component of gastric juice is intrinsic factor, which the parietal cells secrete. Intrinsic factor is necessary for the absorption of vitamin B12 in the small intestine. Table 1 summarizes the major components of gastric juice.
Figure 8. Stomach cells (gastric glands)
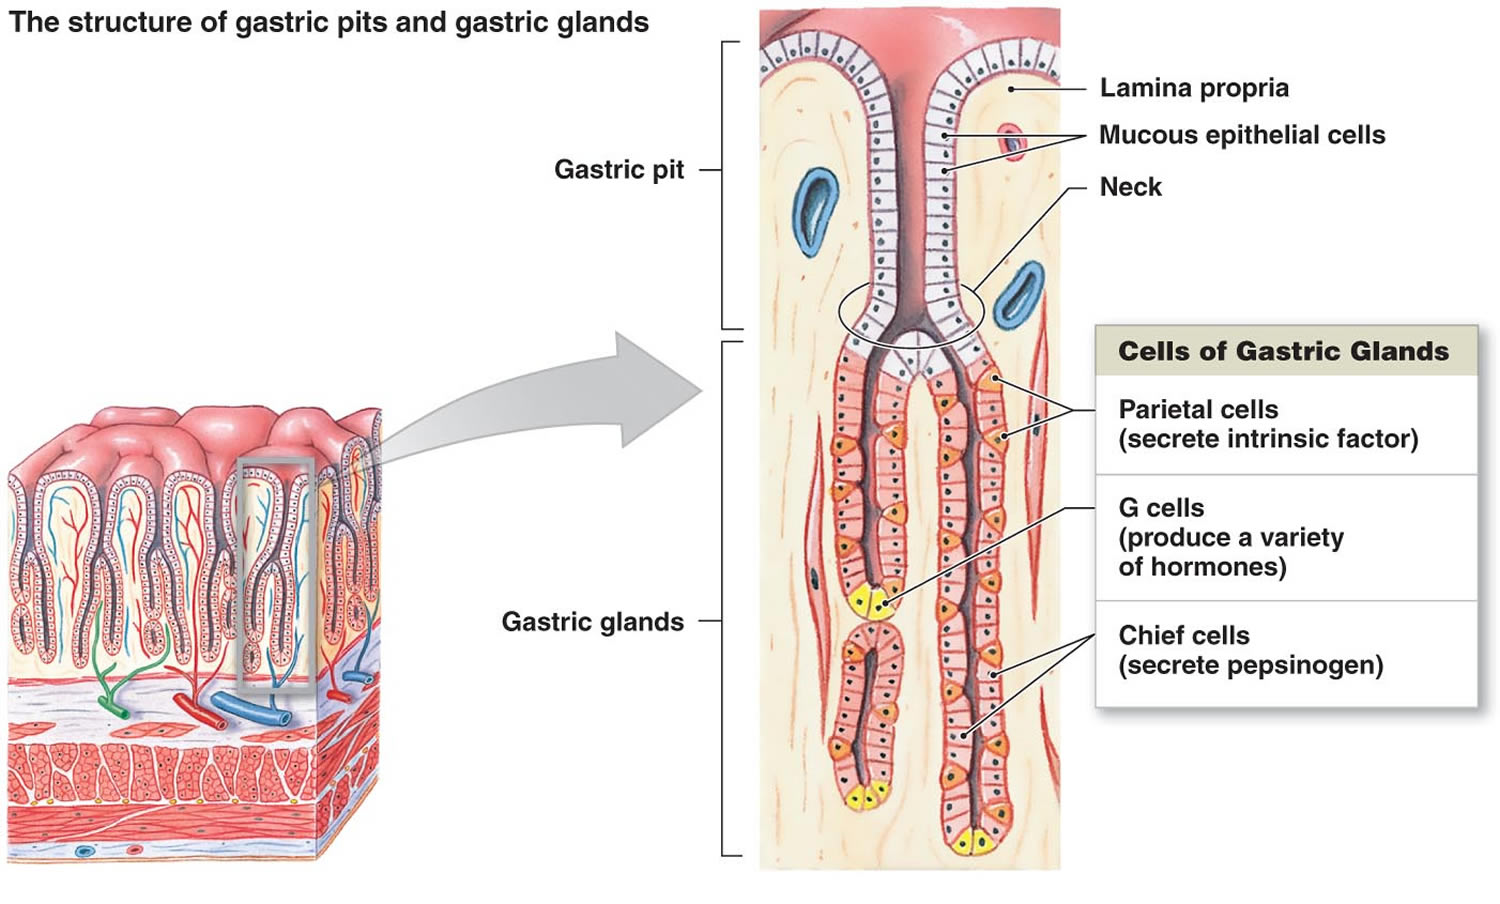
Note: Lining of the stomach. Gastric glands include mucous cells, parietal cells, and chief cells. The mucosa of the stomach is studded with gastric pits that are the openings of the gastric glands.
Table 3. Major components of Gastric Juice
| Component | Source | Function |
|---|---|---|
| Pepsinogen | Chief cells of the gastric glands | Inactive form of pepsin |
| Pepsin | Formed from pepsinogen in the presence of hydrochloric acid | A protein-splitting enzyme that digests nearly all types of dietary protein into polypeptides |
| Hydrochloric acid | Parietal cells of the gastric glands | Provides the acid environment needed for the production and action of pepsin |
| Mucus | Mucous cells | Provides a viscous, alkaline protective layer on the stomach’s inner surface |
| Intrinsic factor | Parietal cells of the gastric glands | Necessary for vitamin B12 absorption in the small intestine |
When should I consider gastric sleeve surgery?
Gastric sleeve is a form of bariatric surgery, also called weight loss surgery, and you should only consider gastric sleeve surgery after trying non-surgical alternatives.
The first step is usually to try changes to your food intake and your daily activity and exercise. There are also some medications that can help people lose weight. Surgery is usually thought about only after these other options have been tried.
Gastric sleeve surgery is used to treat severe obesity. It’s advised for people who have tried other weight loss methods without long-term success. Your doctor may advise gastric sleeve surgery if you are severely obese with a body mass index (BMI) over 40 kg/m². Your doctor may also advise it if you have a BMI between 35 and 40 kg/m² and a health condition such as obstructive sleep apnea, high blood pressure, heart disease, or type 2 diabetes.
Endoscopic gastric sleeve surgery is performed to help you lose weight and potentially lower your risk of serious weight-related health problems, including:
- Gastroesophageal reflux disease (GERD)
- Heart disease
- Stroke
- High blood pressure
- High cholesterol
- Obstructive sleep apnea
- Type 2 diabetes
- Stroke
- Cancer
- Infertility
Losing weight after gastric sleeve surgery can help reduce problems with type 2 diabetes, asthma episodes and blood pressure, and can help improve heart health.
Gastric sleeve complications
Bleeding, infection, and blood clots in your legs are possible side effects that may occur after any surgery. General anesthesia may also cause breathing problems or other reactions.
Gastric sleeve surgery has some risks, including 36, 37, 38, 39, 40, 41, 27, 42:
- too much bleeding
- leaking of stomach contents into the belly from where parts of the stomach have been stapled together
- injury to your stomach, intestines, or other organs during surgery
- a bad reaction to anesthesia
- allergic reactions to medicines
- blood clots
- infection
- lung or breathing problems
- gastritis (inflamed stomach lining), heartburn, or stomach ulcers
- risk of vitamin and iron deficiency (shortage)
- scarring inside your belly that could lead to a blockage in your bowel in the future
- vomiting from eating more than your stomach pouch can hold
- risk of acid reflux and hiatal hernia (caused by the stomach pushing up against the diaphragm). Development of gastroesophageal reflux disease (GERD) is one of the most frequent complications of sleeve gastrectomy with up to 26% of patients experiencing new symptoms after surgery 43 and up to 30% requiring reoperation due to GERD or weight increase caused by dilatation of the gastric tube 44, 45.
Over time, you may also have some trouble absorbing certain nutrients. Or you may develop a narrowing (stricture) in your stomach sleeve. Some people may have heartburn or reflux after the surgery. If you already have moderate to severe reflux, a gastric sleeve could make that worse. You may want to consider a gastric bypass surgery instead. That type of surgery can stop reflux and heartburn.
You may have other risks based on your health. Make sure to talk with your healthcare team about any concerns before the surgery.
Gastric sleeve surgery risks
As with any major surgery, vertical sleeve gastrectomy poses potential health risks, both in the short term and long term. In early studies on endoscopic gastric sleeve surgery, the procedure has shown a favorable safety profile. Pain and nausea may occur for several days after the surgery. These symptoms are usually managed with pain and nausea medications. Most people feel better after two days.
In addition, although it’s not designed to be a temporary procedure, endoscopic gastric sleeve surgery can be reversed. In some cases, it can also be converted to bariatric surgery.
Because the gastric sleeve surgery is still new and not in wide use, questions remain about its long-term effectiveness and risks 46.
Risks associated with sleeve gastrectomy can include 36, 37, 38, 39, 40, 41, 27, 42:
- Excessive bleeding
- Infection
- Adverse reactions to anesthesia
- Blood clots
- Lung or breathing problems
- Leaks from the cut edge of the stomach
Longer term risks and complications of sleeve gastrectomy surgery can include:
- Gastrointestinal obstruction
- Hernias
- Gastroesophageal reflux
- Low blood sugar (hypoglycemia)
- Malnutrition
- Vomiting
Very rarely, complications of sleeve gastrectomy can be fatal resulting in dealth.
Who is gastric sleeve surgery for?
Endoscopic gastric sleeve surgery is often an option for people who aren’t candidates for other bariatric surgeries. The procedure is available to people whose body mass index (BMI) is above 30 who haven’t been successful maintaining weight loss with other methods.
But endoscopic gastric sleeve surgery isn’t for everyone who is overweight. A screening process helps doctors see if the procedure might be beneficial for you. And you must be willing to commit to healthy lifestyle changes, regular medical follow-up and participate in behavioral therapy.
Endoscopic gastric sleeve surgery isn’t appropriate for anyone who has gastrointestinal bleeding, a hiatal hernia larger than 3 centimeters or who’s had prior stomach surgery.
Weight-loss surgery isn’t advised for people who abuse medicines or alcohol, or who are not able to commit to a lifelong change in diet and exercise habits.
Given that endoscopic gastric sleeve surgery is a new procedure, it might not be covered by your health insurance.
How do I prepare for my gastric sleeve surgery?
In the weeks leading up to your vertical sleeve gastrectomy, you may be required to start a physical activity program and to stop any tobacco use. If you smoke, you should stop several weeks before surgery and not start smoking again after surgery. Smoking slows recovery and increases the risk for problems. Ask your doctor for help quitting.
Your surgeon will ask you to have tests and visits with your other health care providers before you have this surgery. Some of these are:
- A complete physical exam.
- Blood tests, ultrasound of your gallbladder, and other tests to make sure you are healthy enough to have surgery.
- Visits with your doctor to make sure other medical problems you may have, such as diabetes, high blood pressure, and heart or lung problems, are under control.
- Nutritional counseling.
- Classes to help you learn what happens during the surgery, what you should expect afterward, and what risks or problems may occur afterward.
- You may want to visit with a counselor to make sure you are emotionally ready for this surgery. You must be able to make major changes in your lifestyle after surgery.
Now is a good time to plan ahead for your recovery after surgery. For instance, arrange for help at home if you think you’ll need it.
Tell your surgeon:
- If you are or might be pregnant
- What medicines, vitamins, herbs, and other supplements you are taking, even ones you bought without a prescription
During the week before your surgery:
- You may be asked to stop taking blood thinning medicines. These include aspirin, ibuprofen (Advil, Motrin), vitamin E, warfarin (Coumadin, Jantoven), and others.
- Ask your doctor which drugs you should still take on the day of your surgery.
On the day of your surgery:
- Right before your procedure, you may have restrictions on eating and drinking and which medications you can take. Follow instructions about when to stop eating and drinking.
- Take the drugs your doctor told you to take with a small sip of water.
- Arrive at the hospital on time.
Gastric sleeve procedure
Endoscopic gastric sleeve surgery is done in the endoscopy unit as an outpatient procedure. General anesthesia is used for the procedure, so you’ll be unconscious throughout the surgery.
The gastric sleeve surgery is done using an endoscope, a flexible tube with a camera and an endoscopic suturing device attached. The endoscope is inserted down your throat into the stomach. The tiny camera allows the doctor operating the endoscope (endoscopist) to see and operate inside your stomach without making incisions in your abdomen.
Using the endoscope, the doctor places approximately 12 sutures in the stomach. The sutures change the structure of your stomach, leaving it shaped like a tube. This restricts the amount of calories your body absorbs.
The procedure takes about 90 minutes. After the endoscopic sleeve gastroplasty, you’ll be awaken in a recovery room, where medical staff monitors you for any complications.
You can probably go home 2 days after your surgery. The majority of people leave go home the same day after recovering from sedation.
You should be able to drink clear liquids on the day after surgery, and then go on a pureed diet by the time you go home.
When you go home, you will probably be given pain pills or liquids and a drug called a proton pump inhibitor.
When you eat after having this surgery, the small pouch will fill quickly. You will feel full after eating a very small amount of food.
The surgeon, nurse, or dietitian will recommend a diet for you. Meals should be small to avoid stretching the remaining stomach.
Laparoscopic gastric sleeve surgery
In other surgical centers, your surgeon will use laparoscopy instead of the endoscope. In the laparoscopic gastric sleeve surgery (keyhole surgery), your surgeon will make several small cuts (incisions) in your upper abdomen. The surgeon will then insert a laparoscope and put small surgery tools into these incisions.
In laparoscopic gastric sleeve surgery:
- Your surgeon makes 2 to 5 small cuts (incisions) in your belly.
- The laparoscope and instruments needed to perform the surgery are inserted through these cuts.
- The camera is connected to a video monitor in the operating room. This allows the surgeon to view inside your belly while doing the operation.
- A harmless gas is pumped into the belly to expand it. This gives the surgeon room to work.
- Your surgeon will then use a laparoscopic stapler to divide the stomach, leaving a narrowed vertical sleeve. The part of the stomach that was removed is then taken out of the abdomen through an incision. Your surgeon may then test for any leaks in the sleeve using a dye study or an upper endoscopy.
- The remaining portions of your stomach are joined together using surgical staples. This creates a long vertical tube or banana-shaped stomach.
- The surgery does not involve cutting or changing the sphincter muscles that allow food to enter or leave the stomach.
- The laparoscope and other tools are removed. The cuts are stitched closed.
The laparoscopic gastric sleeve surgery takes 60 to 90 minutes.
Weight-loss surgery may increase your risk for gallstones. Your surgeon may recommend having a surgery to remove your gallbladder (cholecystectomy). The surgery to remove your gallbladder (cholecystectomy) may be done before your weight-loss surgery or at the same time.
During gastric sleeve procedure
The specifics of your surgery depend on your individual situation and the hospital’s or doctor’s practices. Some gastric sleeve surgery are done with traditional large (open) incisions in the abdomen. But sleeve gastrectomy is typically performed laparoscopically, which involves inserting small instruments through multiple small incisions in the upper abdomen.
You are given general anesthesia before your surgery begins. Anesthesia is medicine that keeps you asleep and comfortable during surgery.
To perform a sleeve gastrectomy, the surgeon creates a narrow sleeve by stapling the stomach vertically and removing the larger, curved part of the stomach.
Surgery usually takes one to two hours. After surgery, you awaken in a recovery room, where medical staff monitors you for any complications.
After gastric sleeve procedure
After gastric sleeve surgery, your diet begins with sugar-free, noncarbonated liquids for the first seven days, then progresses to pureed foods for three weeks, and finally to regular foods approximately four weeks after your surgery. You will be required to take a multivitamin twice a day, a calcium supplement once a day, and a vitamin B-12 injection once a month for life.
You’ll have frequent medical checkups to monitor your health in the first several months after weight-loss surgery. You may need laboratory testing, bloodwork and various exams.
You may experience changes as your body reacts to the rapid weight loss in the first three to six months after sleeve gastrectomy, including:
- Body aches
- Feeling tired, as if you have the flu
- Feeling cold
- Dry skin
- Hair thinning and hair loss
- Mood changes
Gastric sleeve surgery recovery time
After the gastric sleeve surgery, you generally won’t be allowed to eat for about eight hours. People usually recover from gastric sleeve surgery in a week. But it will take several weeks before you can eat regular food again. Gastric sleeve surgery makes your stomach smaller — permanently. To ease into having a much smaller stomach, you’ll need to follow a special diet that starts with liquids only, which you need to continue for at least two weeks. Over four weeks, you’ll move on to semi-solid foods, and then to a regular healthy diet. You’ll also have medical checkups and meet with a nutritionist and psychologist frequently after your gastric sleeve surgery.
Gastric sleeve diet
Your surgery team will give you a schedule of types of meals over the next weeks. After the surgery, you’ll start with liquid foods. Over the next few weeks you will change to pureed food, then to solid food. Your meals will be much smaller and you may have to stop drinking with meals due to your small stomach. Each meal needs to be very small.
You should make sure to eat slowly and chew each bite well. Don’t move too quickly to regular food. This can cause pain and vomiting. Work with your healthcare team to figure out what’s best for you to eat. After your stomach heals, you will need to change your eating habits. You’ll need to eat small meals for your small stomach.
Your dietitian will give you an eating plan that gradually works up to solid foods; for example:
- For the first 2 to 3 weeks after surgery, you’ll get all your nutrition from high-protein drinks.
- For the next 2 weeks or so, you’ll eat puréed foods.
- Finally, you’ll move on to soft foods for another couple of weeks before you can eat regular food.
How quickly someone moves from one stage to the next depends on the person. Your medical team will advise you based on what’s best for you.
If you rush a stage or eat something before your body’s ready for it — or if you eat too much — you’ll feel very uncomfortable. You may throw up. Eventually you’ll be able to eat more of the foods you’re used to. But for the rest of your life, you’ll always have to eat much smaller portions. You’ll also feel full faster.
Because you can’t eat as much, the foods you choose to eat really matter. Your dietitian will help you put together a lifelong healthy diet that includes fruits and vegetables and emphasizes protein. Your dietitian also will recommend vitamin and mineral supplements so you don’t miss out on key nutrients.
Your new diet will limit the amount of processed foods and snacks like chips and candy that you can eat. This is because these foods don’t have a lot of nutritional value (dietitians sometimes call them “empty calories”).
In addition to eating a sensible diet, exercising is a key part of staying healthy and maintaining weight loss after surgery.
People who follow the recommended diet and exercise plan often lose a large amount of weight in the months after gastric sleeve surgery. After that, weight begins to stabilize. Your team of specialists will keep seeing you for several months after surgery to monitor your diet and health, and to help you stay on track.
You will need to make significant lifestyle changes after bariatric surgery to lose weight and keep it off. For example, you’ll get nutritional advice from a dietitian on how to change your eating habits to keep healthy while losing weight.
People who have weight-loss surgery may have trouble getting enough vitamins and minerals. This is because they take in less food, and may absorb fewer nutrients. You may need to take a daily multivitamin, plus a calcium-vitamin D supplement. You may need additional nutrients, such as vitamin B-12 or iron. Your medical team will give you instructions.
You’ll need to have regular blood tests every few months in the year after surgery. This is to make sure you don’t have low blood iron (anemia), high blood glucose, or low calcium or vitamin D levels. If you have heartburn, you may need to medicine to reduce stomach acid.
After losing weight, it’s possible to regain some of the weight that you lose. To avoid this, make sure to follow a healthy diet and get regular exercise. The sleeve may widen (dilate) over time. This will let you eat more. But keep in mind that if you eat all you can, you can regain weight. You may want to join a weight-loss surgery support group to help you stick with your new eating habits.
You will also have to, and be able to, increase the amount of physical activity you do.
Gastric bypass surgery
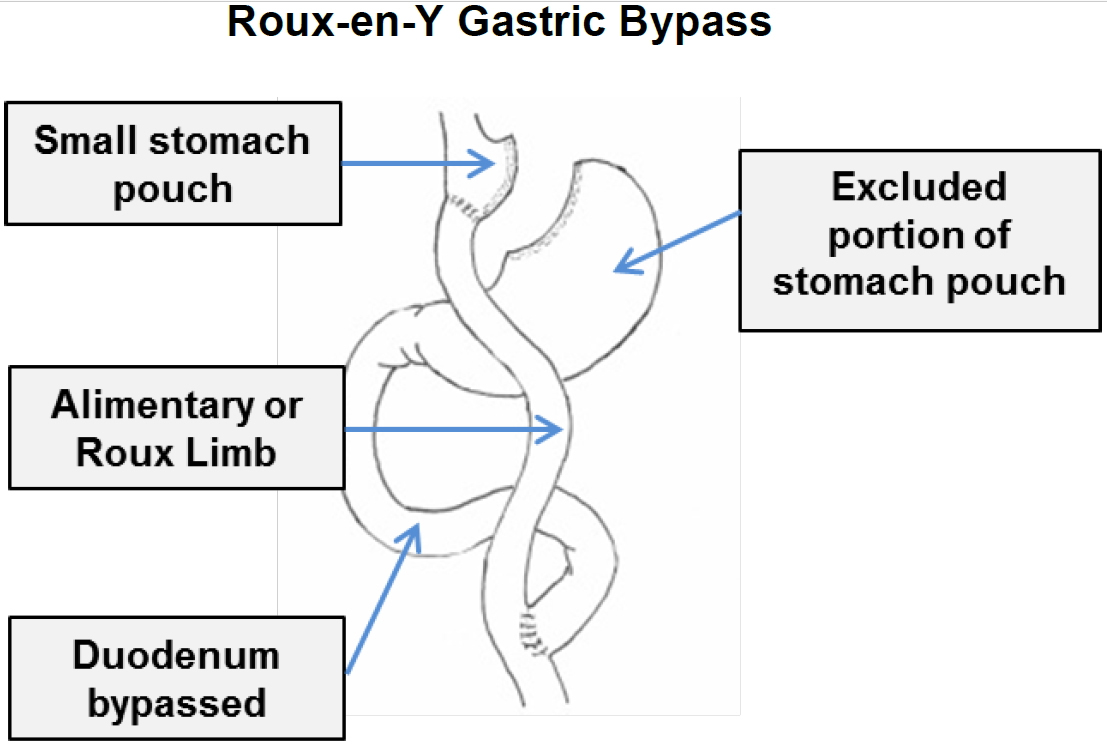
A gastric bypass surgery or Roux-en-Y gastric bypass is a type of weight-loss surgery (bariatric surgery) where surgical staples are used to create a small pouch at the top of the stomach. This pouch will hold about 1 cup of food. The pouch is then connected to your small intestine, bypassing (missing out) the rest of the stomach. This means it takes less food to make you feel full and you’ll absorb fewer calories from the food you eat. Gastric bypass surgery is one of the most common types of bariatric surgery in the United States. Gastric bypass surgery is done when diet and exercise haven’t worked or when you have serious health problems because of your weight.
In Roux-en-Y gastric bypass surgery, the rest of your stomach will still be there, but food won’t go to it. The pouch is the only part of the stomach that receives food. This greatly limits the amount that you can comfortably eat and drink at one time.
Next, the small intestine is then cut a short distance below the main stomach and connected to the new pouch. Your surgeon will attach one end of it to the small stomach pouch and the other end lower down on the small intestine, making a “Y” shape. That’s the bypass part of the procedure. The rest of your stomach is still there. It delivers chemicals from the pancreas to help digest food that comes from the small pouch. Doctors use the laparoscopic method for most gastric bypasses.
Food flows directly from the pouch into this part of the intestine. The main part of the stomach, however, continues to make digestive juices. The portion of the intestine still attached to the main stomach is reattached farther down. This allows the digestive juices to flow to the small intestine. Because food now bypasses a portion of the small intestine, fewer nutrients and calories are absorbed.
Gastric bypass surgery can provide long-term weight loss. The amount of weight you lose depends on your type of surgery and your change in lifestyle habits. It may be possible to lose 60 percent, or even more, of your excess weight within two years.
In addition to weight loss, gastric bypass surgery may improve or resolve conditions often related to being overweight, including:
- Gastroesophageal reflux disease
- Heart disease
- High blood pressure
- High cholesterol
- Obstructive sleep apnea
- Type 2 diabetes
- Stroke
- Infertility
Gastric bypass surgery can also improve your ability to perform routine daily activities, which could help improve your quality of life.
Figure 9. Gastric bypass before and after
Footnote: Before gastric bypass, food (see arrows) enters your stomach and passes into the small intestine. After surgery, the amount of food you can eat is reduced due to the smaller stomach pouch. Food is also redirected so that it bypasses most of your stomach and the first section of your small intestine (duodenum). Food flows directly into the middle section of your small intestine (jejunum), altering the secretion of gastrointestinal hormones and thereby affecting your appetite and metabolism.
Figure 10. Gastric bypass surgery or Roux-en-Y gastric bypass
Why is gastric bypass surgery done?
Gastric bypass surgery is done to help you lose excess weight and reduce your risk of potentially life-threatening weight-related health problems, including:
- Gastroesophageal reflux disease (GERD)
- Heart disease
- High blood pressure
- High cholesterol
- Obstructive sleep apnea
- Type 2 diabetes
- Stroke
- Infertility
Gastric bypass surgery is typically done only after you’ve tried to lose weight by improving your diet and exercise habits.
Gastric bypass alternative
The alternatives to gastric bypass surgery are lifestyle changes such as diet and exercise, or lifestyle changes combined with weight-loss medications or lap band surgery (adjustable gastric banding) or gastric sleeve surgery. You can get professional help with this: ask your doctor. A prospective, cross-sectional study 47 assessed weight loss, food tolerance and diet quality in 130 subjects (14 obese pre-surgical controls, 13 adjustable gastric banding, 62 gastric sleeve and 41 Roux-en-Y gastric bypass) found the obese pre-surgical controls and adjustable gastric banding groups consumed significantly more high-calorie extra foods, resulting in poor weight loss and food tolerance outcomes for the adjustable gastric banding group. The control and adjustable gastric banding groups consumed significantly more high-calorie extra foods (9.2 and 7.7 daily serves respectively) compared with the gastric sleeve (3.4 serves) and Roux-en-Y gastric bypass (4.0 serves) groups. There were several significant correlations between food tolerance and dietary intake including breads and cereals and meat and meat alternatives.
Laparoscopic adjustable gastric banding or Lap Band
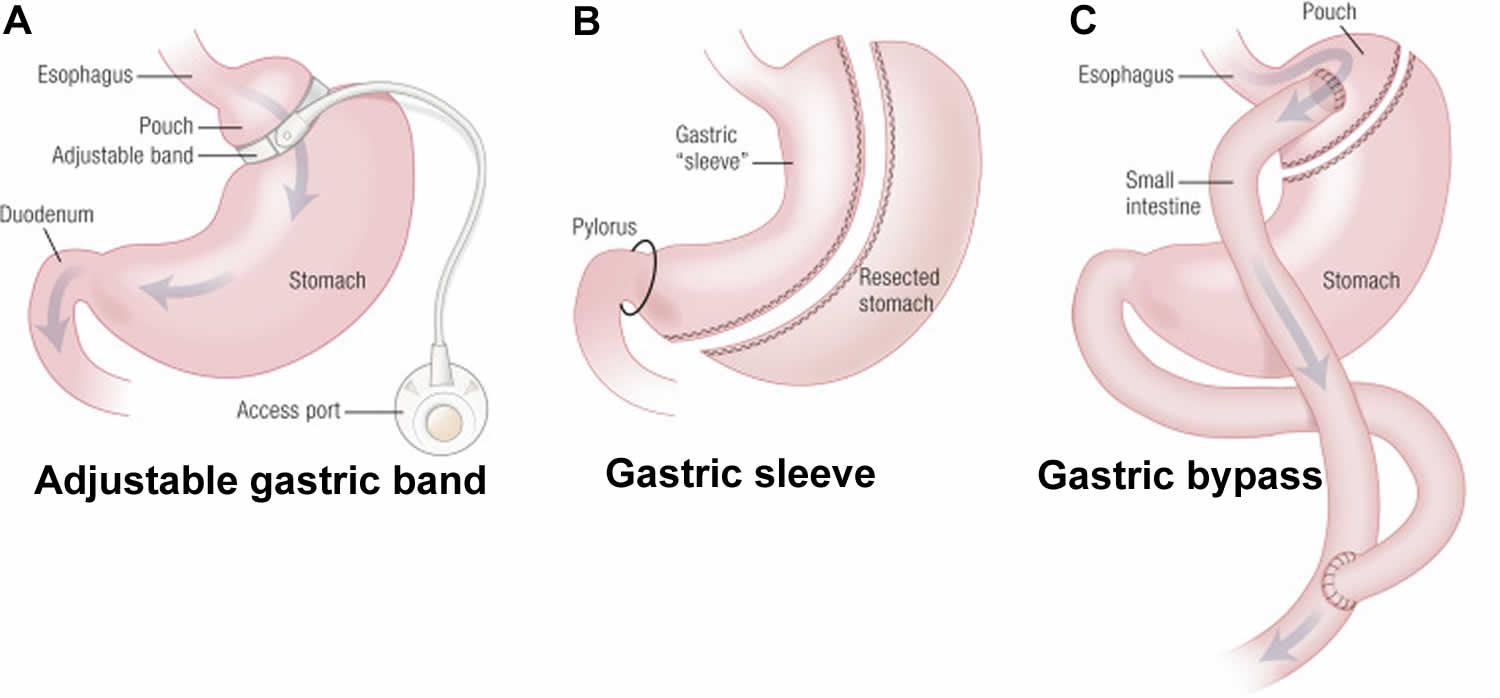
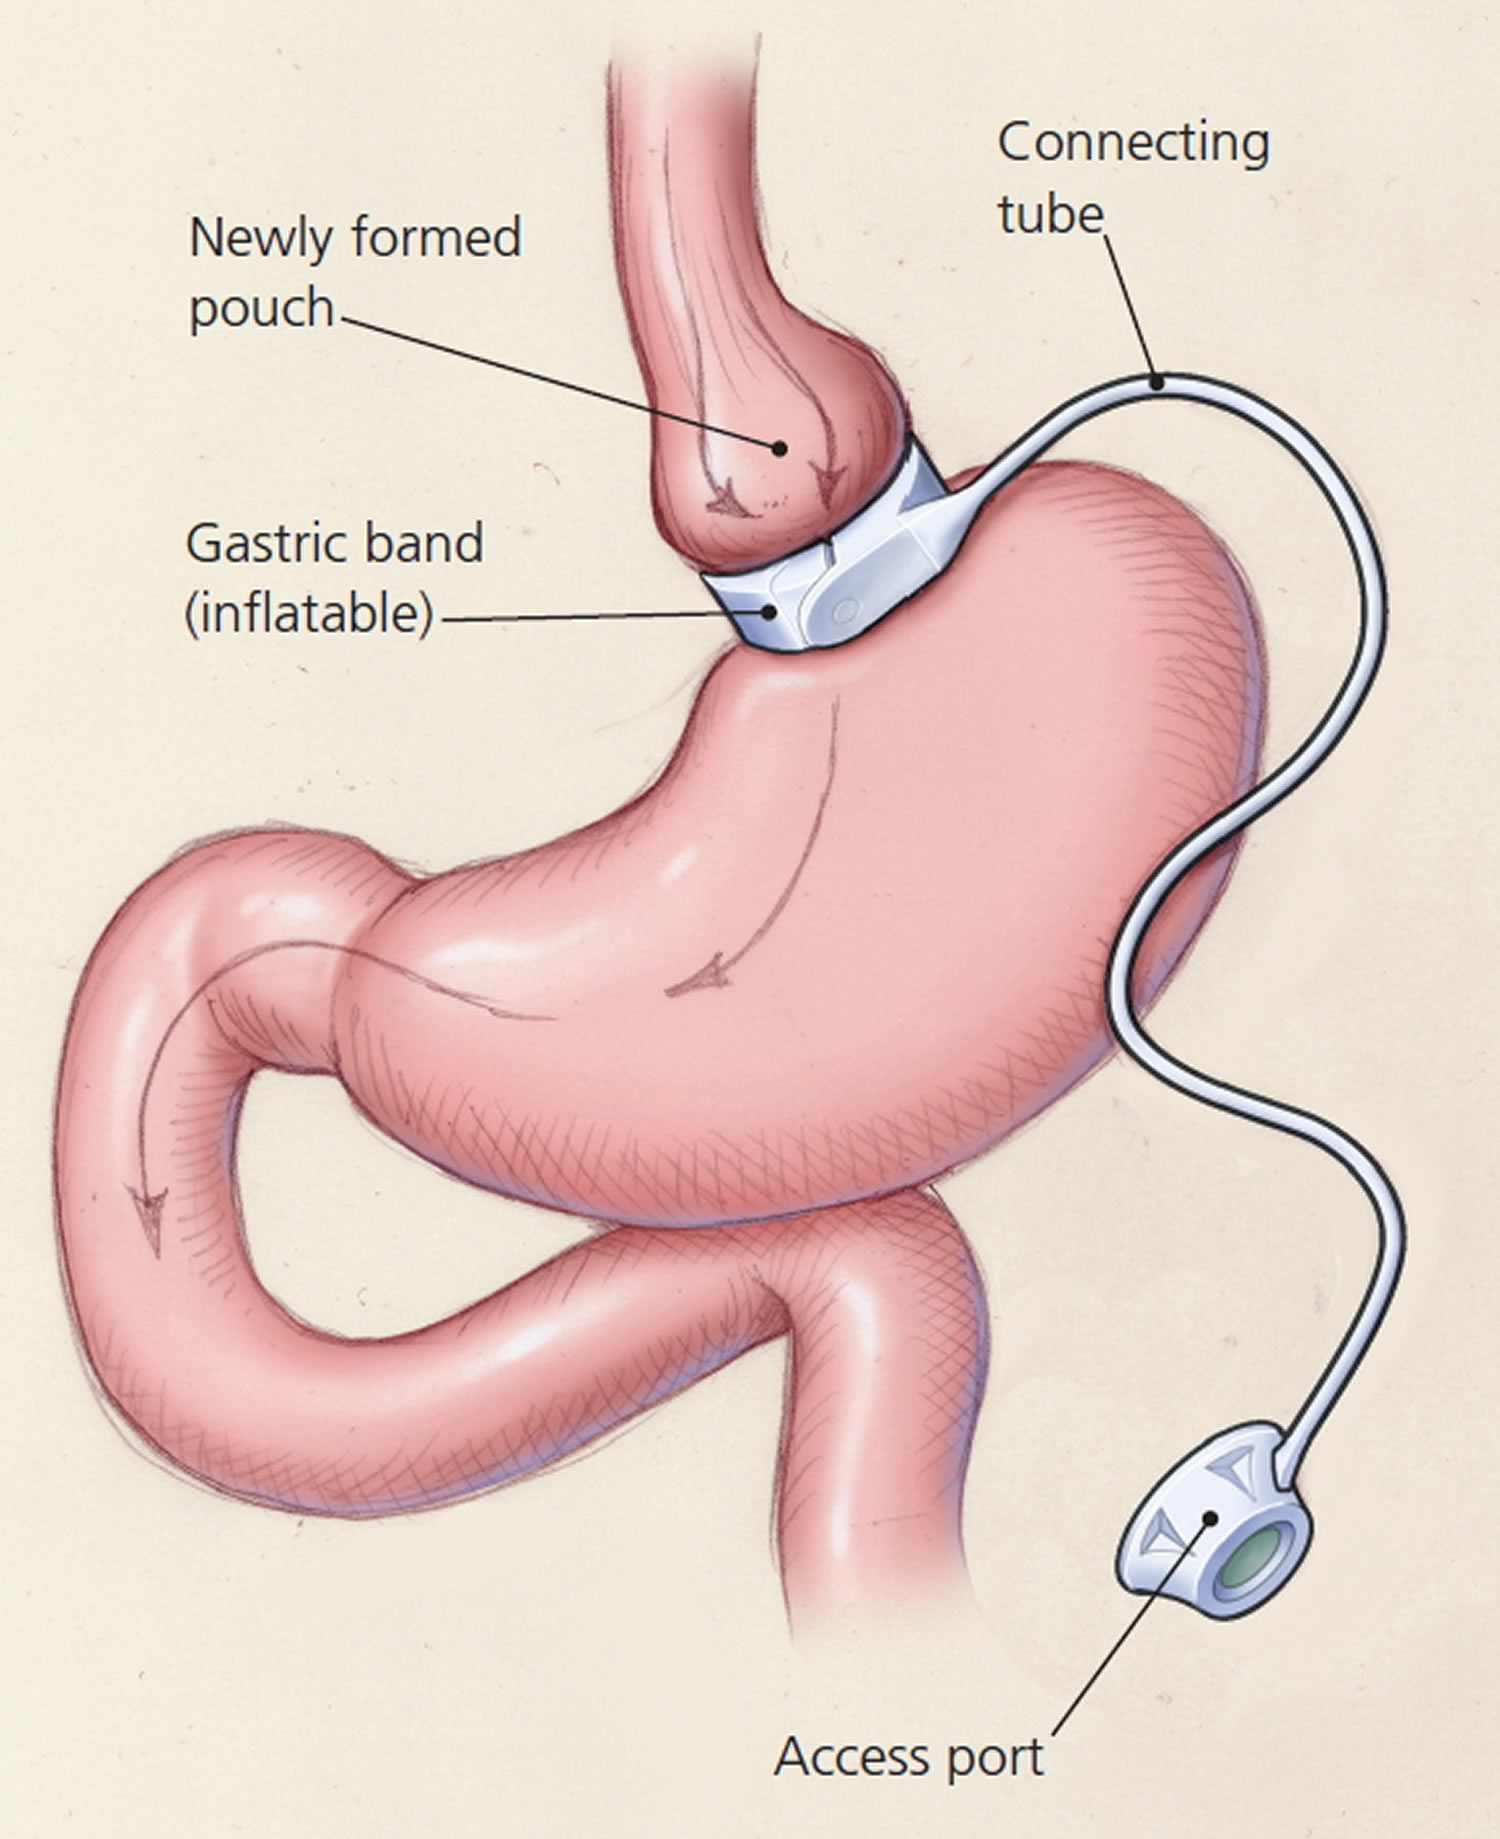
In laparoscopic adjustable gastric banding, a hollow, flexible silicone band is placed around the upper stomach, which causes a restrictive effect, reduces stomach capacity, and produces rapid feelings of satiety. The band is tightened by injecting saline into it through a subcutaneous port, which is located just inferior to the sternum or lateral to the umbilicus (Figure 8). Because of a higher complication rate and less weight loss compared with the other two most common procedures (gastric sleeve and Roux-en-Y gastric bypass), the demand for gastric banding is decreasing in the United States 48.
Figure 11. Adjustable Gastric Banding
Who is gastric bypass surgery for?
Gastric bypass and other weight-loss surgeries are major, life-changing procedures. While weight-loss surgery can help reduce your risk of weight-related health problems — such as type 2 diabetes, high blood pressure, heart disease and obstructive sleep apnea — it can also pose major risks and complications. You may need to meet certain medical guidelines to qualify for weight-loss surgery. You likely will have an extensive screening process to see if you qualify.
In general, gastric bypass and other weight-loss surgeries could be an option for you if:
- Your efforts to lose weight with diet and exercise have been unsuccessful
- Your body mass index (BMI) is 40 or higher (extreme obesity).
- Your BMI is 35 to 39.9 (obesity), and you have a serious weight-related health problem, such as type 2 diabetes, high blood pressure or severe sleep apnea.
- In some cases, you may qualify for certain types of weight-loss surgery if your BMI is 30 to 34 and you have serious weight-related health problems.
- You’re a teenager who’s gone through puberty, your BMI is 35 or more, and you have serious obesity-related health problems, such as type 2 diabetes or severe sleep apnea
Even if you meet these general guidelines, you still may need to meet certain other medical guidelines to qualify for weight-loss surgery. You likely will have an extensive screening process to see if you qualify.
A team of health professionals — usually including a doctor, dietitian, psychologist and surgeon — evaluate whether gastric bypass or one of the other forms of weight-loss surgery is appropriate for you. This evaluation generally determines if the health benefits of the surgery outweigh the potentially serious risks, and if you’re medically ready to undergo the procedure.
The evaluation also determines if you’re psychologically ready to undergo weight-loss surgery. The procedure may increase certain risks in people with existing mental health conditions that aren’t effectively managed.
For example, recent studies have identified an increased risk of suicide in people who have had weight-loss surgery. This risk is greatest in those who have attempted suicide in the past. More research is needed to understand whether changes related to the surgery itself play a role in increasing suicide risk.
A history of suicidal thoughts or attempts does not necessarily mean bariatric surgery isn’t right for you, but your health care team should carefully evaluate your history and plan for close monitoring and support before and after the surgery.
When conducting an evaluation for gastric bypass surgery, the health care team considers:
- Your nutrition and weight history. The team reviews your weight trends, diet attempts, eating habits, exercise regimen, stress level, time constraints, motivation and other factors.
- Your medical condition. Some health problems increase the risks associated with having surgery or may be worsened by surgery, such as blood clots, liver disease, heart problems, kidney stones and nutritional deficiencies. The team evaluates what medications you take, how much alcohol you drink and whether you smoke. You will be evaluated for sleep apnea and receive a thorough physical exam and laboratory testing. The results of these tests and exams may help determine eligibility for weight-loss surgery.
- Your psychological status. Certain mental health conditions may contribute to obesity or make it more difficult for you to maintain the health benefits of gastric bypass surgery. These may include binge-eating disorder, substance abuse, anxiety disorders, major depression, schizophrenia, severe bipolar disorder and issues related to childhood sexual abuse. While these conditions may not prevent you from having gastric bypass surgery, your doctors may want to postpone surgery to ensure that any condition or significant sources of stress are appropriately treated and managed.
- Your motivation. The team will also assess your willingness and ability to follow through with recommendations made by your health care team and to carry out prescribed changes in your diet and exercise routine.
- Your age. There’s no specific age limit for gastric bypass surgery, but, until recently, the procedure was considered too risky for teenagers and older adults. Newer studies have found gastric bypass surgery can be safe and effective for adults ages 60 and older. The procedure is also now considered an option for some teenagers with a BMI of 35 or more and serious obesity-related health problems.
You must also be willing to make permanent changes to lead a healthier lifestyle. You may be required to participate in long-term follow-up plans that include monitoring your nutrition, your lifestyle and behavior, and your medical conditions.
Check with your health insurance plan or your regional Medicare or Medicaid office to find out if your policy covers weight-loss surgery. If you plan to rely on health insurance coverage for your gastric bypass surgery, you will need to get preapproval from your health insurance company. The preapproval process typically requires documentation from your team of doctors that justifies your medical need for gastric bypass surgery.
Different health insurers have different requirements to prove your medical need for gastric bypass surgery. Your health insurer may not cover gastric bypass surgery at all or may cover only parts of the process. To avoid unpleasant financial surprises, it’s a good idea to check to see what specific services are covered before starting the evaluation process. You may have to pay for some portion of the costs yourself.
When weight-loss surgery doesn’t work
It’s possible to not lose enough weight or to regain weight after weight-loss surgery. This weight gain can happen if you don’t follow the recommended lifestyle changes. If you frequently snack on high-calorie foods, for instance, you may have inadequate weight loss. To help avoid regaining weight, you must make permanent healthy changes in your diet and get regular physical activity and exercise.
It’s important to keep all of your scheduled follow-up appointments after weight-loss surgery so that your doctor can monitor your progress. If you notice that you aren’t losing weight or you develop complications after your surgery, see your doctor immediately.
What happens if you gain back weight after gastric bypass surgery?
If you begin to regain weight after gastric bypass surgery, talk to your doctor. You may have a sense of what’s causing your weight gain. However, you may need a more thorough evaluation to determine what factors — medical, psychological, lifestyle — are involved in the weight gain.
You may have gained weight after gastric bypass surgery because of changes in your stomach and intestine that allow you to eat more and absorb more calories.
It’s also possible that your diet and exercise habits have slipped, in which case you must typically lose the regained weight the old-fashioned way — both by reducing your calorie intake and increasing your physical activity.
In some cases, a second surgery to repair — or redo — a gastric bypass may be appropriate. This is especially true if the anatomy of your stomach and small intestine have changed, such as with a fistula (additional connection between the stomach and intestine).
However, a second surgery has an increased risk of complications, including infection, bleeding and leaks in the gastrointestinal tract. Because of these risks, gastric bypass surgery usually isn’t redone if you regain weight because of poor diet or exercise habits.
Gastric bypass surgery can be an effective treatment for obesity, and most people do lose weight after the procedure if they are adequately prepared for the changes that are necessary. But you’ll always be at risk of regaining weight, even years later.
To help reach your weight-loss goal and prevent weight regain, it’s crucial to make lifestyle changes along with having gastric bypass surgery.
Gastric bypass surgery risks
As with any major surgery, gastric bypass and other weight-loss surgeries pose potential health risks, both in the short term and long term.
Risks associated with the surgical procedure are similar to any abdominal surgery and can include:
- Excessive bleeding
- Infection
- Adverse reactions to anesthesia
- Blood clots
- Lung or breathing problems
- Leaks in your gastrointestinal system
Longer term risks and complications of gastric bypass surgery can include:
- Bowel obstruction
- Dumping syndrome, causing diarrhea, nausea or vomiting
- Gallstones
- Hernias
- Low blood sugar (hypoglycemia)
- Malnutrition
- Stomach perforation
- Ulcers
- Vomiting
- Anastomotic leaking
Rarely, complications of gastric bypass can be fatal.
Risks of anastomotic leaking
Anastomotic leaks happen in 1.5% to 6% of gastric bypass procedures, depending on the type of surgery. A leak may happen up to several weeks later. Most develop within 3 days after surgery.
A leaking anastomosis may cause bleeding and infection until it is treated. These leaks are serious and can be life-threatening. Long-term complications may include ulcers, scarring, and narrowing of the anastomosis (where the intestine is connected to the gastric pouch), known as a stricture. A drainage tract through the skin called a fistula may also develop. A fistula could develop between the gastric pouch and the bypassed stomach. Pneumonia is another dangerous complication, because digestive juices can spill into the lungs.
If you are considering gastric bypass surgery for obesity, discuss the procedure carefully with your healthcare provider. The overall risk of serious complications should be weighed against the risk of continued obesity. Remember that gastric bypass surgery works best when combined with long-term, healthy lifestyle choices. These involve good nutritional eating habits and regular exercise.
Symptoms of an anastomotic leak include:
- Rapid heart rate
- Fever
- Stomach pain
- Drainage from a surgical wound
- Nausea and vomiting
- Pain in the left shoulder area
- Low blood pressure
- Decreased urine output
The more obese you are, the more at risk you are for an anastomotic leak. Other risk factors include being male, having other medical problems besides obesity, and having a history of previous abdominal surgery.
Diagnosis and treatment of anastomotic leaking
A diagnostic test used to look for anastomotic leaking is an upper GI or a CT scan. Both involve swallowing some liquid contrast dye and then taking X-rays to see if the dye is leaking through the anastomosis. Even if you have a negative exam but still have symptoms, your healthcare provider may recommend an emergency operation to look for a leak.
The medical team treating an anastomotic leak will likely take these steps:
- Give you antibiotics through an intravenous line (IV).
- Drain any infection caused by the leak, repair the leak, or make a new anastomosis by operating again.
- Use an upper endoscopy to place a temporary stent across the leaking area, from the inside of the gastric pouch or the small intestine.
- Stop all oral feedings. You may be fed through a tube that goes directly into your intestine until the leak has healed.
How you prepare for gastric bypass surgery
If you qualify for gastric bypass surgery, your health care team gives you instructions on how to prepare for surgery. You may need to have various lab tests and exams before surgery.
Food and medications
Before your gastric bypass surgery, give your doctor and any other health care providers a list of all medicines, vitamins, minerals, and herbal or dietary supplements you take. You may have restrictions on eating and drinking and which medications you can take.
If you take blood-thinning medications, talk with your doctor before your surgery. Because these medications affect clotting and bleeding, your blood-thinning medication routine may need to be changed.
If you have diabetes, talk with the doctor who manages your insulin or other diabetes medications for specific instructions on taking or adjusting them after surgery.
Other precautions
You will be required to start a physical activity program and to stop any tobacco use.
You may also need to prepare by planning ahead for your recovery after surgery. For instance, arrange for help at home if you think you’ll need it.
Gastric bypass surgery is done in the hospital. Depending on your recovery, your hospital stay may last around three to five days.
Gastric bypass procedure
Before you go to the operating room, you’ll change into a gown and be asked several questions by both doctors and nurses. In the operating room, you are given a general anesthetic before your surgery begins. The anesthetic is medicine that keeps you asleep and comfortable during surgery.
During the gastric bypass surgery
The specifics of your gastric bypass surgery depend on your individual situation and the doctor’s practices. Some surgeries are done with traditional large (open) incisions in your abdomen. However, most are performed laparoscopically, which involves inserting instruments through multiple small incisions in the abdomen.
After making the incisions with the open or laparoscopic technique, the surgeon cuts across the top of your stomach, sealing it off from the rest of your stomach. The resulting pouch is about the size of a walnut and can hold only about an ounce of food. Normally, your stomach can hold about 3 pints of food.
Then, the surgeon cuts the small intestine and sews part of it directly onto the pouch. Food then goes into this small pouch of stomach and then directly into the small intestine sewn to it. Food bypasses most of your stomach and the first section of your small intestine, and instead enters directly into the middle part of your small intestine.
Surgery usually takes a few hours. After surgery, you awaken in a recovery room, where medical staff monitors you for any complications.
After the gastric bypass surgery
Immediately after gastric bypass surgery, you may have liquids but no solid food as your stomach and intestines begin to heal. You’ll then follow a special diet plan that changes slowly from liquids to pureed foods. After that, you can eat soft foods, then move on to firmer foods as your body is able to tolerate them.
You may have many restrictions or limits on how much and what you can eat and drink. Your doctor will recommend you take vitamin and mineral supplements after surgery, including a multivitamin with iron, calcium and vitamin B-12.
You’ll also have frequent medical checkups to monitor your health in the first several months after weight-loss surgery. You may need laboratory testing, blood work and various exams.
You may experience changes as your body reacts to the rapid weight loss in the first three to six months after gastric bypass, including:
- Body aches
- Feeling tired, as if you have the flu
- Feeling cold
- Dry skin
- Hair thinning and hair loss
- Mood changes
Gastric bypass diet
A gastric bypass diet is for people who are recovering from gastric bypass surgery to help them heal and change their eating habits.
Diet recommendations after gastric bypass surgery vary depending on where the surgery is performed and your individual situation.
Your doctor or a registered dietitian will talk with you about the diet you’ll need to follow after surgery, explaining what types of food and how much you can eat at each meal. Closely following your gastric bypass diet can help you lose weight safely.
A gastric bypass diet typically follows a staged approach to help you ease back into eating solid foods as you recover. How quickly you move from one step to the next depends on how fast your body heals and adjusts to the change in eating patterns. You can usually start eating regular foods about three months after surgery.
After gastric bypass surgery, you must be careful to drink enough fluids to avoid dehydration, and to pay extra attention to signs that you feel hungry or full.
Liquids
For the first day or so after surgery, you’ll only be allowed to drink clear liquids. Sip slowly and drink only 2 to 3 ounces (59 to 89 milliliters) at a time. Once you’re handling clear liquids, you can start having other liquids, such as skim or low-fat milk.
Liquids you can have during stage 1:
- Broth
- Unsweetened juice
- Decaffeinated tea or coffee
- Milk (skim or 1 percent)
- Strained cream soup
- Sugar-free gelatin or popsicles
Pureed foods
Once you’re able to tolerate liquids for a few days, you can begin to eat strained and pureed (mashed up) foods. During this phase, you can only eat foods that have the consistency of a smooth paste or a thick liquid, without any solid pieces of food in the mixture.
To puree your foods, choose foods that will blend well, such as:
- Lean ground meats
- Beans
- Fish
- Eggs
- Soft fruits and cooked vegetables
- Cottage cheese
Blend solid foods with a liquid, such as:
- Water
- Skim milk
- Juice with no sugar added
- Broth
It’s important that you don’t eat and drink at the same time. Wait about 30 minutes after a meal to drink anything. Also keep in mind that your digestive system might still be sensitive to spicy foods or dairy products. If you’d like to eat these foods during this phase, add them into your diet slowly and in small amounts.
Soft foods
After a few weeks of pureed foods, and with your doctor’s okay, you can add soft foods — in the form of small, tender, easily chewed pieces — to your diet.
During this stage, your diet can include:
- Ground or finely diced meats
- Canned or soft fresh fruit (without seeds or skin)
- Cooked vegetables (without skin)
Solid foods
After about eight weeks on the gastric bypass diet, you can gradually return to eating firmer foods. But foods must still be chopped or diced. Start slowly with regular foods to see what foods you can tolerate. You may find that you still have difficulty eating spicier foods or foods with crunchy textures.
Even at this stage, there are foods you should avoid because they may cause gastrointestinal symptoms, such as nausea, pain or vomiting.
Foods to avoid:
- Nuts and seeds
- Popcorn
- Dried fruits
- Carbonated beverages
- Granola
- Stringy or fibrous vegetables, such as celery, broccoli, corn or cabbage
- Tough meats or meats with gristle
- Fried foods
- Breads
Over time, you may be able to try some of these foods again, with the guidance of your doctor.
A new healthy diet
Three to four months after weight-loss surgery, you may be able to start eating a normal healthy diet, depending on your situation and any foods you may not be able to tolerate. It’s possible that foods that initially irritated your stomach after surgery may become more tolerable as your stomach continues to heal.
Throughout the diet
To ensure that you get enough vitamins and minerals and keep your weight-loss goals on track, at each stage of the gastric bypass diet, you should:
- Eat and drink slowly. Eating or drinking too quickly may cause dumping syndrome — when foods and liquids enter your small intestine rapidly and in larger amounts than normal, causing nausea, vomiting, dizziness, sweating and eventually diarrhea. To prevent dumping syndrome, choose foods and liquids low in fat and sugar, eat and drink slowly, and wait 30 to 45 minutes before or after each meal to drink liquids. Take at least 30 minutes to eat your meals and 30 to 60 minutes to drink 1 cup (237 milliliters) of liquid.
- Keep meals small. During the diet progression, you should eat several small meals a day and sip liquids slowly throughout the day (not with meals). You might first start with six small meals a day, then move to four meals and finally, when following a regular diet, decrease to three meals a day. Each meal should include about a half-cup to a cup of food. Make sure you eat only the recommended amounts and stop eating before you feel full
- Drink liquids between meals. Expect to drink at least 6 to 8 cups (48 to 64 ounces, or 1.4 to 1.9 liters) of fluids a day to prevent dehydration. Drinking liquids with your meals can cause pain, nausea and vomiting as well as dumping syndrome. Also, drinking too much liquid at or around mealtime can leave you feeling overly full and prevent you from eating enough nutrient-rich food.
- Chew food thoroughly. The new opening that leads from your stomach into your intestine is very small, and larger pieces of food can block the opening. Blockages prevent food from leaving your stomach and can cause vomiting, nausea and abdominal pain. Take small bites of food and chew them to a pureed consistency before swallowing. If you can’t chew the food thoroughly, don’t swallow it.
- Focus on high-protein foods. Immediately after your surgery, eating high-protein foods can help you heal. High-protein, low-fat choices remain a good long-term diet option after your surgery, as well. Try adding lean cuts of beef, chicken, pork, fish or beans to your diet. Low-fat cheese, cottage cheese and yogurts also are good protein sources.
- Avoid foods that are high in fat and sugar. After your surgery, it may be difficult for your digestive system to tolerate foods that are high in fat or added sugars. Avoid foods that are high in fat (such as fried foods, ice cream and candy bars). Look for sugar-free options of soft drinks and dairy products.
- Try new foods one at a time. After surgery, certain foods may cause nausea, pain and vomiting or may block the opening of the stomach. The ability to tolerate foods varies from person to person. Try one new food at a time and chew thoroughly before swallowing. If a food causes discomfort, don’t eat it. As time passes, you may be able to eat this food. Foods and liquids that commonly cause discomfort include meat, bread, raw vegetables, fried foods and carbonated beverages.
- Take recommended vitamin and mineral supplements. Because a portion of your small intestine is bypassed after surgery, your body won’t be able to absorb enough nutrients from your food. You’ll likely need to take a multivitamin supplement every day for the rest of your life. Talk to your doctor about what type of multivitamin might be right for you and whether you might need to take additional supplements, such as calcium.
The greatest risks of the gastric bypass diet come from not following the diet properly. If you eat too much or eat food that you shouldn’t, you could have complications. These include:
- Dumping syndrome. This complication occurs most often after eating foods high in sugar or fat. These foods travel quickly through your stomach pouch and “dump” into your intestine. Dumping syndrome can cause nausea, vomiting, dizziness, sweating and eventually diarrhea.
- Dehydration. Because you’re not supposed to drink fluids with your meals, some people become dehydrated. You can prevent dehydration by sipping 48 to 64 ounces (1.4 to 1.9 liters) of water and other low-calorie beverages throughout the day.
- Nausea and vomiting. If you eat too much, eat too fast or don’t chew your food adequately, you may become nauseated or vomit after meals.
- Constipation. If you don’t follow a regular schedule for eating your meals, don’t eat enough fiber or don’t exercise, you may become constipated.
- Blocked opening of your stomach pouch. It’s possible for food to become lodged at the opening of your stomach pouch, even if you carefully follow the diet. Signs and symptoms of a blocked stomach opening include ongoing nausea, vomiting and abdominal pain. Call your doctor if you have these symptoms for more than two days.
- Weight gain or failure to lose weight. If you continue to gain weight or fail to lose weight on the gastric bypass diet, it’s possible you could be eating too many calories. Talk to your doctor or dietitian about changes you can make to your diet.
What is dumping syndrome after gastric bypass surgery?
Dumping syndrome after gastric bypass surgery is when food gets “dumped” directly from your stomach pouch into your small intestine without being digested. There are 2 types of dumping syndrome: early and late. Early dumping happens 10 to 30 minutes after a meal. Late dumping happens 1 to 3 hours after eating. Each has slightly different symptoms, such as abdominal cramping, fast heartbeat, lightheadedness, and diarrhea.
What causes dumping syndrome after gastric bypass surgery?
Early dumping syndrome can occur because of the dense mass of food that gets dumped into your small intestine at an earlier stage of digestion. The intestines sense that this food mass is too concentrated, and release gut hormones. Your body reacts by shifting fluid circulating in your bloodstream to the inside of your intestine. As a result, your intestines become fuller and bloated. Diarrhea often occurs 30 to 60 minutes later. In addition, certain substances are released by your intestine that affect heart rate and often blood pressure, causing many of the symptoms of early dumping. This can lead to lightheadedness or even fainting.
Symptoms of late dumping happen because of a decrease in blood sugar level (reactive hypoglycemia). Reactive hypoglycemia is low blood sugar caused 1 to 3 hours after a large surge of insulin. You are more likely to have dumping syndrome if you eat a meal heavy in starches or sugars. The sugars can be either fructose or table sugar (sucrose). Insulin levels can increase to high levels, then lower your blood sugar too much.
Who is at risk for dumping syndrome after gastric bypass surgery?
Dumping syndrome can happen in at least 3 out of 20 people who have had a part of their stomach removed for any reason.
What are the symptoms of dumping syndrome after gastric bypass surgery?
Most people have early dumping symptoms. Typical early dumping symptoms can include:
- Bloating
- Sweating
- Abdominal cramps and pain
- Nausea
- Facial flushing
- Stomach growling or rumbling
- An urge to lie down after the meal
- Heart palpitations and fast heartbeat
- Dizziness or fainting
- Diarrhea
About 1 in 4 people have late dumping symptoms. The symptoms of late dumping syndrome can include:
- Heart palpitations
- Sweating
- Hunger
- Confusion
- Fatigue
- Aggression
- Tremors
- Fainting
How is dumping syndrome after gastric bypass surgery diagnosed?
Your healthcare team will likely diagnose dumping syndrome based on your symptoms and when they occur. Tell him or her which foods or liquids give you symptoms. You may also need to have a glucose tolerance test or hydrogen breath test to help your healthcare provider diagnose you.
How is dumping syndrome after gastric bypass surgery treated?
The main treatment for dumping syndrome is changes in your diet. These include
- Don’t drink liquids until at least 30 minutes after a meal.
- Divide your daily calories into 6 small meals.
- Lie down for 30 minutes after a meal to help control the symptoms.
- Choose complex carbohydrates such as whole grains.
- Avoid foods high in simple carbohydrates, such as those made white flour or sugar.
- Add more protein and fat to your meals.
- Stop eating dairy foods, if they cause problems.
Another option is to slow gastric emptying by making your food thicker. Your healthcare provider may advise adding 15 grams of guar gum or pectin to each meal. But many people don’t tolerate these additions to their food.
If dietary changes don’t help, your healthcare provider may give you some slow-release prescription medicines. In rare cases, these may help, but they often don’t work. In severe cases of dumping syndrome, your healthcare provider may suggest tube feeding or corrective surgery.
What causes iron deficiency after gastric bypass surgery?
Iron deficiency is a side effect that results from the changes made during the surgery. Most of the iron from foods such as meats, legumes, and iron-fortified grains is absorbed in the first part of your small intestine (duodenum). But after a gastric bypass procedure, food bypasses the duodenum. This can lead to iron deficiency and other nutrition problems.
The amount of iron in a standard multivitamin (18 mg) may not be enough to prevent anemia if you have this kind of surgery. You will need to take more iron if you are iron deficient after a gastric bypass.
Who is at risk for iron deficiency after gastric bypass surgery?
Iron deficiency is more common in women who have this surgery after menopause. It can occur in more than half of women in this age group. Men who have had gastric bypass also may develop iron deficiency. But this side effect happens much less often in men.
What are the symptoms of iron deficiency after gastric bypass surgery?
Iron has many important roles in your body. It’s important for the health of your hair, skin, and nails. It also helps make hemoglobin. This is the substance inside red blood cells that carries oxygen throughout your body. When you are anemic because of iron deficiency, you may have:
- Lack of energy
- Weakness
- Headache
- Rapid heartbeat
- Hair loss
- Brittle nails
- Pale or yellow skin
- Shortness of breath
- Chest pain
- Strange pounding sensation in your ears
- Craving for ice or clay (pagophagia)
How is iron deficiency after gastric bypass surgery diagnosed?
Your healthcare provider will note any of the above symptoms. He or she will also order blood tests to find out if you have iron deficiency or anemia. In its early stages, iron deficiency begins to use up the stores of iron in your body. This can be seen by testing your levels of ferritin. Ferritin is a protein that stores iron in your body. If your ferritin levels are low, your iron is likely low.
If your iron deficiency has turned into iron deficiency anemia, you will need a complete blood count test to find any other problems. These might include low hemoglobin, lower numbers of red blood cells, and smaller red blood cell size.
For men, or for women past menopause, iron deficiency anemia might not be related to the gastric bypass surgery. Your healthcare provider will need to be certain that you are not anemic from blood loss elsewhere, such as from your intestine. You may need a colonoscopy to look for a source of blood loss from your large intestine.
How is iron deficiency after gastric bypass surgery treated?
Many people can raise their iron levels by making some changes to their diet. If your iron deficiency is related to a gastric bypass procedure, your healthcare team probably will prescribe iron supplements. This extra iron should come from a prescription from your provider, not from an over-the-counter (OTC) supplement you pick yourself. The exception to this is if your healthcare provider recommends a certain over-the-counter iron product for you. Your provider may recommend a certain type of iron that you could absorb better after a gastric bypass.
If you are a teen boy or girl, or a woman of childbearing age, you may need 2 multivitamins plus 50 mg to 100 mg of iron each day. You may also need a vitamin C supplement or other supplements to help your body absorb more iron. Your healthcare provider will tell you the right amount of iron that you need.
Iron supplement can cause side effects. Many people have constipation and nausea.
For some people, supplements aren’t enough. This is usually true for women with heavy menstrual periods. You may need iron through an IV (intravenous) line or blood transfusion. Or you may need more surgery on your bypass to increase the amount of iron you absorb.
Can iron deficiency after gastric bypass surgery be prevented?
You should have a blood tests before weight-loss surgery to find out if you have any vitamin or mineral deficiencies. These might be low levels of iron, vitamin B-12, or folate. Getting treatment for these deficiencies before your surgery will help your quality of life after surgery.
After gastric bypass surgery, you will need to monitor your level of iron and other nutrients for the rest of your life. You can develop iron deficiency and anemia years or decades after your gastric bypass surgery. Your healthcare provider should measure your iron levels 6 months after weight-loss surgery and at least once a year after that. You should also have a complete blood count test.
Red meat, poultry, seafood, leafy greens, legumes, iron-fortified grains, and other iron-fortified foods are all good sources of iron. Drinking more than 2 to 3 cups of milk a day may decrease how much iron you absorb. But dietary changes alone may not be enough to prevent or fix an iron deficiency related to a gastric bypass procedure. Work with your healthcare provider to find the right iron supplement plan for you.
References- Sleeve gastrectomy. https://www.mayoclinic.org/tests-procedures/sleeve-gastrectomy/about/pac-20385183
- Types of Weight-loss Surgery. https://www.niddk.nih.gov/health-information/weight-management/bariatric-surgery/types
- Brethauer SA. Sleeve gastrectomy. Surg Clin North Am. 2011 Dec;91(6):1265-79, ix. doi: 10.1016/j.suc.2011.08.012
- Gumbs AA, Gagner M, Dakin G, Pomp A. Sleeve gastrectomy for morbid obesity. Obes Surg. 2007 Jul;17(7):962-9. doi: 10.1007/s11695-007-9151-x
- Jensen MD, Ryan DH, Apovian CM, et al. American College of Cardiology/American Heart Association Task Force on Practice Guidelines; Obesity Society. 2013 AHA/ACC/TOS guideline for the management of overweight and obesity in adults: a report of the American College of Cardiology/American Heart Association Task Force on Practice Guidelines and The Obesity Society. Circulation. 2014 Jun 24;129(25 Suppl 2):S102-38. doi: 10.1161/01.cir.0000437739.71477.ee. Epub 2013 Nov 12. Erratum in: Circulation. 2014 Jun 24;129(25 Suppl 2):S139-40.
- Gastrointestinal surgery for severe obesity consensus statement. Nutrition Today 1991;26:32–35.
- Harith Rajagopalan, Alan D. Cherrington, Christopher C. Thompson, Lee M. Kaplan, Francesco Rubino, Geltrude Mingrone, Pablo Becerra, Patricia Rodriguez, Paulina Vignolo, Jay Caplan, Leonardo Rodriguez, Manoel P. Galvao Neto; Endoscopic Duodenal Mucosal Resurfacing for the Treatment of Type 2 Diabetes: 6-Month Interim Analysis From the First-in-Human Proof-of-Concept Study. Diabetes Care 1 December 2016; 39 (12): 2254–2261. https://doi.org/10.2337/dc16-0383
- Styne DM, Arslanian SA, Connor EL, Farooqi IS, Murad MH, Silverstein JH, Yanovski JA. Pediatric Obesity-Assessment, Treatment, and Prevention: An Endocrine Society Clinical Practice Guideline. J Clin Endocrinol Metab. 2017 Mar 1;102(3):709-757. doi: 10.1210/jc.2016-2573
- Arterburn D, Wellman R, Emiliano A, et al. Comparative effectiveness and safety of bariatric procedures for weight loss: a PCORnet cohort study. Annals of Internal Medicine. 2018;169(11):741–750. doi: 10.7326/M17-2786
- Ortega E, Morínigo R, Flores L, Moize V, Rios M, Lacy AM, Vidal J. Predictive factors of excess body weight loss 1 year after laparoscopic bariatric surgery. Surg Endosc. 2012 Jun;26(6):1744-50. doi: 10.1007/s00464-011-2104-4
- Ramada Faria GF, Nunes Santos JM, Simonson DC. Quality of life after gastric sleeve and gastric bypass for morbid obesity. Porto Biomed J. 2017 Mar-Apr;2(2):40-46. doi: 10.1016/j.pbj.2016.12.006
- Gloy VL, Briel M, Bhatt DL, et al. Bariatric surgery versus non-surgical treatment for obesity: a systematic review and meta-analysis of randomised controlled trials. BMJ. 2013;347:f5934.
- Courcoulas AP, Christian NJ, Belle SH, et al.; Longitudinal Assessment of Bariatric Surgery (LABS) Consortium. Weight change and health outcomes at 3 years after bariatric surgery among individuals with severe obesity. JAMA. 2013;310(22):2416-2425.
- Sjöström L, Peltonen M, Jacobson P, et al. Association of bariatric surgery with long-term remission of type 2 diabetes and with microvascular and macrovascular complications. JAMA. 2014;311(22):2297-2304.
- American Society for Metabolic and Bariatric Surgery (ASMBS). New procedure estimates for bariatric surgery: what the numbers reveal. Connect. http://connect.asmbs.org/may-2014-bariatric-surgery-growth.html
- Coblijn UK, Verveld CJ, van Wagensveld BA, Lagarde SM. Laparoscopic Roux-en-Y gastric bypass or laparoscopic sleeve gastrectomy as revisional procedure after adjustable gastric band—a systematic review. Obes Surg. 2013;23(11):1899-1914.
- Puzziferri N, Roshek TB III, Mayo HG, Gallagher R, Belle SH, Livingston EH. Long-term follow-up after bariatric surgery: a systematic review. JAMA. 2014; 312(9): 934-942.
- Bariatric Surgery and Long-term Durability of Weight Loss. JAMA Surg. 2016;151(11):1046-1055. doi:10.1001/jamasurg.2016.2317 https://jamanetwork.com/journals/jamasurgery/fullarticle/2546331
- Schauer PR, Bhatt DL, Kirwan JP, et al.; STAMPEDE Investigators. Bariatric surgery versus intensive medical therapy for diabetes—3-year outcomes. N Engl J Med. 2014;370(21):2002-2013.
- Sjöström L, Peltonen M, Jacobson P, et al. Association of bariatric surgery with long-term remission of type 2 diabetes and with microvascular and macrovascular complications. JAMA. 2014;311(22):2297-2304
- Müller-Stich BP, Senft JD, Warschkow R, et al. Surgical versus medical treatment of type 2 diabetes mellitus in nonseverely obese patients: a systematic review and meta-analysis. Ann Surg. 2015;261(3):421-429.
- Sjöström L, Narbro K, Sjöström CD, et al.; Swedish Obese Subjects Study. Effects of bariatric surgery on mortality in Swedish obese subjects. N Engl J Med. 2007; 357(8): 741-752.
- Adams TD, Gress RE, Smith SC, et al. Long-term mortality after gastric bypass surgery. N Engl J Med. 2007; 357(8):753-761.
- Arterburn DE, Olsen MK, Smith VA, et al. Association between bariatric surgery and long-term survival. JAMA. 2015;313(1):62-70.
- Inge TH, Jenkins TM, Xanthakos SA, Dixon JB, Daniels SR, Zeller MH, Helmrath MA. Long-term outcomes of bariatric surgery in adolescents with severe obesity (FABS-5+): a prospective follow-up analysis. Lancet Diabetes Endocrinol. 2017 Mar;5(3):165-173. doi: 10.1016/S2213-8587(16)30315-1
- Olbers T, Beamish AJ, Gronowitz E, Flodmark CE, Dahlgren J, Bruze G, Ekbom K, Friberg P, Göthberg G, Järvholm K, Karlsson J, Mårild S, Neovius M, Peltonen M, Marcus C. Laparoscopic Roux-en-Y gastric bypass in adolescents with severe obesity (AMOS): a prospective, 5-year, Swedish nationwide study. Lancet Diabetes Endocrinol. 2017 Mar;5(3):174-183. doi: 10.1016/S2213-8587(16)30424-7. Epub 2017 Jan 6. Erratum in: Lancet Diabetes Endocrinol. 2017 May;5(5):e3.
- Bray GA, Heisel WE, Afshin A, Jensen MD, Dietz WH, Long M, Kushner RF, Daniels SR, Wadden TA, Tsai AG, Hu FB, Jakicic JM, Ryan DH, Wolfe BM, Inge TH. The Science of Obesity Management: An Endocrine Society Scientific Statement. Endocr Rev. 2018 Apr 1;39(2):79-132. doi: 10.1210/er.2017-00253
- Karmali S, Brar B, Shi X, Sharma AM, de Gara C, Birch DW. Weight recidivism post-bariatric surgery: a systematic review. Obes Surg. 2013; 23(11): 1922-1933.
- Cooper TC, Simmons EB, Webb K, Burns JL, Kushner RF. Trends in weight regain following Roux-en-Y gastric bypass (RYGB) bariatric surgery. Obes Surg. 2015; 25(8): 1474-1481.
- Smith MD, Patterson E, Wahed AS, Belle SH, Bessler M, Courcoulas AP, Flum D, Halpin V, Mitchell JE, Pomp A, Pories WJ, Wolfe B. Relationship between surgeon volume and adverse outcomes after RYGB in Longitudinal Assessment of Bariatric Surgery (LABS) study. Surg Obes Relat Dis. 2010 Mar 4;6(2):118-25. doi: 10.1016/j.soard.2009.09.009. Epub 2009 Sep 26. Erratum in: Surg Obes Relat Dis. 2010 Jul-Aug;6(4):463.
- Puzziferri N, Roshek TB 3rd, Mayo HG, Gallagher R, Belle SH, Livingston EH. Long-term follow-up after bariatric surgery: a systematic review. JAMA. 2014 Sep 3;312(9):934-42. doi: 10.1001/jama.2014.10706
- Wolfe BM, Kvach E, Eckel RH. Treatment of Obesity: Weight Loss and Bariatric Surgery. Circ Res. 2016 May 27;118(11):1844-55. doi: 10.1161/CIRCRESAHA.116.307591
- Gletsu-Miller N, Wright BN. Mineral malnutrition following bariatric surgery. Adv Nutr. 2013 Sep 1;4(5):506-17. doi: 10.3945/an.113.004341
- Mechanick JI, Youdim A, Jones DB, Garvey WT, Hurley DL, McMahon MM, Heinberg LJ, Kushner R, Adams TD, Shikora S, Dixon JB, Brethauer S; American Association of Clinical Endocrinologists; Obesity Society; American Society for Metabolic & Bariatric Surgery. Clinical practice guidelines for the perioperative nutritional, metabolic, and nonsurgical support of the bariatric surgery patient–2013 update: cosponsored by American Association of Clinical Endocrinologists, The Obesity Society, and American Society for Metabolic & Bariatric Surgery. Obesity (Silver Spring). 2013 Mar;21 Suppl 1(0 1):S1-27. doi: 10.1002/oby.20461
- How does the stomach work ? National Center for Biotechnology Information, U.S. National Library of Medicine. https://www.ncbi.nlm.nih.gov/pubmedhealth/PMH0072488/
- Baker RS, Foote J, Kemmeter P, Brady R, Vroegop T, Serveld M. The science of stapling and leaks. Obes Surg. 2004 Nov-Dec;14(10):1290-8. doi: 10.1381/0960892042583888. Erratum in: Obes Surg. 2013 Dec;23(12):2124.
- Demir H, Ozdemir K, Karaman K. Pyogenic liver abscess after laparoscopic sleeve gastrectomy. Pak J Med Sci. 2018 May-Jun;34(3):767-769. doi: 10.12669/pjms.343.14409
- Lalor P. F., Tucker O. N., Szomstein S., Rosenthal R. J. Complications after laparoscopic sleeve gastrectomy. Surgery for Obesity and Related Diseases. 2008;4(1):33–38. doi: 10.1016/j.soard.2007.08.015
- Rached A. A., Basile M., El Masri H. Gastric leaks post sleeve gastrectomy: review of its prevention and management. World Journal of Gastroenterology. 2014;20(38):13904–13910. doi: 10.3748/wjg.v20.i38.13904
- McKenna NP, Habermann EB, Sada A, Kellogg TA, McKenzie TJ. Is Bariatric Surgery Safe and Effective in Patients with Inflammatory Bowel Disease? Obes Surg. 2020 Mar;30(3):882-888. doi: 10.1007/s11695-019-04267-8
- Gadde KM, Martin CK, Berthoud HR, Heymsfield SB. Obesity: Pathophysiology and Management. J Am Coll Cardiol. 2018 Jan 2;71(1):69-84. doi: 10.1016/j.jacc.2017.11.011
- Mechanick, J.I., Apovian, C., Brethauer, et al. Clinical Practice Guidelines for the Perioperative Nutrition, Metabolic, and Nonsurgical Support of Patients Undergoing Bariatric Procedures – 2019 Update: Cosponsored by American Association of Clinical Endocrinologists/American College of Endocrinology, The Obesity Society, American Society for Metabolic and Bariatric Surgery, Obesity Medicine Association, and American Society of Anesthesiologists. Obesity, 28: O1-O58. https://doi.org/10.1002/oby.22719
- Himpens J, Dobbeleir J, Peeters G. Long-term results of laparoscopic sleeve gastrectomy for obesity. Ann Surg. 2010 Aug;252(2):319-24. doi: 10.1097/SLA.0b013e3181e90b31
- Mohos E, Schmaldienst E, Prager M. Quality of life parameters, weight change and improvement of co-morbidities after laparoscopic Roux Y gastric bypass and laparoscopic gastric sleeve resection–comparative study. Obes Surg. 2011 Mar;21(3):288-94. doi: 10.1007/s11695-010-0227-7
- Himpens J, Dapri G, Cadière GB. A prospective randomized study between laparoscopic gastric banding and laparoscopic isolated sleeve gastrectomy: results after 1 and 3 years. Obes Surg. 2006 Nov;16(11):1450-6. doi: 10.1381/096089206778869933
- Franco J. V. A., Ruiz P. A., Palermo M., Gagner M. A review of studies comparing three laparoscopic procedures in bariatric surgery: sleeve gastrectomy, Roux-en-Y gastric bypass and adjustable gastric banding. Obesity Surgery. 2011;21(9):1458–1468. doi: 10.1007/s11695-011-0390-5
- Food tolerance and diet quality following adjustable gastric banding, sleeve gastrectomy and Roux-en-Y gastric bypass. Obes Res Clin Pract. 2014 Mar-Apr;8(2):e115-200. doi: 10.1016/j.orcp.2013.02.002. https://www.obesityresearchclinicalpractice.com/article/S1871-403X(13)00014-8/fulltext
- Chang SH, Stoll CR, Song J, Varela JE, Eagon CJ, Colditz GA. The effectiveness and risks of bariatric surgery: an updated systematic review and meta-analysis, 2003-2012. JAMA Surg. 2014;149(3):275-287.

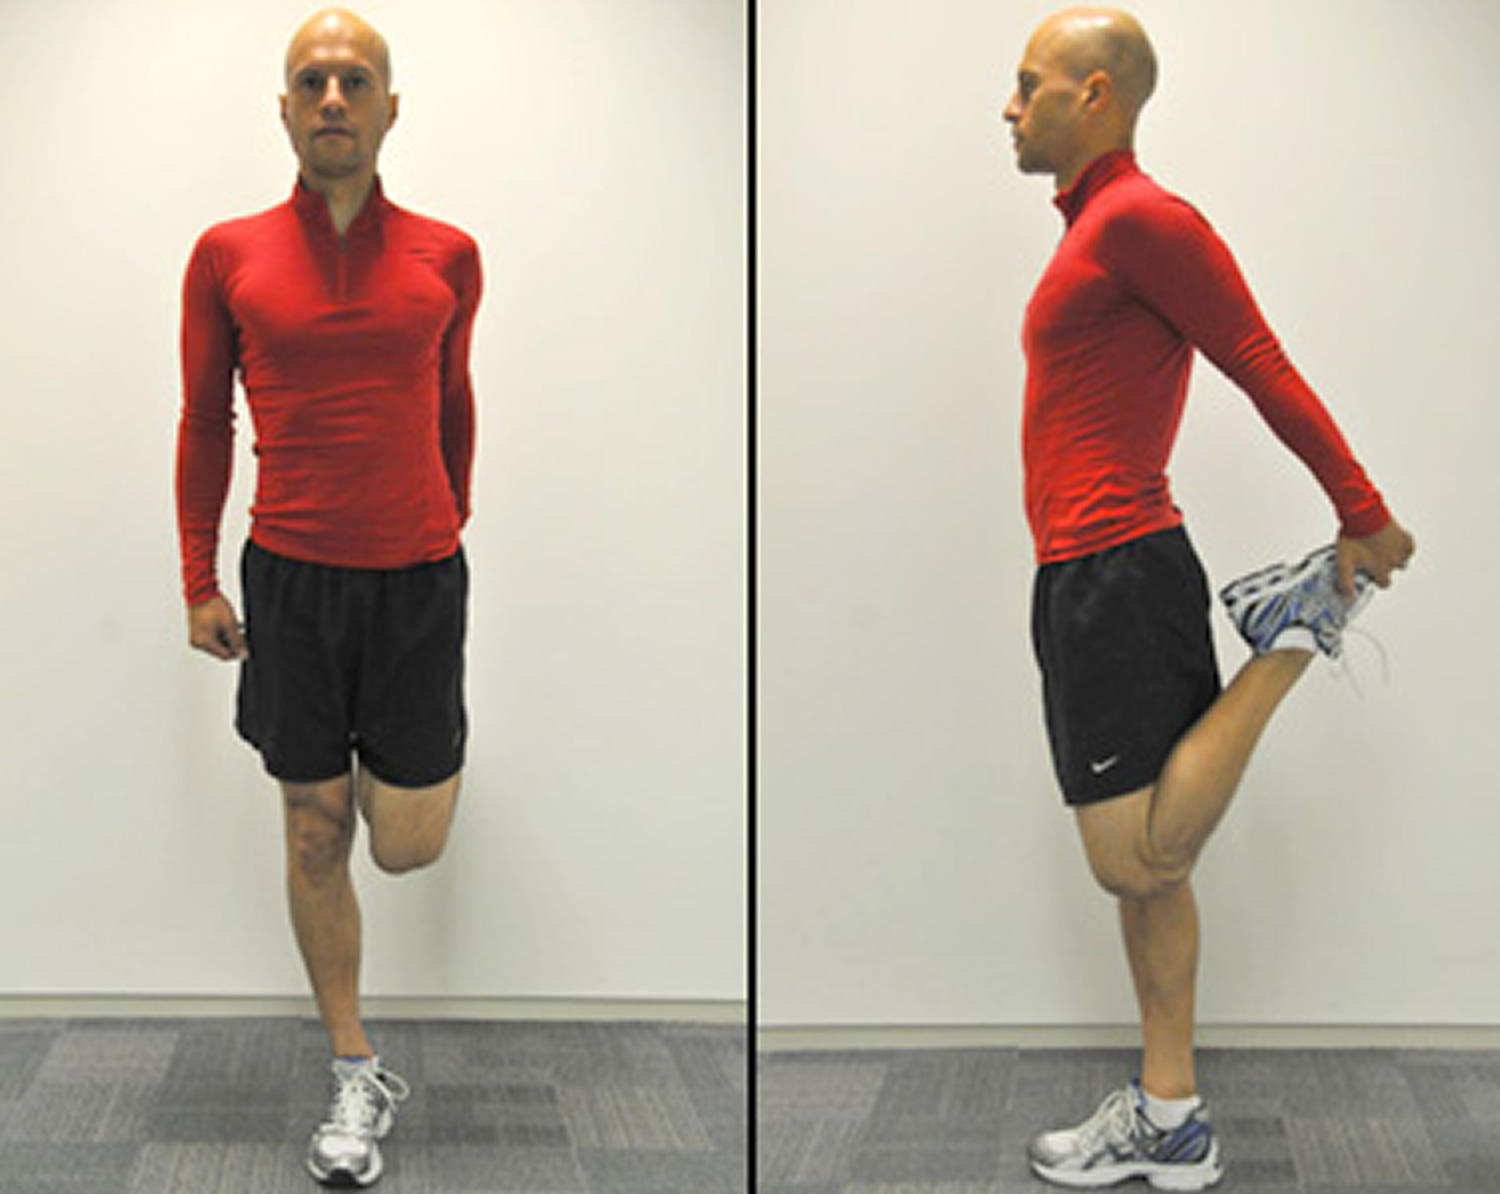


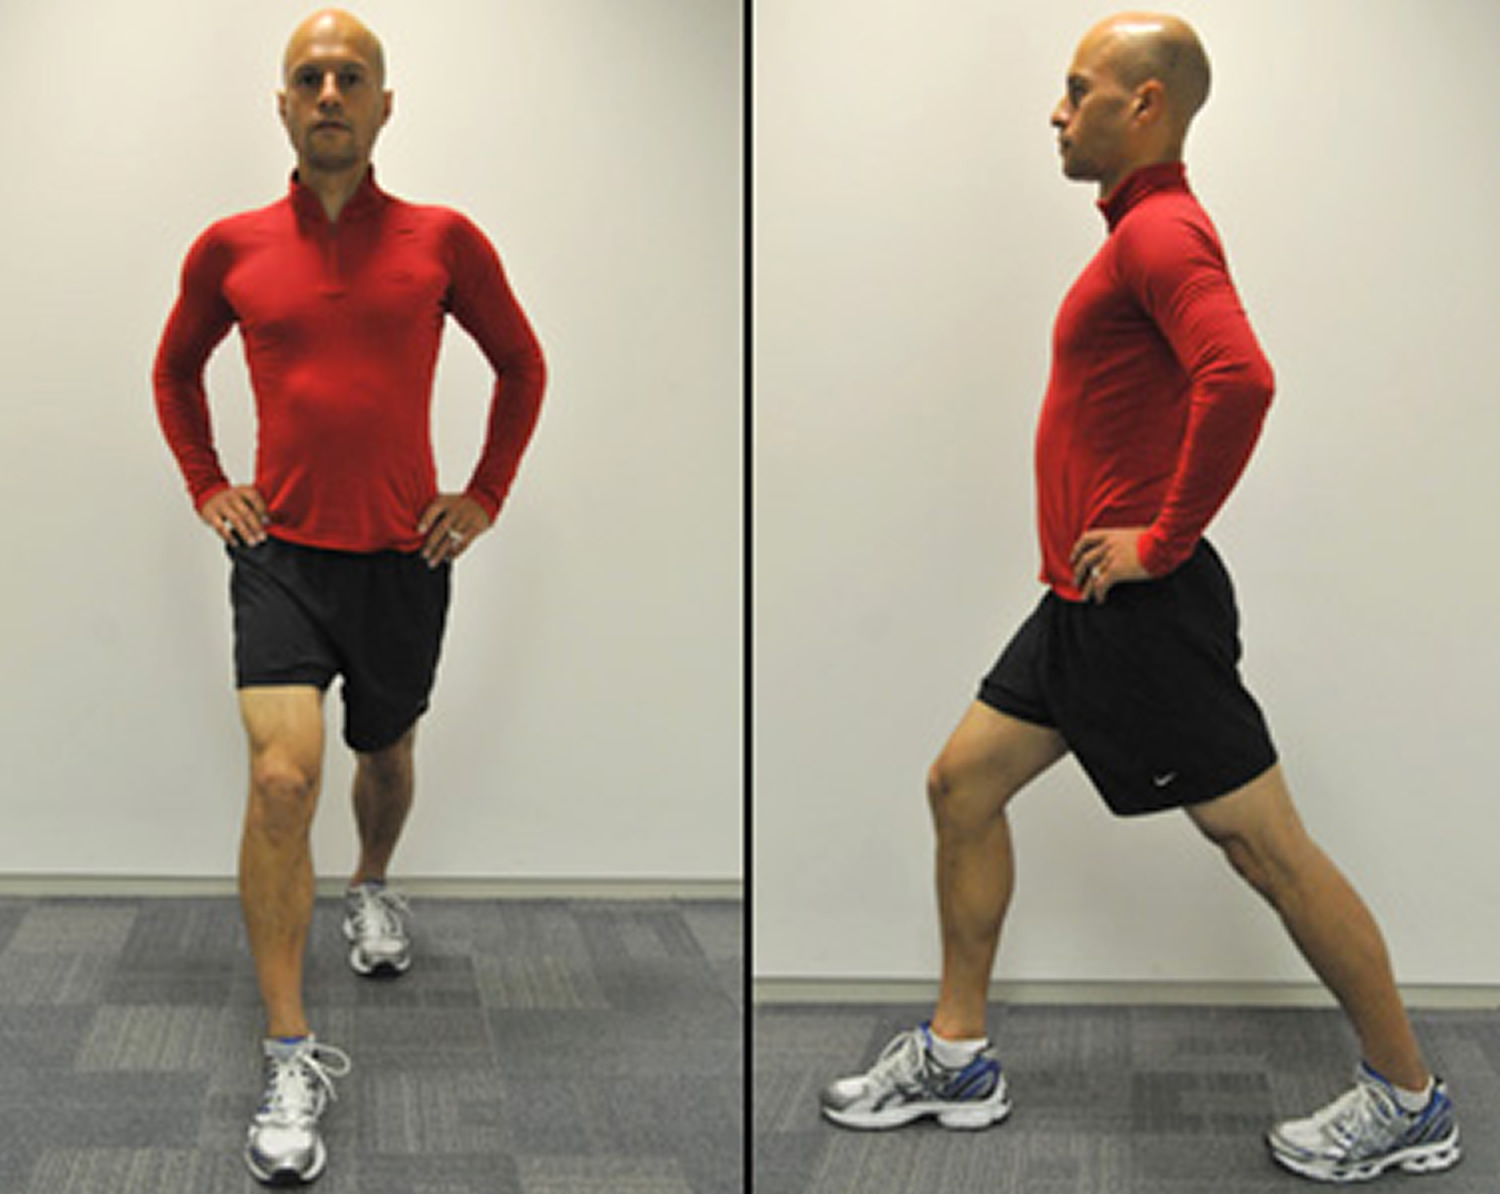
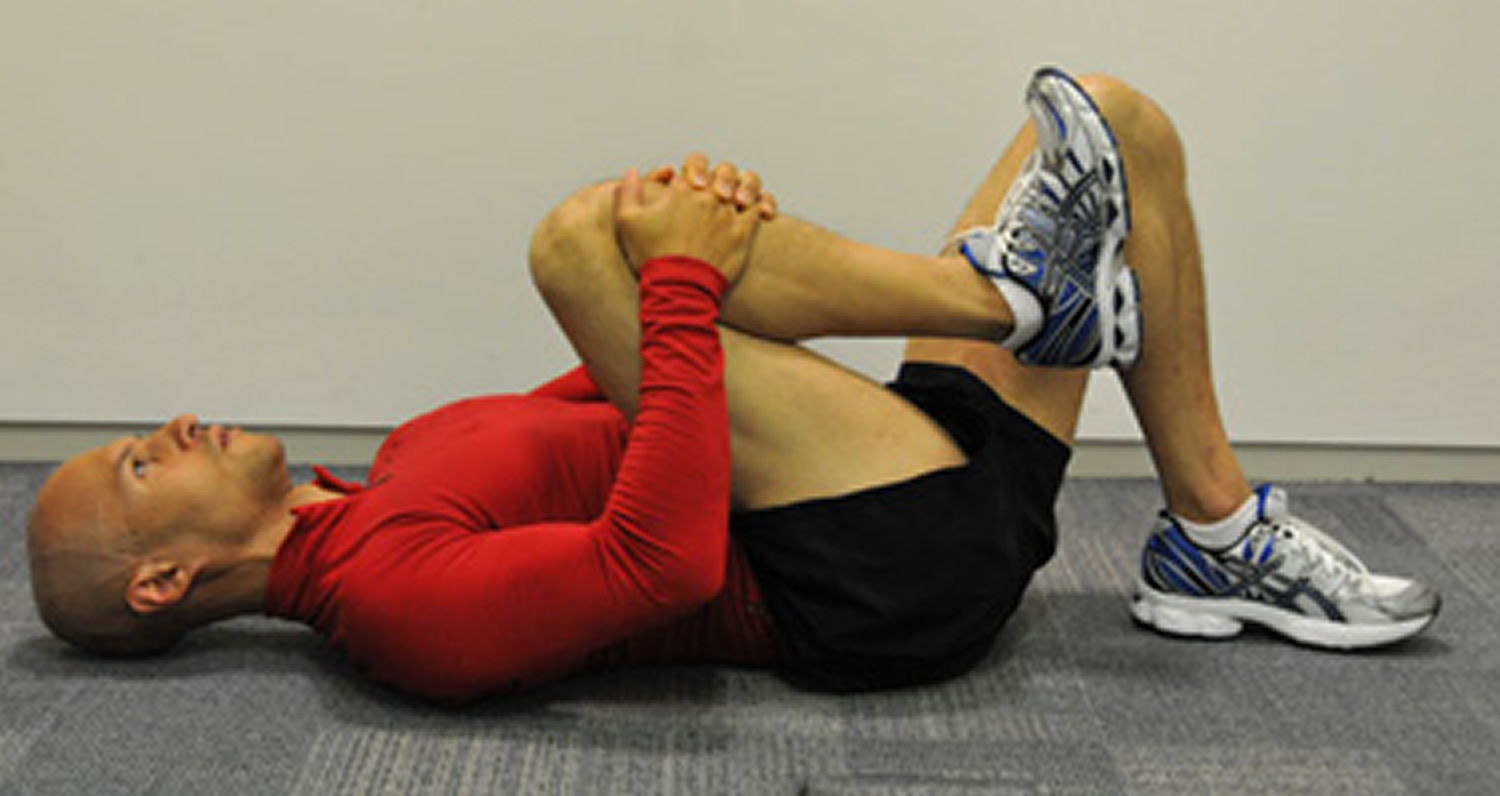
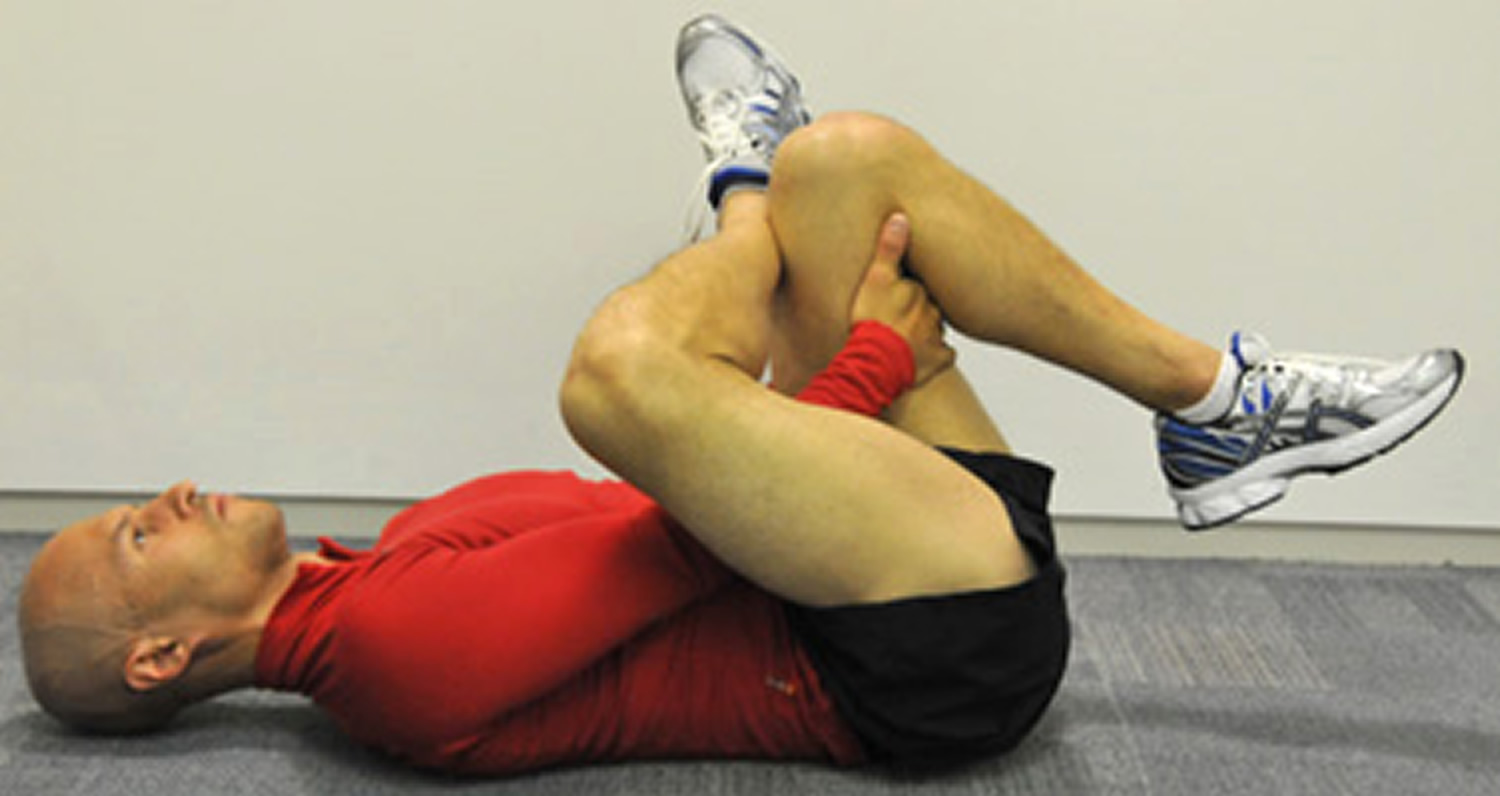


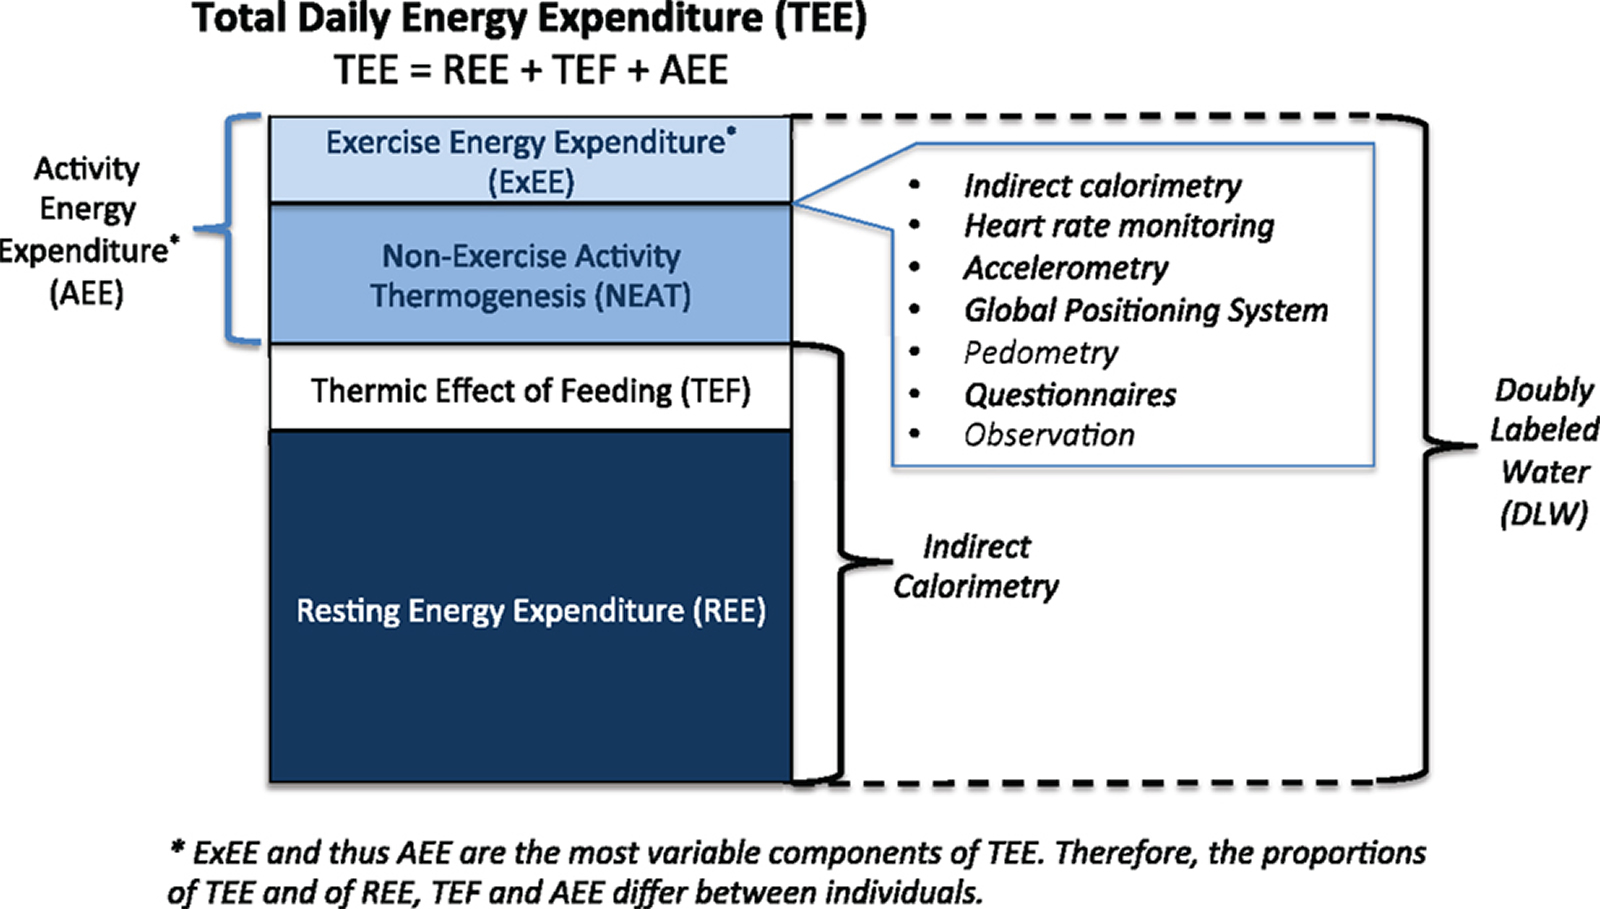
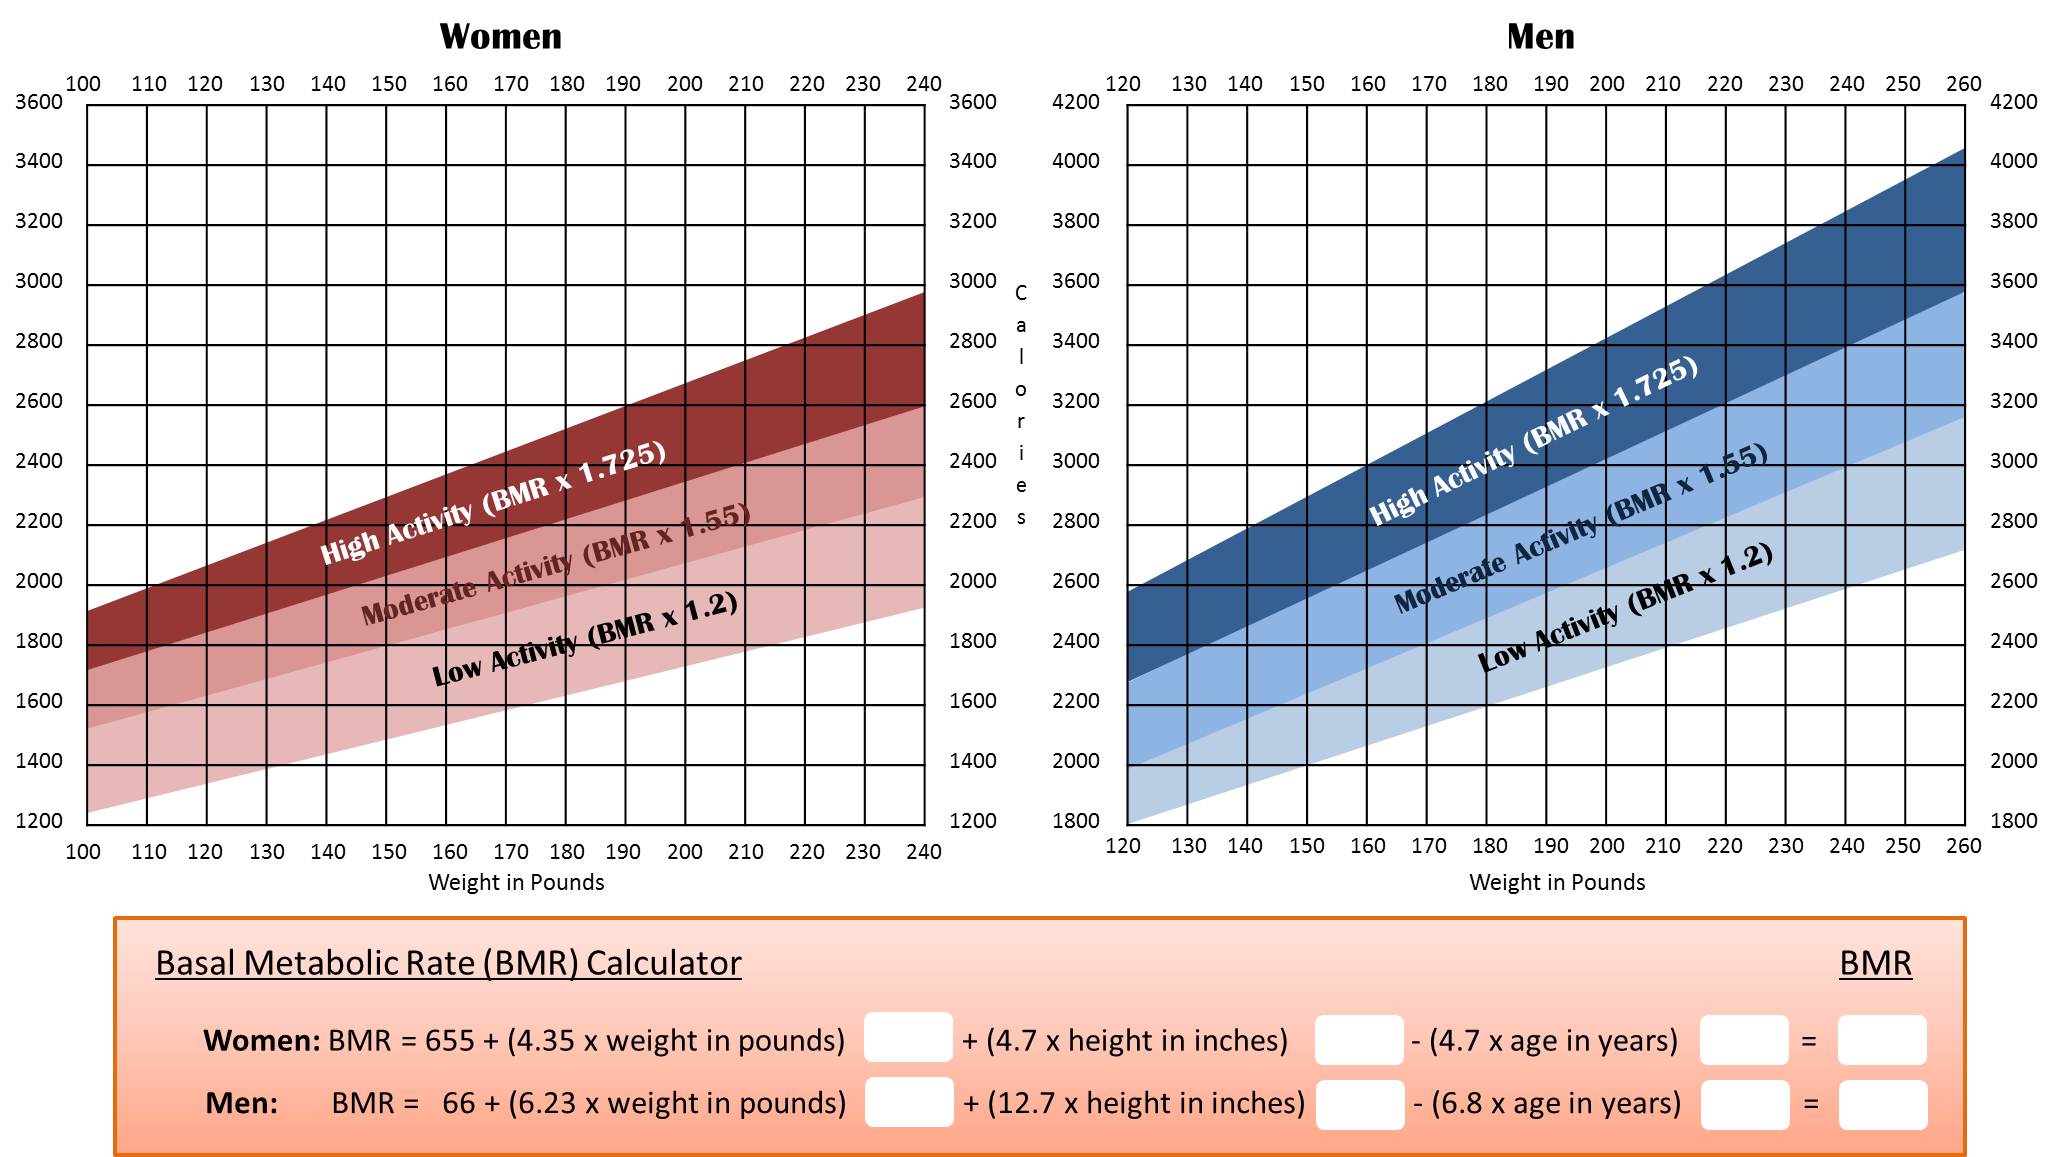


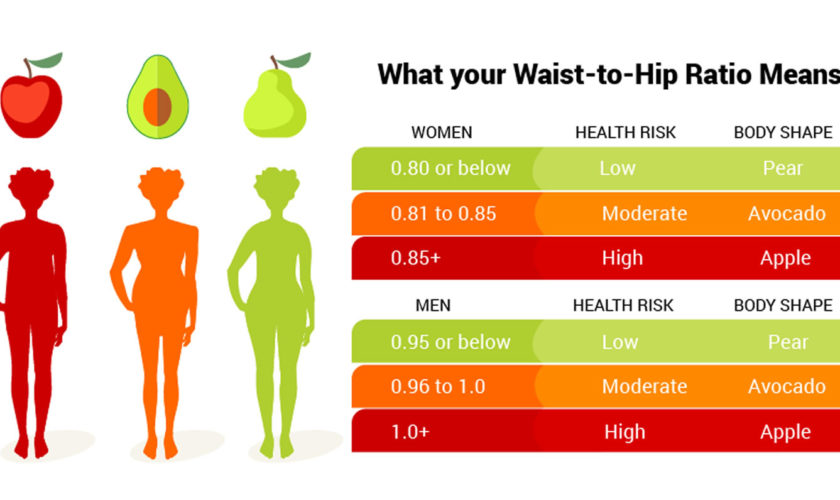
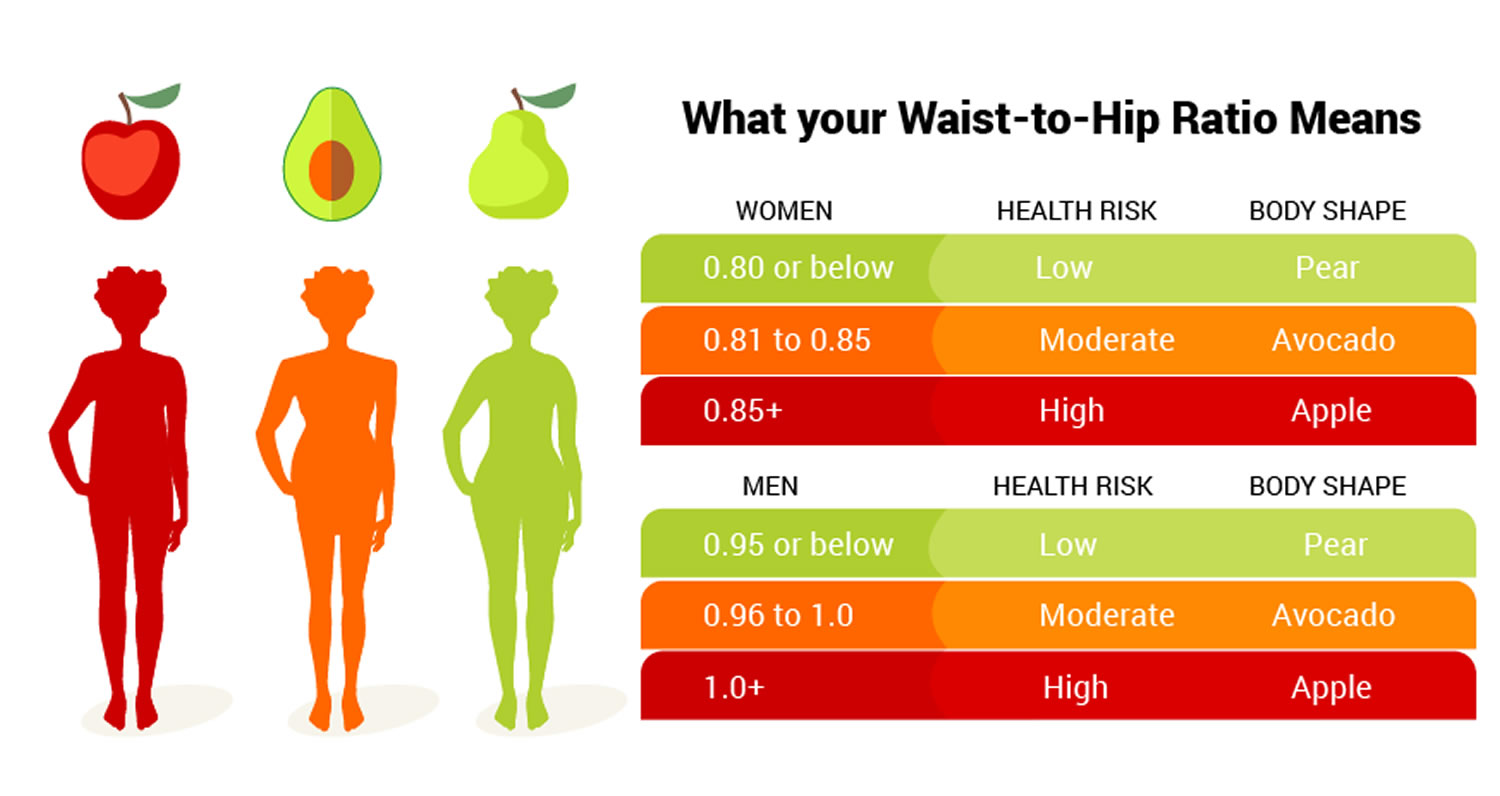
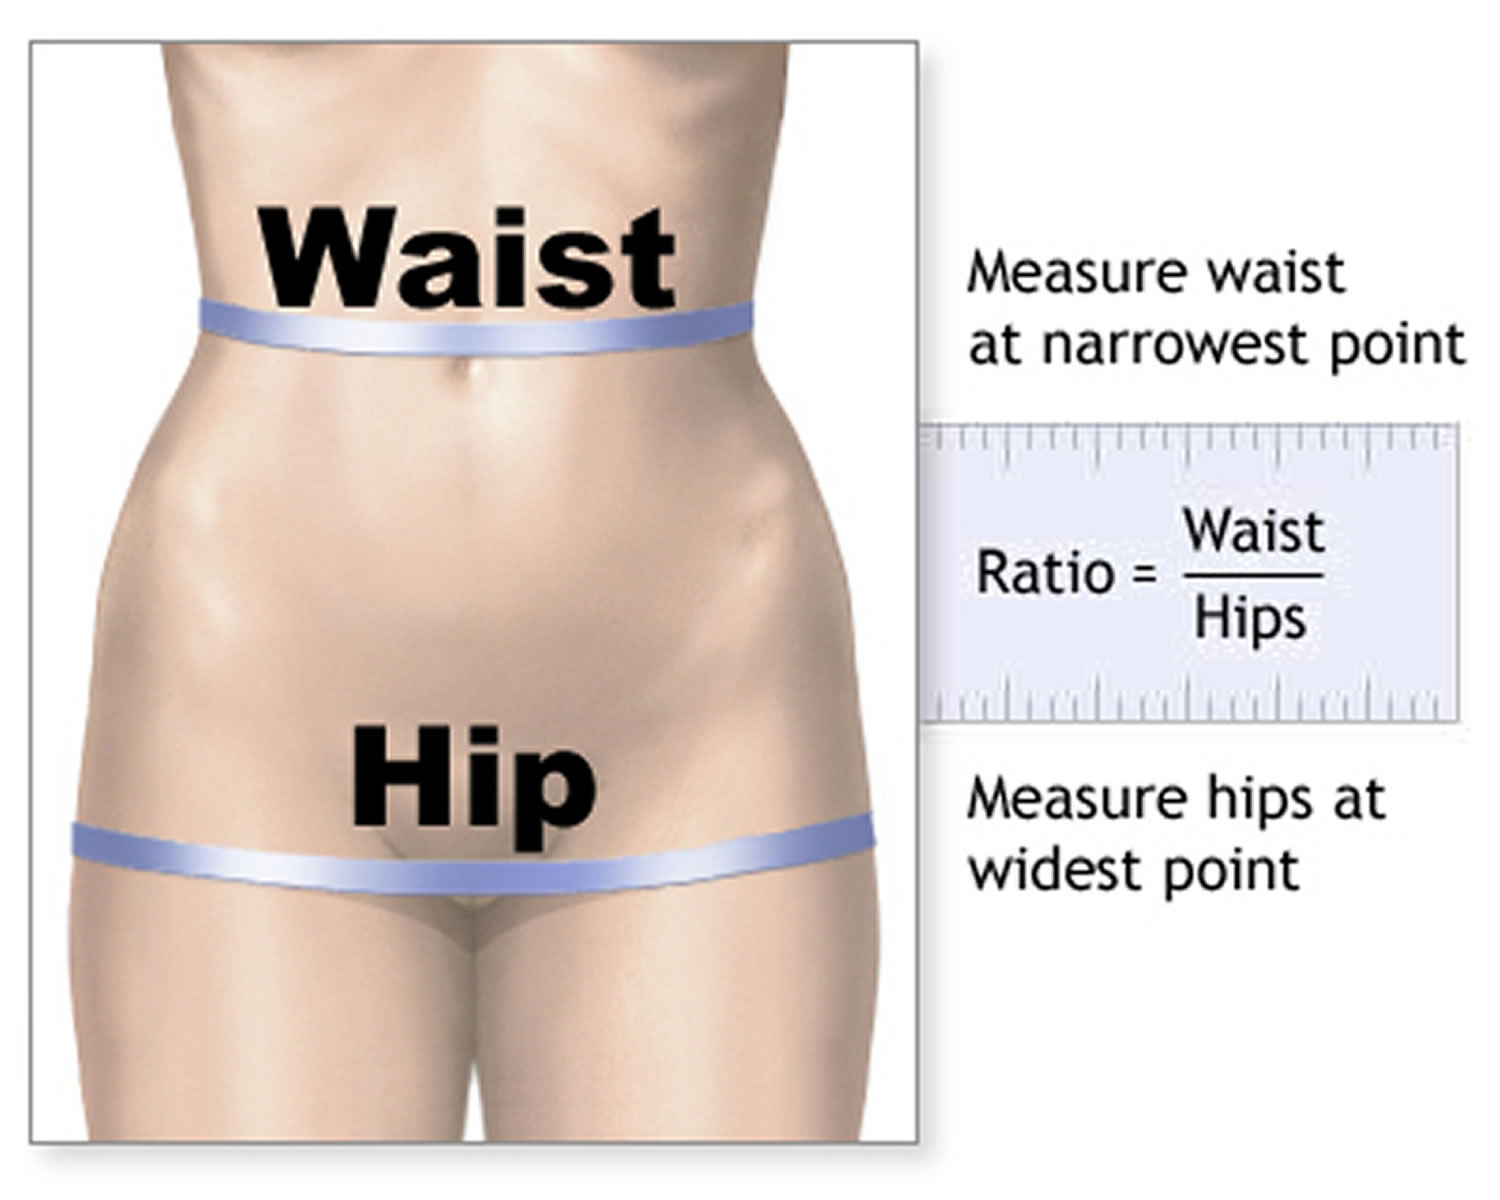
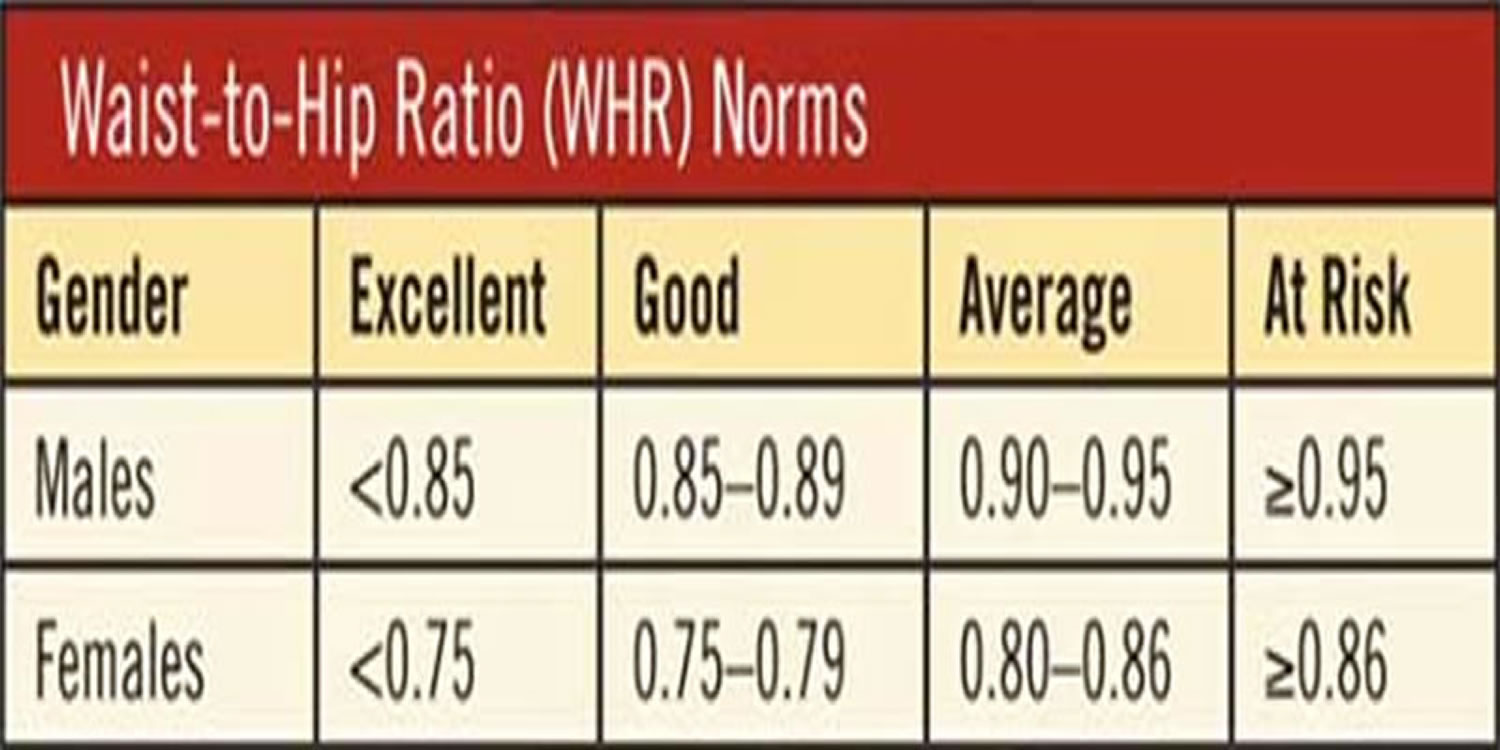

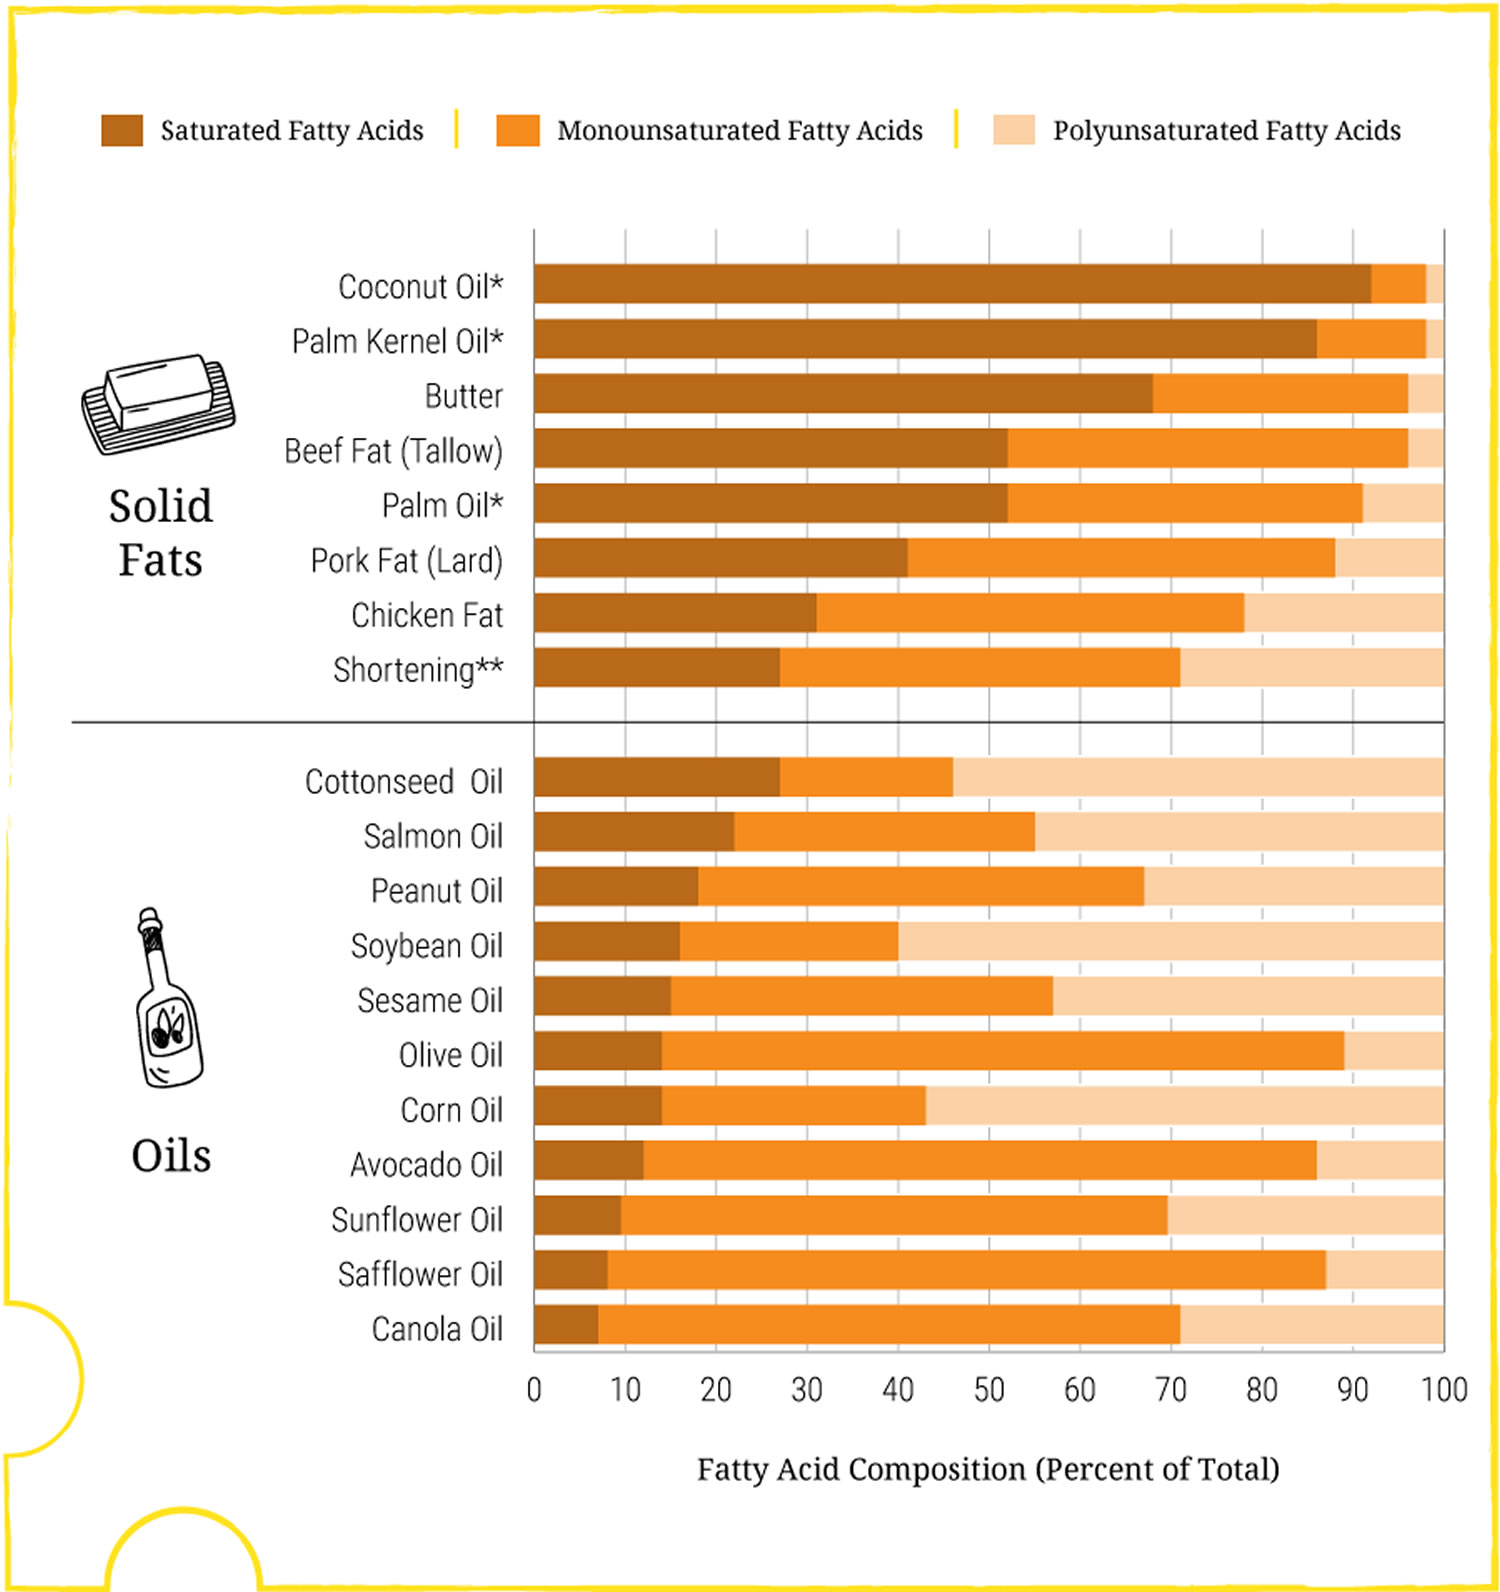
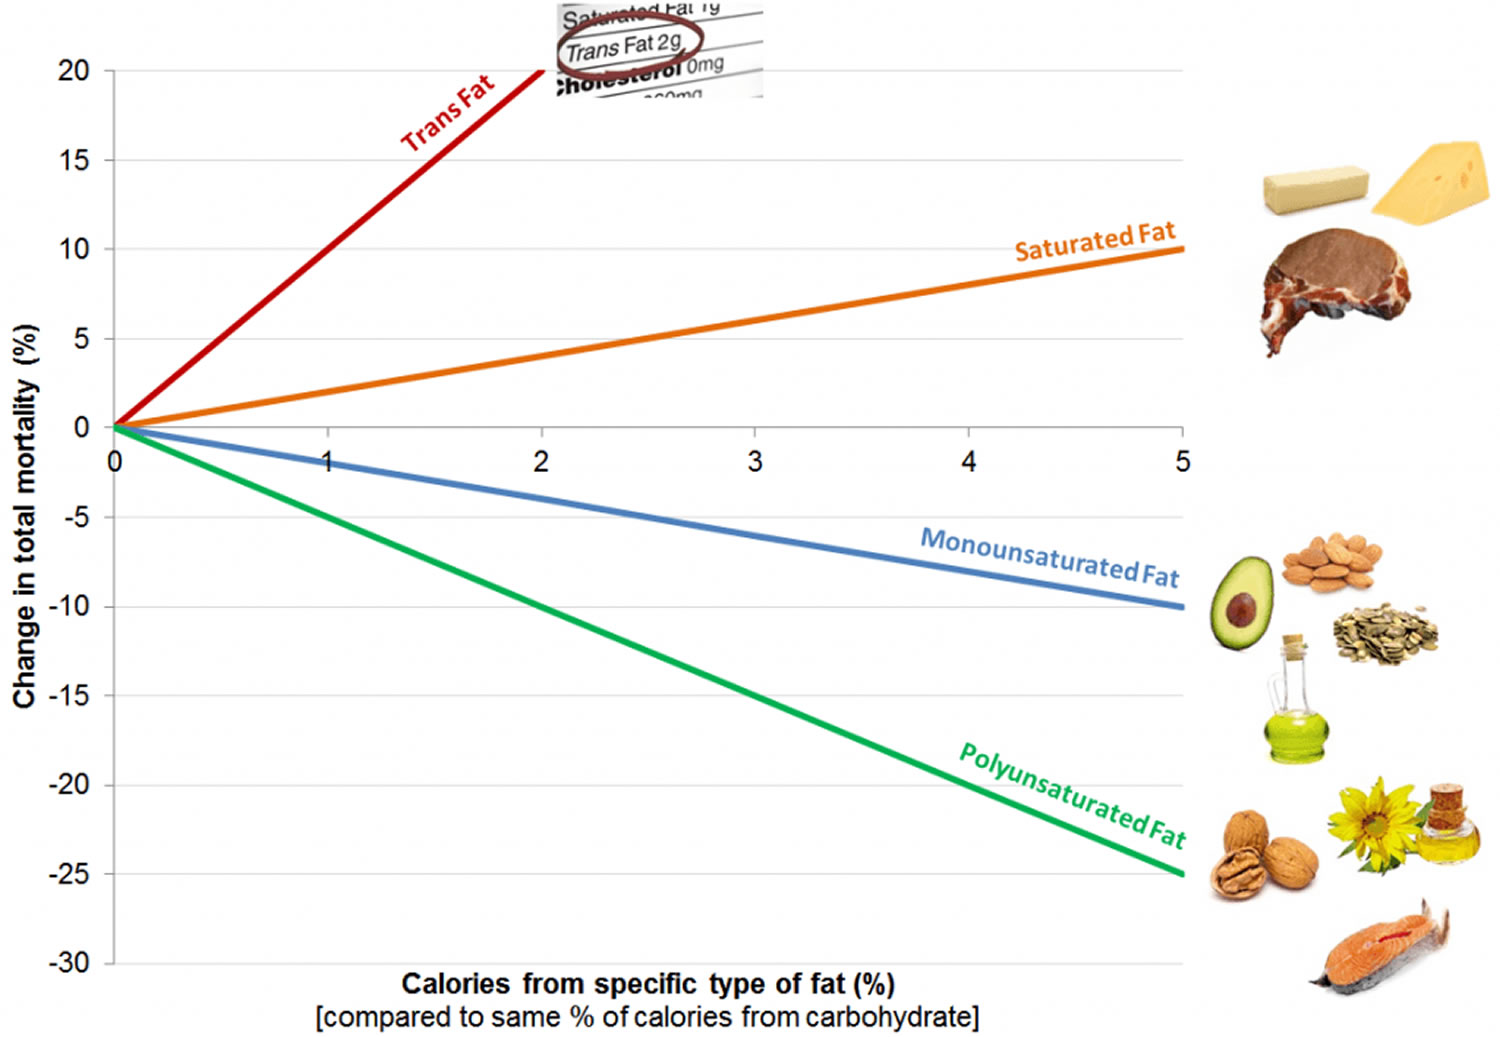
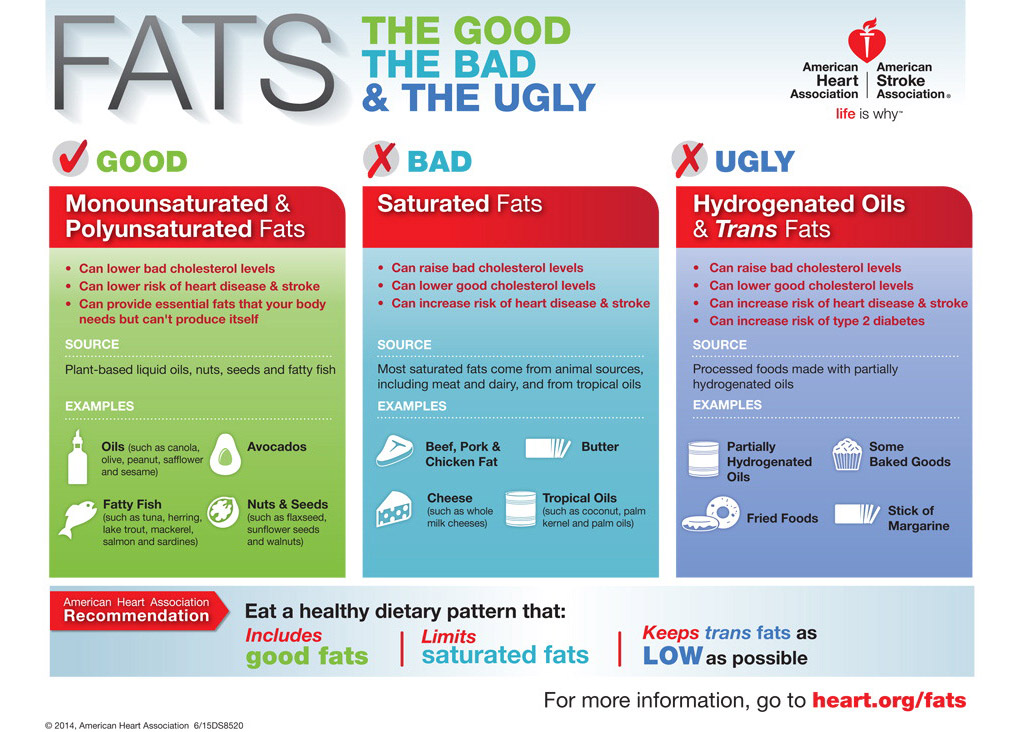
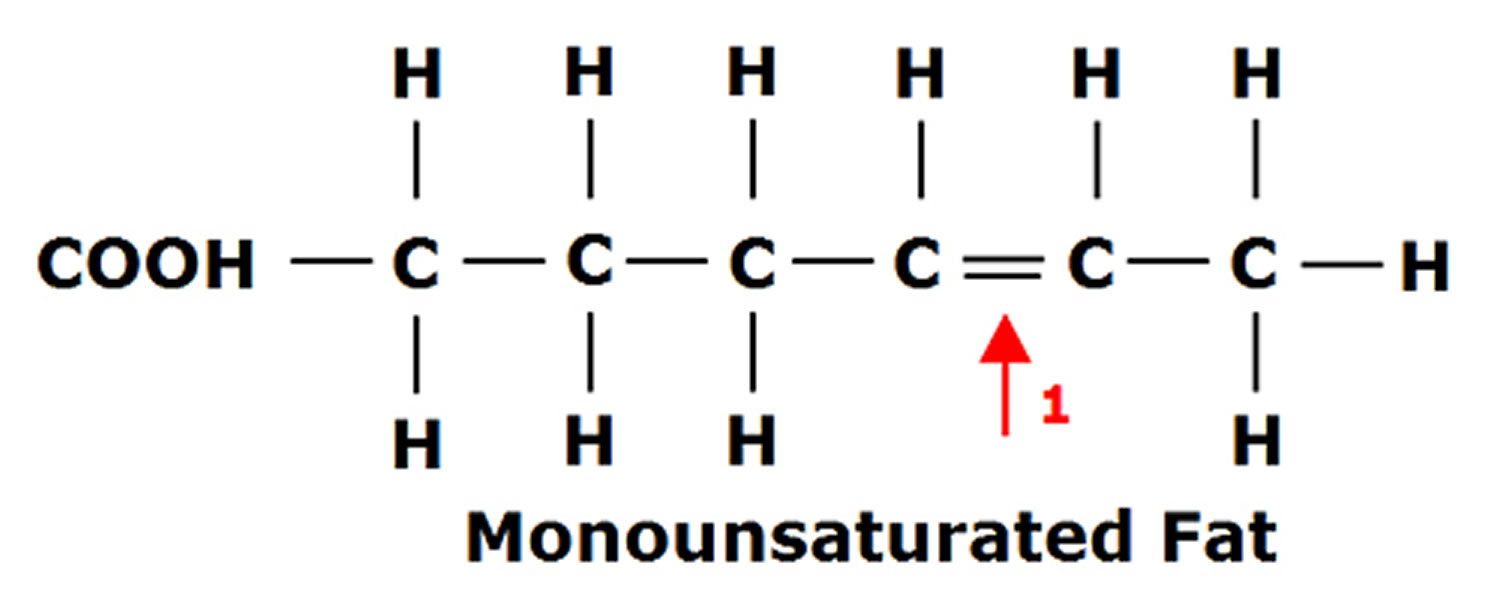
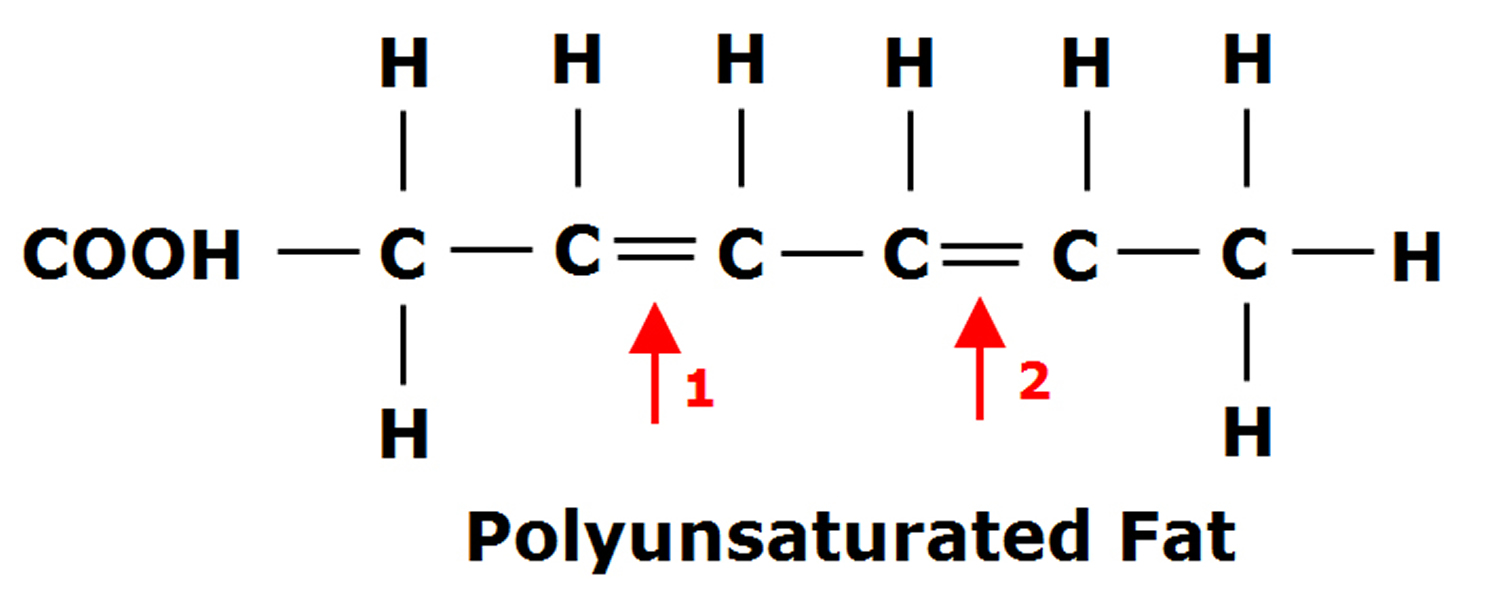
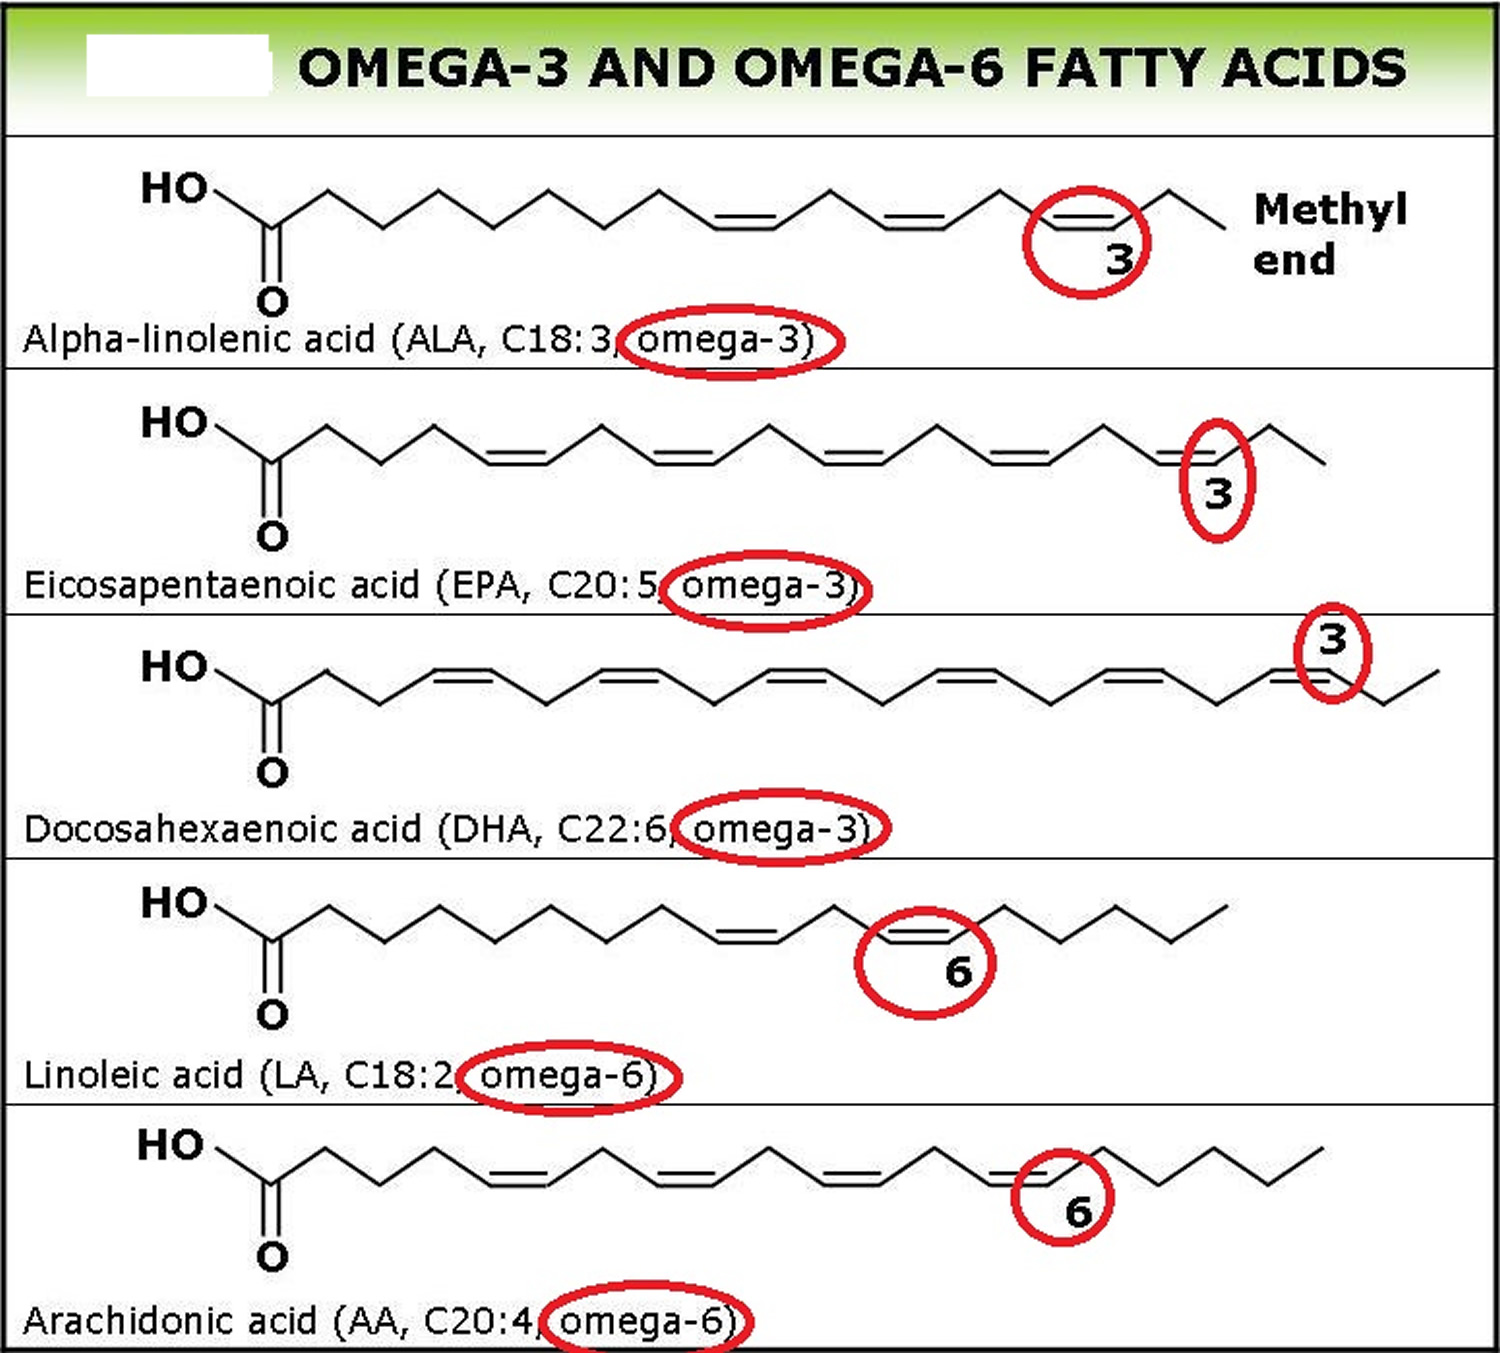