
Normal lab values
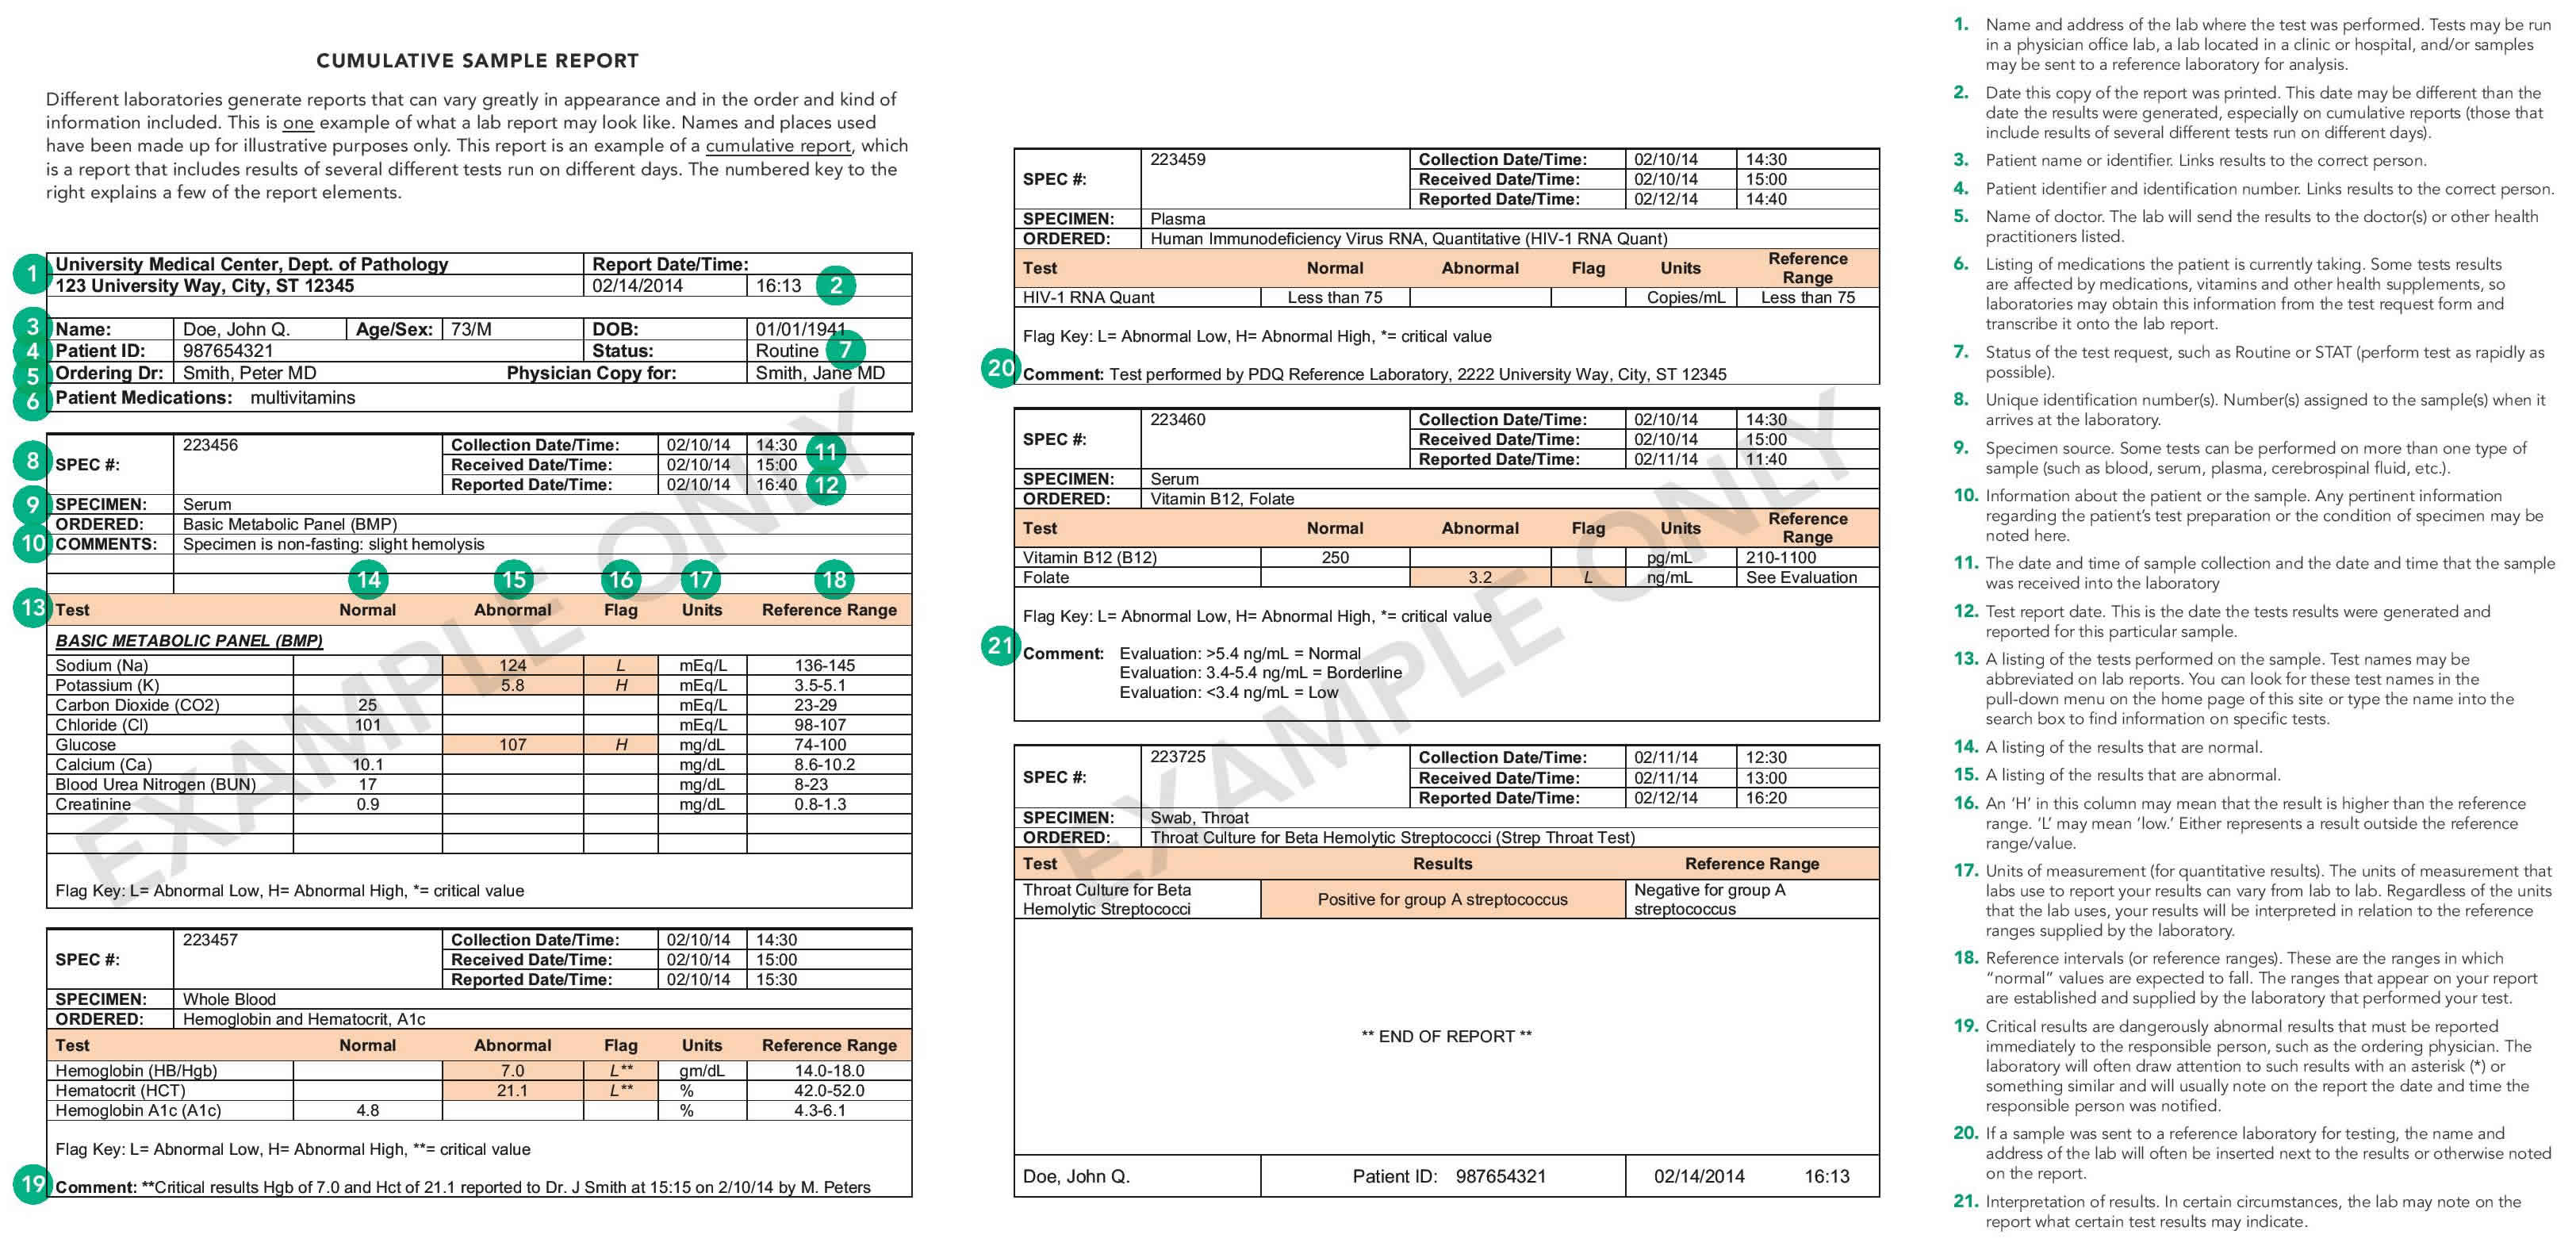
Different laboratories generate reports that can vary greatly in appearance and in the order and kind of information included. Here is one example of what a lab report may look like.
What is a reference range?
A reference range is a set of values that includes upper and lower limits of a lab test based on a group of otherwise healthy people. The values in between those limits may depend on such factors as age, sex, and specimen type (blood, urine, spinal fluid, etc.) and can also be influenced by circumstantial situations such as fasting and exercise. These intervals are thought of as “normal ranges or limits.”
Though the term “reference interval” is usually the term preferred by laboratory and other health professionals, the more commonly-known term is “reference range,” so that is the term used throughout this article.
Reference ranges provide the values to which your healthcare provider compares your test results to and determines your current health status. However, the true meaning of a test result—whether it indicates that you are sick or well or at risk for a health condition—can only be known when all the other information your provider has gathered about your health, including the results of a physical exam, your health and family history, recent changes in your health, any medications you are taking, and other non-laboratory testing.
Most people can now access their lab test results directly via the Internet, but very few lab reports have been designed to convey the meaning of those results in a way people who are not health professionals can understand or put in context. The information provided in this article will help you understand:
Three important things to know about reference ranges:
- A normal result in one lab may be abnormal in another: You must use the range supplied by the laboratory that performed your test to evaluate whether your results are “within normal limits.” While accuracy of laboratory testing has significantly evolved over the past few decades, some lab-to-lab variability can occur due to differences in testing equipment, chemical reagents used, and analysis techniques. Consequently, for most lab tests, there is no universally applicable reference value. This is the reason why so few reference ranges are provided in the test information on this website, Lab Tests Online.
- A normal result does not promise health: While having all test results within normal limits is certainly a good sign, it’s not a guarantee. For many tests, there is a lot of overlap among results from healthy people and those with diseases, so there is still a chance that there could be an undetected problem. Lab test results in some people with disease fall within the reference range, especially in the early stages of a disease.
- An abnormal result does not mean you are sick: A test result outside the reference range may or may not indicate a problem. Since many reference values are based on statistical ranges in healthy people, you may be one of the healthy people outside the statistical range, especially if your value is close to the expected reference range. However, the abnormal value does alert your healthcare provider to a possible problem, especially if your test result is far outside the expected values.
In general, reference ranges for most analytes are specific to the laboratory that performs the test. Different laboratories use different kinds of equipment and different kinds of testing methods for analysis. This means each laboratory must determine its own reference ranges—whether by using data from its own equipment and methods, citing reference ranges from test manufacturers or other laboratories, or by testing a pool of perceived normal and healthy individuals. Consequently, there are no universally standardized reference ranges. Of course, each test does have a theoretical reference range, which can be found in many books and other online sources, but it may have little meaning for you.
You may notice that the few, select reference ranges listed below apply only to adults, and there are no ranges included for children or adolescents. This is because from birth through adolescence, a child’s body goes through many changes, often quite rapidly. Several things that are tested in a laboratory, such as chemical levels, hormones, etc, vary greatly as a child goes through the different stages of growth and development. The laboratory in which your child’s sample is tested has established reference ranges for the different stages of child development. The best source of information regarding your child’s lab test results is your child’s healthcare provider.
CBC values
CBC or complete blood count, is a test that evaluates the cells that circulate in blood. Blood consists of three types of cells suspended in fluid called plasma: white blood cells (WBCs), red blood cells (RBCs), and platelets. They are produced and mature primarily in the bone marrow and, under normal circumstances, are released into the bloodstream as needed. CBC is a screening tool to confirm a hematologic disorder, to establish or rule out a diagnosis, to detect an unsuspected hematologic disorder, or to monitor effects of radiation or chemotherapy.
A CBC is typically performed using an automated instrument that measures various parameters, including counts of the cells that are present in a person’s sample of blood. The results of a CBC can provide information about not only the number of cell types but also can give an indication of the physical characteristics of some of the cells. A standard CBC includes the following:
- Evaluation of white blood cells: WBC count; may or may not include a WBC differential
- Evaluation of red blood cells: RBC count, hemoglobin (Hb), hematocrit (Hct) and RBC indices, which includes mean corpuscular volume (MCV), mean corpuscular hemoglobin (MCH), mean corpuscular hemoglobin concentration (MCHC), and red cell distribution width (RDW). The RBC evaluation may or may not include reticulocyte count.
- Evaluation of platelets: platelet count; may or may not include mean platelet volume (MPV) and/or platelet distribution width (PDW)
Significant abnormalities in one or more of the blood cell populations can indicate the presence of one or more conditions. Typically other tests are performed to help determine the cause of abnormal results. Often, this requires visual confirmation by examining a blood smear under a microscope. A trained laboratorian can evaluate the appearance and physical characteristics of the blood cells, such as size, shape and color, noting any abnormalities that may be present. Any additional information is noted and reported to the healthcare provider. This information gives the health practitioner additional clues as to the cause of abnormal CBC results.
The three types of cells evaluated by the CBC include:
White blood cells
There are five different types of WBCs, also called leukocytes, that the body uses to maintain a healthy state and to fight infections or other causes of injury. They are neutrophils, lymphocytes, basophils, eosinophils, and monocytes. They are present in the blood at relatively stable numbers. These numbers may temporarily shift higher or lower depending on what is going on in the body. For instance, an infection can stimulate the body to produce a higher number of neutrophils to fight off bacterial infection. With allergies, there may be an increased number of eosinophils. An increased number of lymphocytes may be produced with a viral infection. In certain disease states, such as leukemia, abnormal (immature or mature) white cells rapidly multiply, increasing the WBC count.
Red blood cells
Red blood cells (RBCs), also called erythrocytes, are produced in the bone marrow and released into the bloodstream as they mature. They contain hemoglobin, a protein that transports oxygen throughout the body. The typical lifespan of an RBC is 120 days; thus the bone marrow must continually produce new RBCs to replace those that age and disintegrate or are lost through bleeding. A number of conditions can affect the production of new RBCs and/or their lifespan, in addition to those conditions that may result in significant bleeding.
The CBC determines the number of RBCs and amount of hemoglobin present, the proportion of blood made up of RBCs (hematocrit), and whether the population of RBCs appears to be normal. RBCs normally are uniform with minimal variations in size and shape; however, significant variations can occur with conditions such as vitamin B12 and folate deficiencies, iron deficiency, and with a variety of other conditions. If the concentration of red blood cells and/or the amount of hemoglobin in the blood drops below normal, a person is said to have anemia and may have symptoms such as fatigue and weakness. Much less frequently, there may be too many RBCs in the blood (erythrocytosis or polycythemia). In extreme cases, this can interfere with the flow of blood through the small veins and arteries.
Platelets
Platelets, also called thrombocytes, are special cell fragments that play an important role in normal blood clotting. A person who does not have enough platelets may be at an increased risk of excessive bleeding and bruising. An excess of platelets can cause excessive clotting or, if the platelets are not functioning properly, excessive bleeding. The CBC measures the number and size of platelets present.
Red blood cell count normal range
Males:
- 0-14 days: 4.10-5.55 x 10¹²/L
- 15 days-4 weeks: 3.16-4.63 x 10¹²/L
- 5 weeks-7 weeks: 3.02-4.22 x 10¹²/L
- 8 weeks-5 months: 3.43-4.80 x 10¹²/L
- 6 months-23 months: 4.03-5.07 x 10¹²/L
- 24 months-35 months: 3.89-4.97 x 10¹²/L
- 3-5 years: 4.00-5.10 x 10¹²/L
- 6-10 years: 4.10-5.20 x 10¹²/L
- 11-14 years: 4.20-5.30 x 10¹²/L
- 15-17 years: 4.30-5.70 x 10¹²/L
- Adults: 4.35-5.65 x 10¹²/L
Females:
- 0-14 days: 4.12-5.74 x 10¹²/L
- 15 days-4 weeks: 3.32-4.80 x 10¹²/L
- 5 weeks-7 weeks: 2.93-3.87 x 10¹²/L
- 8 weeks-5 months: 3.45-4.75 x 10¹²/L
- 6 months-23 months: 3.97-5.01 x 10¹²/L
- 24 months-35 months: 3.84-4.92 x 10¹²/L
- 3-5 years: 4.00-5.10 x 10¹²/L
- 6-10 years: 4.10-5.20 x 10¹²/L
- 11-14 years: 4.10-5.10 x 10¹²/L
- 15-17 years: 3.80-5.00 x 10¹²/L
- Adults: 3.92-5.13 x 10¹²/L
Hemoglogin
Males:
- 0-14 days: 13.9-19.1 g/dL
- 15 days-4 weeks: 10.0-15.3 g/dL
- 5 weeks-7 weeks: 8.9-12.7 g/dL
- 8 weeks-5 months: 9.6-12.4 g/dL
- 6 months-23 months: 10.1-12.5 g/dL
- 24 months-35 months: 10.2-12.7 g/dL
- 3-5 years: 11.4-14.3 g/dL
- 6-8 years: 11.5-14.3 g/dL
- 9-10 years: 11.8-14.7 g/dL
- 11-14 years: 12.4-15.7 g/dL
- 15-17 years: 13.3-16.9 g/dL
- Adults: 13.2-16.6 g/dL
Females:
- 0-14 days: 13.4-20.0 g/dL
- 15 days-4 weeks: 10.8-14.6 g/dL
- 5 weeks-7 weeks: 9.2-11.4 g/dL
- 8 weeks-5 months: 9.9-12.4 g/dL
- 6 months-35 months: 10.2-12.7 g/dL
- 3-5 years: 11.4-14.3 g/dL
- 6-8 years: 11.5-14.3 g/dL
- 9-10 years: 11.8-14.7 g/dL
- 11-17 years: 11.9-14.8 g/dL
- Adults: 11.6-15.0 g/dL
Hematocrit
Males:
- 0-14 days: 39.8-53.6%
- 15 days-4 weeks: 30.5-45.0%
- 5 weeks-7 weeks: 26.8-37.5%
- 8 weeks-5 months: 28.6-37.2%
- 6 months-23 months: 30.8-37.8%
- 24 months-35 months: 31.0-37.7%
- 3-7 years: 34-42%
- 8-11 years: 35-43%
- 12-15 years: 38-47%
- 16-17 years: 40-50%
- Adults: 38.3-48.6%
Females:
- 0-14 days: 39.6-57.2%
- 15 days-4 weeks: 32.0-44.5%
- 5 weeks-7 weeks: 27.7-35.1%
- 8 weeks-5 months: 29.5-37.1%
- 6 months-23 months: 30.9-37.9%
- 24 months-35 months: 31.2-37.8%
- 3-7 years: 34-42%
- 8-17 years: 35-43%
- Adults: 35.5-44.9%
Mean corpuscular volume (MCV)
Males:
- 0-14 days: 91.3-103.1 fL
- 15 days-4 weeks: 89.4-99.7 fL
- 5 weeks-7 weeks: 84.3-94.2 fL
- 8 weeks-5 months: 74.1-87.5 fL
- 6 months-23 months: 69.5-81.7 fL
- 24 months-35 months: 71.3-84.0 fL
- 3-5 years: 77.2-89.5 fL
- 6-11 years: 77.8-91.1 fL
- 12-14 years: 79.9-93.0 fL
- 15-17 years: 82.5-98.0 fL
- Adults: 78.2-97.9 fL
Females:
- 0-14 days: 92.7-106.4 fL
- 15 days-4 weeks: 90.1-103.0 fL
- 5 weeks-7 weeks: 83.4-96.4 fL
- 8 weeks-5 months: 74.8-88.3 fL
- 6 months-23 months: 71.3-82.6 fL
- 24 months-35 months: 72.3-85.0 fL
- 3-5 years: 77.2-89.5 fL
- 6-11 years: 77.8-91.1 fL
- 12-14 years: 79.9-93.0 fL
- 15-17 years: 82.5-98.0 fL
- Adults: 78.2-97.9 3 fL
Red cell distribution width (RDW)
Males:
- 0-14 days: 14.8-17.0%
- 15 days-4 weeks: 14.3-16.8%
- 5 weeks-7 weeks: 13.8-16.1%
- 8 weeks-5 months: 12.4-15.3%
- 6 months-23 months: 12.9-15.6%
- 24 months-35 months: 12.5-14.9%
- 3-5 years: 11.3-13.4%
- 6-17 years: 11.4-13.5%
- Adults: 11.8-14.5%
Females:
- 0-14 days: 14.6-17.3%
- 15 days-4 weeks: 14.4-16.2%
- 5 weeks-7 weeks: 13.6-15.8%
- 8 weeks-5 months: 12.2-14.3%
- 6 months-23 months: 12.7-15.1%
- 24 months-35 months: 12.4-14.9%
- 3-5 years: 11.3-13.4%
- 6-17 years: 11.4-13.5%
- Adults: 12.2-16.1%
White blood cell count count normal range
Males:
- 0-14 days: 8.0-15.4 x 10⁹/L
- 15 days-4 weeks: 7.8-15.9 x 10⁹/L
- 5 weeks-7 weeks: 8.1-15.0 x 10⁹/L
- 8 weeks-5 months: 6.5-13.3 x 10⁹/L
- 6 months-23 months: 6.0-13.5 x 10⁹/L
- 24 months-35 months: 5.1-13.4 x 10⁹/L
- 3-5 years: 4.4-12.9 x 10⁹/L
- 6-17 years: 3.8-10.4 x 10⁹/L
- Adults: 3.4-9.6 x 10⁹/L
Females:
- 0-14 days: 8.2-14.6 x 10⁹/L
- 15 days-4 weeks: 8.4-14.4 x 10⁹/L
- 5 weeks-7 weeks: 7.1-14.7 x 10⁹/L
- 8 weeks-5 months: 6.0-13.3 x 10⁹/L
- 6 months-23 months: 6.5-13.0 x 10⁹/L
- 24 months-35 months: 4.9-13.2 x 10⁹/L
- 3-5 years: 4.4-12.9 x 10⁹/L
- 6-17 years: 3.8-10.4 x 10⁹/L
- Adults: 3.4-9.6 x 10⁹/L
Platelets
Males:
- 0-14 days: 218-419 x 109/L
- 15 days-4 weeks: 248-586 x 109/L
- 5 weeks-7 weeks: 229-562 x 109/L
- 8 weeks-5 months: 244-529 x 109/L
- 6 months-23 months: 206-445 x 109/L
- 24 months-35 months: 202-403 x 109/L
- 3-5 years: 187-445 x 109/L
- 6-9 years: 187-400 x 109/L
- 10-13 years: 177-381 x 109/L
- 14-17 years: 139-320 x 109/L
- Adults: 135-317 x 109/L
Females:
- 0-14 days: 144-449 x 109/L
- 15 days-4 weeks: 279-571 x 109/L
- 5 weeks-7 weeks: 331-597 x 109/L
- 8 weeks-5 months: 247-580 x 109/L
- 6 months-23 months: 214-459 x 109/L
- 24 months-35 months: 189-394 x 109/L
- 3-5 years: 187-445 x 109/L
- 6-9 years: 187-400 x 109/L
- 10-13 years: 177-381 x 109/L
- 14-17 years: 158-362 x 109/L
- Adults: 157-371 x 109/L
Neutrophils
Males:
- 0-14 days: 1.60-6.06 x 10⁹/L
- 15 days-4 weeks: 1.18-5.45 x 10⁹/L
- 5 weeks-7 weeks: 0.83-4.23 x 10⁹/L
- 8 weeks-5 months: 0.97-5.45 x 10⁹/L
- 6 months-23 months: 1.19-7.21 x 10⁹/L
- 24 months-35 months: 1.54-7.92 x 10⁹/L
- 3-5 years: 1.60-7.80 x 10⁹/L
- 6-16 years: 1.40-6.10 x 10⁹/L
- 17 years: 1.80-7.20 x 10⁹/L
- Adults: 1.56-6.45 x 10⁹/L
Females:
- 0-14 days: 1.73-6.75 x 10⁹/L
- 15 days-4 weeks: 1.23-4.80 x 10⁹/L
- 5 weeks-7 weeks: 1.00-4.68 x 10⁹/L
- 8 weeks-5 months: 1.04-7.20 x 10⁹/L
- 6 months-23 months: 1.27-7.18 x 10⁹/L
- 24 months-35 months: 1.60-8.29 x 10⁹/L
- 3-5 years: 1.60-7.80 x 10⁹/L
- 6-14 years: 1.50-6.50 x 10⁹/L
- 15-17 years: 2.00-7.40 x 10⁹/L
- Adults: 1.56-6.45 x 10⁹/L
Lymphocytes
Males:
- 0-14 days: 2.07-7.53 x 10⁹/L
- 15 days-4 weeks: 2.11-8.38 x 10⁹/L
- 5 weeks-7 weeks: 2.47-7.95 x 10⁹/L
- 8 weeks-5 months: 2.45-8.89 x 10⁹/L
- 6 months-23 months: 1.56-7.83 x 10⁹/L
- 24 months-35 months: 1.13-5.52 x 10⁹/L
- 3-5 years: 1.60-5.30 x 10⁹/L
- 6-11 years: 1.40-3.90 x 10⁹/L
- 12-17 years: 1.00-3.20 x 10⁹/L
- Adults: 0.95-3.07 x 10⁹/L
Females:
- 0-14 days: 1.75-8.00 x 10⁹/L
- 15 days-4 weeks: 2.42-8.20 x 10⁹/L
- 5 weeks-7 weeks: 2.29-9.14 x 10⁹/L
- 8 weeks-5 months: 2.14-8.99 x 10⁹/L
- 6 months-23 months: 1.52-8.09 x 10⁹/L
- 24 months-35 months: 1.25-5.77 x 10⁹/L
- 3-5 years: 1.60-5.30 x 10⁹/L
- 6-11 years: 1.40-3.90 x 10⁹/L
- 12-17 years: 1.00-3.20 x 10⁹/L
- Adults: 0.95-3.07 x 10⁹/L
Monocytes
Males:
- 0-14 days: 0.52-1.77 x 10⁹/L
- 15 days-4 weeks: 0.28-1.38 x 10⁹/L
- 5 weeks-7 weeks: 0.28-1.05 x 10⁹/L
- 8 weeks-5 months: 0.28-1.07 x 10⁹/L
- 6 months-23 months: 0.25-1.15 x 10⁹/L
- 24 months-35 months: 0.19-0.94 x 10⁹/L
- 3-5 years: 0.30-0.90 x 10⁹/L
- 6-17 years: 0.20-0.80 x 10⁹/L
- Adults: 0.26-0.81 x 10⁹/L
Females:
- 0-14 days: 0.57-1.72 x 10⁹/L
- 15 days-4 weeks: 0.42-1.21 x 10⁹/L
- 5 weeks-7 weeks: 0.28-1.21 x 10⁹/L
- 8 weeks-5 months: 0.24-1.17 x 10⁹/L
- 6 months-23 months: 0.26-1.08 x 10⁹/L
- 24 months-35 months: 0.24-0.92 x 10⁹/L
- 3-5 years: 0.30-0.90 x 10⁹/L
- 6-17 years: 0.20-0.80 x 10⁹/L
- Adults: 0.26-0.81 x 10⁹/L
Eosinophils
Males:
- 0-14 days: 0.12-0.66 x 10⁹/L
- 15 days-4 weeks: 0.08-0.80 x 10⁹/L
- 5 weeks-7 weeks: 0.05-0.57 x 10⁹/L
- 8 weeks-5 months: 0.03-0.61 x 10⁹/L
- 6 months-23 months: 0.02-0.82 x 10⁹/L
- 24 months-35 months: 0.03-0.53 x 10⁹/L
- 3-11 years: 0.00-0.50 x 10⁹/L
- 12-17 years: 0.10-0.20 x 10⁹/L
- Adults: 0.03-0.48 x 10⁹/L
Females:
- 0-14 days: 0.09-0.64 x 10⁹/L
- 15 days-4 weeks: 0.06-0.75 x 10⁹/L
- 5 weeks-7 weeks: 0.04-0.63 x 10⁹/L
- 8 weeks-5 months: 0.02-0.74 x 10⁹/L
- 6 months-23 months: 0.02-0.58 x 10⁹/L
- 24 months-35 months: 0.03-0.46 x 10⁹/L
- 3-11 years: 0.00-0.50 x 10⁹/L
- 12-17 years: 0.10-0.20 x 10⁹/L
- Adults: 0.03-0.48 x 10⁹/L
Basophils
Males:
- 0-14 days: 0.02-0.11 x 10⁹/L
- 15 days-7 weeks: 0.01-0.07 x 10⁹/L
- 8 weeks-35 months: 0.01-0.06 x 10⁹/L
- 3-17 years: 0.00-0.10 x 10⁹/L
- Adults: 0.01-0.08 x 10⁹/L
Females:
- 0-14 days: 0.02-0.07 x 10⁹/L
- 15 days-4 weeks: 0.01-0.06 x 10⁹/L
- 5 weeks-7 weeks: 0.01-0.05 x 10⁹/L
- 8 weeks-5 months: 0.01-0.07 x 10⁹/L
- 6 months-35 months: 0.01-0.06 x 10⁹/L
- 3-17 years: 0.00-0.10 x 10⁹/L
- Adults: 0.01-0.08 x 10⁹/L
Comprehensive metabolic panel normal values
The comprehensive metabolic panel (CMP) is a frequently ordered panel of 14 tests that gives a healthcare provider important information about the current status of a person’s metabolism, including the health of the kidneys and liver, electrolyte and acid/base balance as well as levels of blood glucose and blood proteins. Abnormal results, and especially combinations of abnormal results, can indicate a problem that needs to be addressed.
The comprehensive metabolic panel includes the following tests:
- Glucose – energy source for the body; a steady supply must be available for use, and a relatively constant level of glucose must be maintained in the blood.
- Calcium – one of the most important minerals in the body; it is essential for the proper functioning of muscles, nerves, and the heart and is required in blood clotting and in the formation of bones.
- Proteins
- Albumin – a small protein produced in the liver; the major protein in serum
- Total protein – measures albumin as well as all other proteins in serum
- Electrolytes
- Sodium – vital to normal body processes, including nerve and muscle function
- Potassium – vital to cell metabolism and muscle function
- CO2 (carbon dioxide, bicarbonate) – helps to maintain the body’s acid-base balance (pH)
- Chloride – helps to regulate the amount of fluid in the body and maintain the acid-base balance
- Kidney tests
- BUN (blood urea nitrogen) – waste product filtered out of the blood by the kidneys; conditions that affect the kidney have the potential to affect the amount of urea in the blood.
- Creatinine – waste product produced in the muscles; it is filtered out of the blood by the kidneys so blood levels are a good indication of how well the kidneys are working.
- Liver tests
- ALP (alkaline phosphatase) – enzyme found in the liver and other tissues, bone; elevated levels of ALP in the blood are most commonly caused by liver disease or bone disorders.
- ALT (alanine amino transferase, also called SGPT) – enzyme found mostly in the cells of the liver and kidney; a useful test for detecting liver damage
- AST (aspartate amino transferase, also called SGOT) – enzyme found especially in cells in the heart and liver; also a useful test for detecting liver damage
- Bilirubin – waste product produced by the liver as it breaks down and recycles aged red blood cells
Normal sodium level in blood
Sodium is an electrolyte present in all body fluids and is vital to normal body function, including nerve and muscle function. Sodium test measures the level of sodium in the blood and/or urine in order to assess your body’s acid-base balance, water balance, water intoxication, and dehydration.
Sodium, along with other electrolytes such as potassium, chloride, and bicarbonate (or total CO2), helps cells function normally and helps regulate the amount of fluid in the body. While sodium is present in all body fluids, it is found in the highest concentration in the blood and in the fluid outside of the body’s cells. This extracellular sodium, as well as all body water, is regulated by the kidneys.
Sodium is the primary extracellular cation. Sodium is responsible for almost one-half the osmolality of the plasma and, therefore, plays a central role in maintaining the normal distribution of water and the osmotic pressure in the extracellular fluid compartment. The amount of sodium in the body is a reflection of the balance between sodium intake and output.
You get sodium in your diet, from table salt (sodium chloride or NaCl), and to some degree from most of the foods that you eat. Most people have an adequate intake of sodium. The body uses what it requires and the kidneys eliminate the rest in the urine. The body tries to keep the blood sodium within a very narrow concentration range. It does this by:
- Producing hormones that can increase (natriuretic peptides) or decrease (aldosterone) the amount of sodium eliminated in urine
- Producing a hormone that prevents water losses (antidiuretic hormone, ADH, sometimes called vasopressin)
- Controlling thirst; even a 1% increase in blood sodium will make a person thirsty and cause that person to drink water, returning the sodium level to normal.
Sodium normal lab values
- <1 year: not established
- > or =1 year: 135-145 mmol/L
Abnormal blood sodium is usually due to some problem with one of these systems. When the level of sodium in the blood changes, the water content in the body also changes. These changes can be associated with too little fluid (dehydration) or with too much fluid (edema), often resulting in swelling in the legs.
Hyponatremia (low sodium) is a predictable consequence of decreased intake of sodium, particularly that precipitated or complicated by unusual losses of sodium from the gastrointestinal tract (eg, vomiting and diarrhea), kidneys, or sweat glands. Renal loss may be caused by inappropriate choice, dose, or use of diuretics; by primary or secondary deficiency of aldosterone and other mineralocorticoids; or by severe polyuria. It is common in metabolic acidosis. Hyponatremia also occurs in nephrotic syndrome, hypoproteinemia, primary and secondary adrenocortical insufficiency, and congestive heart failure. Symptoms of hyponatremia are a result of brain swelling and range from weakness to seizures, coma, and death.
Hypernatremia (high sodium) is often attributable to excessive loss of sodium-poor body fluids. Hypernatremia is often associated with hypercalcemia and hypokalemia and is seen in liver disease, cardiac failure, pregnancy, burns, and osmotic diuresis. Other causes include decreased production of antidiuretic hormone (ADH; also known as vasopressin) or decreased tubular sensitivity to the hormone (ie, diabetes insipidus), inappropriate forms of parenteral therapy with saline solutions, or high salt intake without corresponding intake of water. Hypernatremia occurs in dehydration, increased renal sodium conservation in hyperaldosteronism, Cushing syndrome, and diabetic acidosis. Severe hypernatremia may be associated with volume contraction, lactic acidosis, and increased hematocrit. Symptoms of hypernatremia range from thirst to confusion, irritability, seizures, coma, and death.
Calcium lab values
Calcium is the fifth most common element in your body and one of the most important minerals in your body. Calcium is a fundamental element necessary to form electrical gradients across membranes, an essential cofactor for many enzymes, and the main constituent in bone. Calcium is essential for cell signaling and the proper functioning of muscles, nerves, and the heart. Calcium is needed for blood clotting and is crucial for the formation, density, and maintenance of bones and teeth. Calcium test measures the amount of calcium in your blood or urine, which reflects the amount of total and ionized calcium in your body.
About 99% of calcium is found complexed in the bones, while the remaining 1% circulates in the blood. Calcium levels are tightly controlled; if there is too little absorbed or ingested, or if there is excess loss through the kidney or gut, calcium is taken from bone to maintain blood concentrations. Ordinarily about 20% to 25% of dietary calcium is absorbed and 98% of filtered calcium is reabsorbed in the kidney. Traffic of calcium between the gastrointestinal tract, bone, and kidney is tightly controlled by a complex regulatory system that includes vitamin D and parathyroid hormone. Sufficient bioavailable calcium is essential for bone health. Excessive excretion of calcium in the urine is a common contributor to kidney stone risk.
Roughly half of the calcium in the blood is “free” and is metabolically active. The remaining half is “bound” to proteins, primarily albumin and to a lesser extend globulins, with a smaller amount complexed to anions, such as phosphate, and these bound and complexed forms are metabolically inactive.
There are two tests to measure blood calcium. The total calcium test measures both the free and bound forms. The ionized calcium test measures only the free, metabolically active form. Ionized calcium, which accounts for 50% to 55% of total calcium, is the physiologically active form of calcium. Low ionized calcium values are often seen in renal disease, critically ill patients, or patients receiving rapid transfusion of citrated whole blood or blood products.
Increased serum ionized calcium concentrations may be seen with primary hyperparathyroidism, ectopic parathyroid hormone-producing tumors, excess intake of vitamin D, or various malignancies.
Nomograms have been used to calculate ionized calcium from total calcium, albumin, and pH values. However, calculated ionized calcium results have proven to be unsatisfactory. A Mayoclinic study of 114 patients found significant differences between ionized and total calcium in 26% of patients.
Some calcium is lost from the body every day, filtered from the blood by the kidneys and excreted into the urine and sweat. Measurement of the amount of calcium in the urine is used to determine how much calcium the kidneys are eliminating.
Serum ionized calcium concentrations 50% below normal will result in severely reduced cardiac stroke work. With moderate to severe hypocalcemia, left ventricular function may be profoundly depressed.
Ionized calcium values are higher in children and young adults.
Ionized calcium result has been adjusted to pH 7.40 to account for changes in specimen pH that may occur during transport. Ionized calcium concentration increases approximately 0.2 mg/dL per 0.1 pH unit decrease.
Calcium normal lab values
Ionized calcium
- < or =13 days old: not established
- 14 days-<1 year: 5.21-5.99 mg/dL
- 1-<2 years: 5.04-5.84 mg/dL
- 2-<3 years: 4.87-5.67 mg/dL
- 3-<24 years: 4.83-5.52 mg/dL
- 24-< or =97 years: 4.57-5.43 mg/dL
- > or =98 years: not established
pH
- < or =13 days old: not established
- 14 days-97 years old: 7.35-7.48
- > or =98 years old: not established.

