Heart rate variability
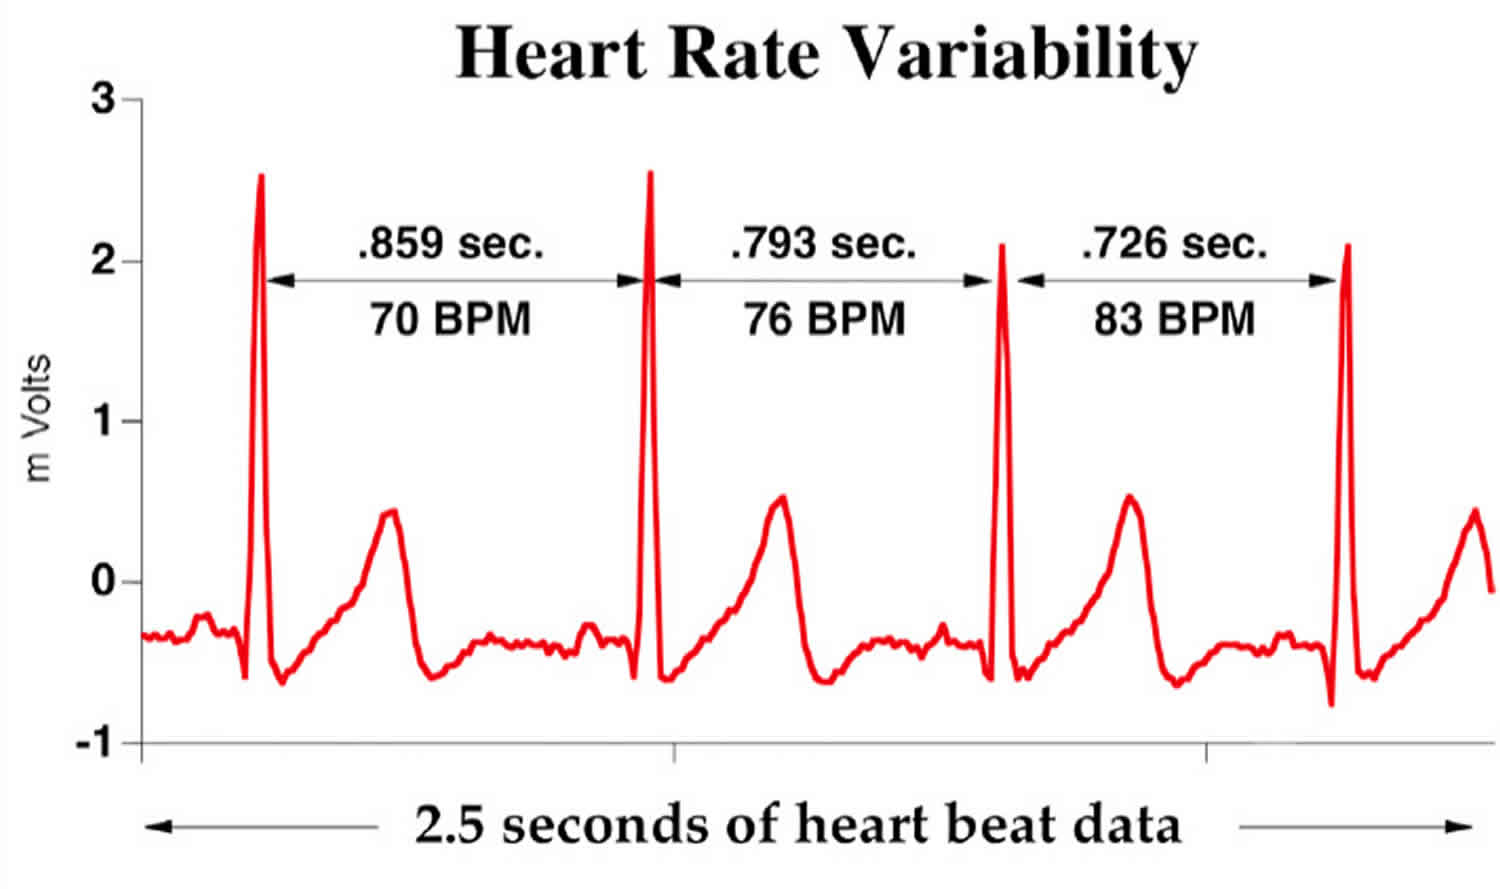
Heart rate variability (HRV) consists of changes in the time intervals between consecutive heartbeats called interbeat intervals (IBIs) 1. A healthy heart is not a metronome. The oscillations of a healthy heart are complex and constantly changing, which allow the cardiovascular system to rapidly adjust to sudden physical and psychological challenges to homeostasis 2. A healthy heart’s beat-to-beat fluctuations are best described by mathematical chaos 3.
Heart rate variability indexes neurocardiac function and is generated by heart-brain interactions and dynamic non-linear autonomic nervous system (ANS) processes 1. Heart rate variability is an emergent property of interdependent regulatory systems which operate on different time scales to help you adapt to environmental and psychological challenges. Heart rate variability reflects regulation of autonomic balance, blood pressure (BP), gas exchange, gut, heart, and vascular tone, which refers to the diameter of the blood vessels that regulate blood pressure, and possibly facial muscles 4.
An optimal level of heart rate variability within an organism reflects healthy function and an inherent self-regulatory capacity, adaptability, or resilience 5. Too much instability, such as arrhythmias or nervous system chaos, is detrimental to efficient physiological functioning and energy utilization 6. However, too little variation indicates age-related system depletion, chronic stress, pathology, or inadequate functioning in various levels of self-regulatory control systems 7.
Higher heart rate variability is not always better since pathological conditions can produce heart rate variability. When cardiac conduction abnormalities elevate heart rate variability measurements, this is strongly linked to increased risk of mortality (particularly among the elderly). Close examination of electrocardiogram (ECG) morphology can reveal whether elevated heart rate variability values are due to problems like atrial fibrillation 8.
An optimal level of heart rate variability is associated with health and self-regulatory capacity, and adaptability or resilience. Higher levels of resting vagally-mediated heart rate variability are linked to performance of executive functions like attention and emotional processing by the prefrontal cortex 9. Afferent information processing by the intrinsic cardiac nervous system can modulate frontocortical activity and impact higher-level functions.
Figure 1. Electrocardiogram (ECG)

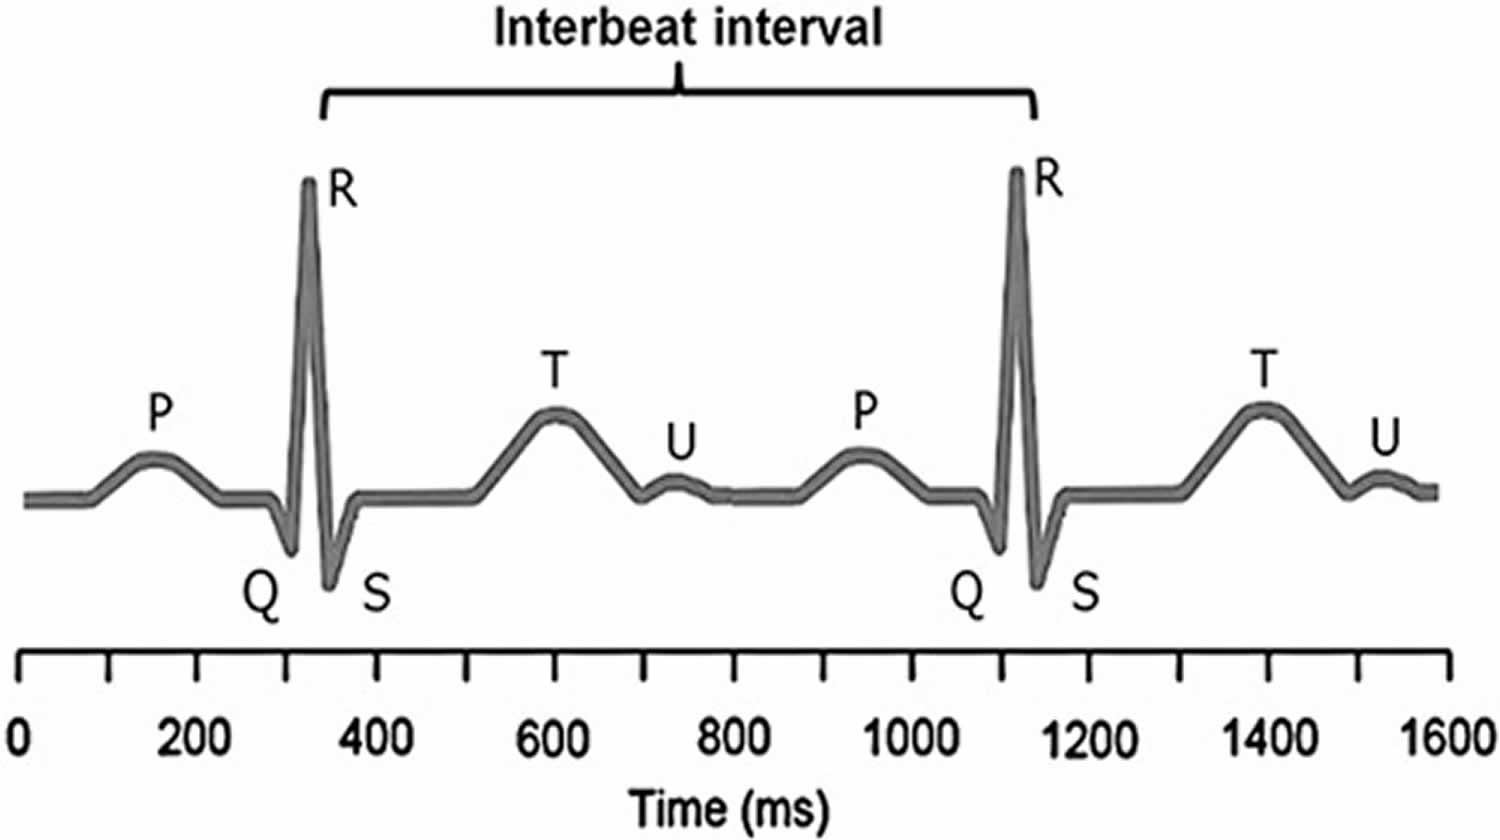
Footnote: A typical electrocardiogram trace is illustrated. R is the peak of the QRS complex (electrocardiogram trace) and heart-rate variability is measured by considering consecutive R–R intervals. The R–R interval is not constant, but varies within a normal range of 0.6–1.2 second. It is the degree of this R–R variability (interbeat intervals) that is of interest as greater variability is associated with better health.
[Source 10 ]Control of heart rate
Figure 1 shows an ECG trace from which the R-to-R intervals are measured, although it is the variability in the differences between these intervals that is of interest. In the brain stem, the medulla oblongata controls heart rate through the vagus, the tenth cranial nerve: vagal tone reduces heart rate by inhibiting the sinoatrial node (SA node), the heart’s pacemaker. A major cardiovascular center, located in the medulla oblongata of the brainstem, integrates sensory information from proprioceptors (limb position), chemoreceptors (blood chemistry), and mechanoreceptors (also called baroreceptors) from the heart and information from the rest of the brain: including the central autonomic network 11 with the prefrontal cortex playing a leading role 12 and limbic system. The cortical regulation of the central autonomic network has been well described; there are both direct and indirect pathways (involving the cingulate and insula cortices, amygdala, hypothalamus and medulla oblongata) linking the frontal cortex to autonomic motor circuits responsible for both the excitatory and inhibitory effects on the heart 12. Therefore, the moment-to-moment control of heart rate reflects complex interactions between physiology, emotion and cognition 12, encompassing the integration of a wide variety of information. The the medulla oblongata responds to sensory and higher brain center input by adjusting heart rate via shifts in the relative balance between sympathetic and parasympathetic outflow 13. Thus, it has been suggested that heart rate variability reflects the overall capacity of the body to deal with on-going demands 14. “Heart rate variability may serve as a proxy for the ‘vertical integration’ of the brain mechanisms that guide flexible control over behaviour with peripheral physiology, and as such provides an important window into understanding stress and health” 15. In this way, heart rate variability may act as a biomarker when considering the influence of diet on health-related mechanisms.
Figure 2. Heart rate variability controls

Footnote: The neural communication pathways interacting between the heart and the brain are responsible for the generation of heart rate variability. The intrinsic cardiac nervous system integrates information from the extrinsic nervous system and from the sensory neurites within the heart. The extrinsic cardiac ganglia located in the thoracic cavity have connections to the lungs and esophagus and are indirectly connected via the spinal cord to many other organs such as the skin and arteries. The vagus nerve (parasympathetic) primarily consists of afferent (flowing to the brain) fibers which connect to the medulla, after passing through the nodose ganglion.
[Source 16]Sources of short-term heart rate variability
Two distinct but overlapping processes generate short-term heart rate variability measurements. The first source is a complex and dynamic relationship between the sympathetic and parasympathetic branches. The second source includes the regulatory mechanisms that control heart rate via respiratory sinus arrhythmia, the baroreceptor reflex (negative-feedback control of BP), and rhythmic changes in vascular tone 4. Respiratory sinus arrhythmia refers to the respiration-driven speeding and slowing of the heart via the vagus nerve 17.
Dynamic autonomic relationship
In a healthy human heart, there is a dynamic relationship between the parasympathetic nervous system and sympathetic nervous system. Parasympathetic nervous system control predominates at rest, resulting in an average heart rate of 75 beats per minute (bpm). This is significantly slower than the SA node’s (the sinus node, the heart’s natural pacemaker) intrinsic rate, which decreases with age from an average 107 beats per minute (bpm) at 20 years to 90 beats per minute (bpm) at 50 years 18. The parasympathetic nervous system can slow the heart to 20 or 30 beats per minute (bpm), or briefly stop it 19. This illustrates the response called accentuated antagonism 20.
Parasympathetic nerves exert their effects more rapidly (<1 second) than sympathetic nerves (>5 second) 21. Since these divisions can produce contradictory actions, like speeding and slowing the heart, their effect on an organ depends on their current balance of activity. While the sympathetic nervous system can suppress parasympathetic nervous system activity, it can also increase parasympathetic nervous system reactivity 22. Parasympathetic rebound may occur following high levels of stress, resulting in increased nighttime gastric activity 23 and asthma symptoms 24.
The relationship between the parasympathetic nervous system and sympathetic nervous system branches is complex (both linear and non-linear) and should not be described as a “zero sum” system. Increased parasympathetic nervous system activity may be associated with a decrease, increase, or no change in sympathetic nervous system activity. For example, immediately following aerobic exercise, heart rate recovery involves parasympathetic nervous system reactivation while sympathetic nervous system activity remains elevated 25.
Likewise, teaching clients to breathe slowly when they experience high levels of sympathetic nervous system activity can engage both branches and increase respiratory sinus arrhythmia. This is analogous to a Formula 1 driver speeding through a turn while gently applying the left foot to the brake, a maneuver called “left-foot braking.” The complex relationship between sympathetic nervous system and parasympathetic nervous system nerve activity means that the ratio between Low Frequency (LF) and High Frequency (HF) power will not always index autonomic balance 26.
Regulatory mechanisms
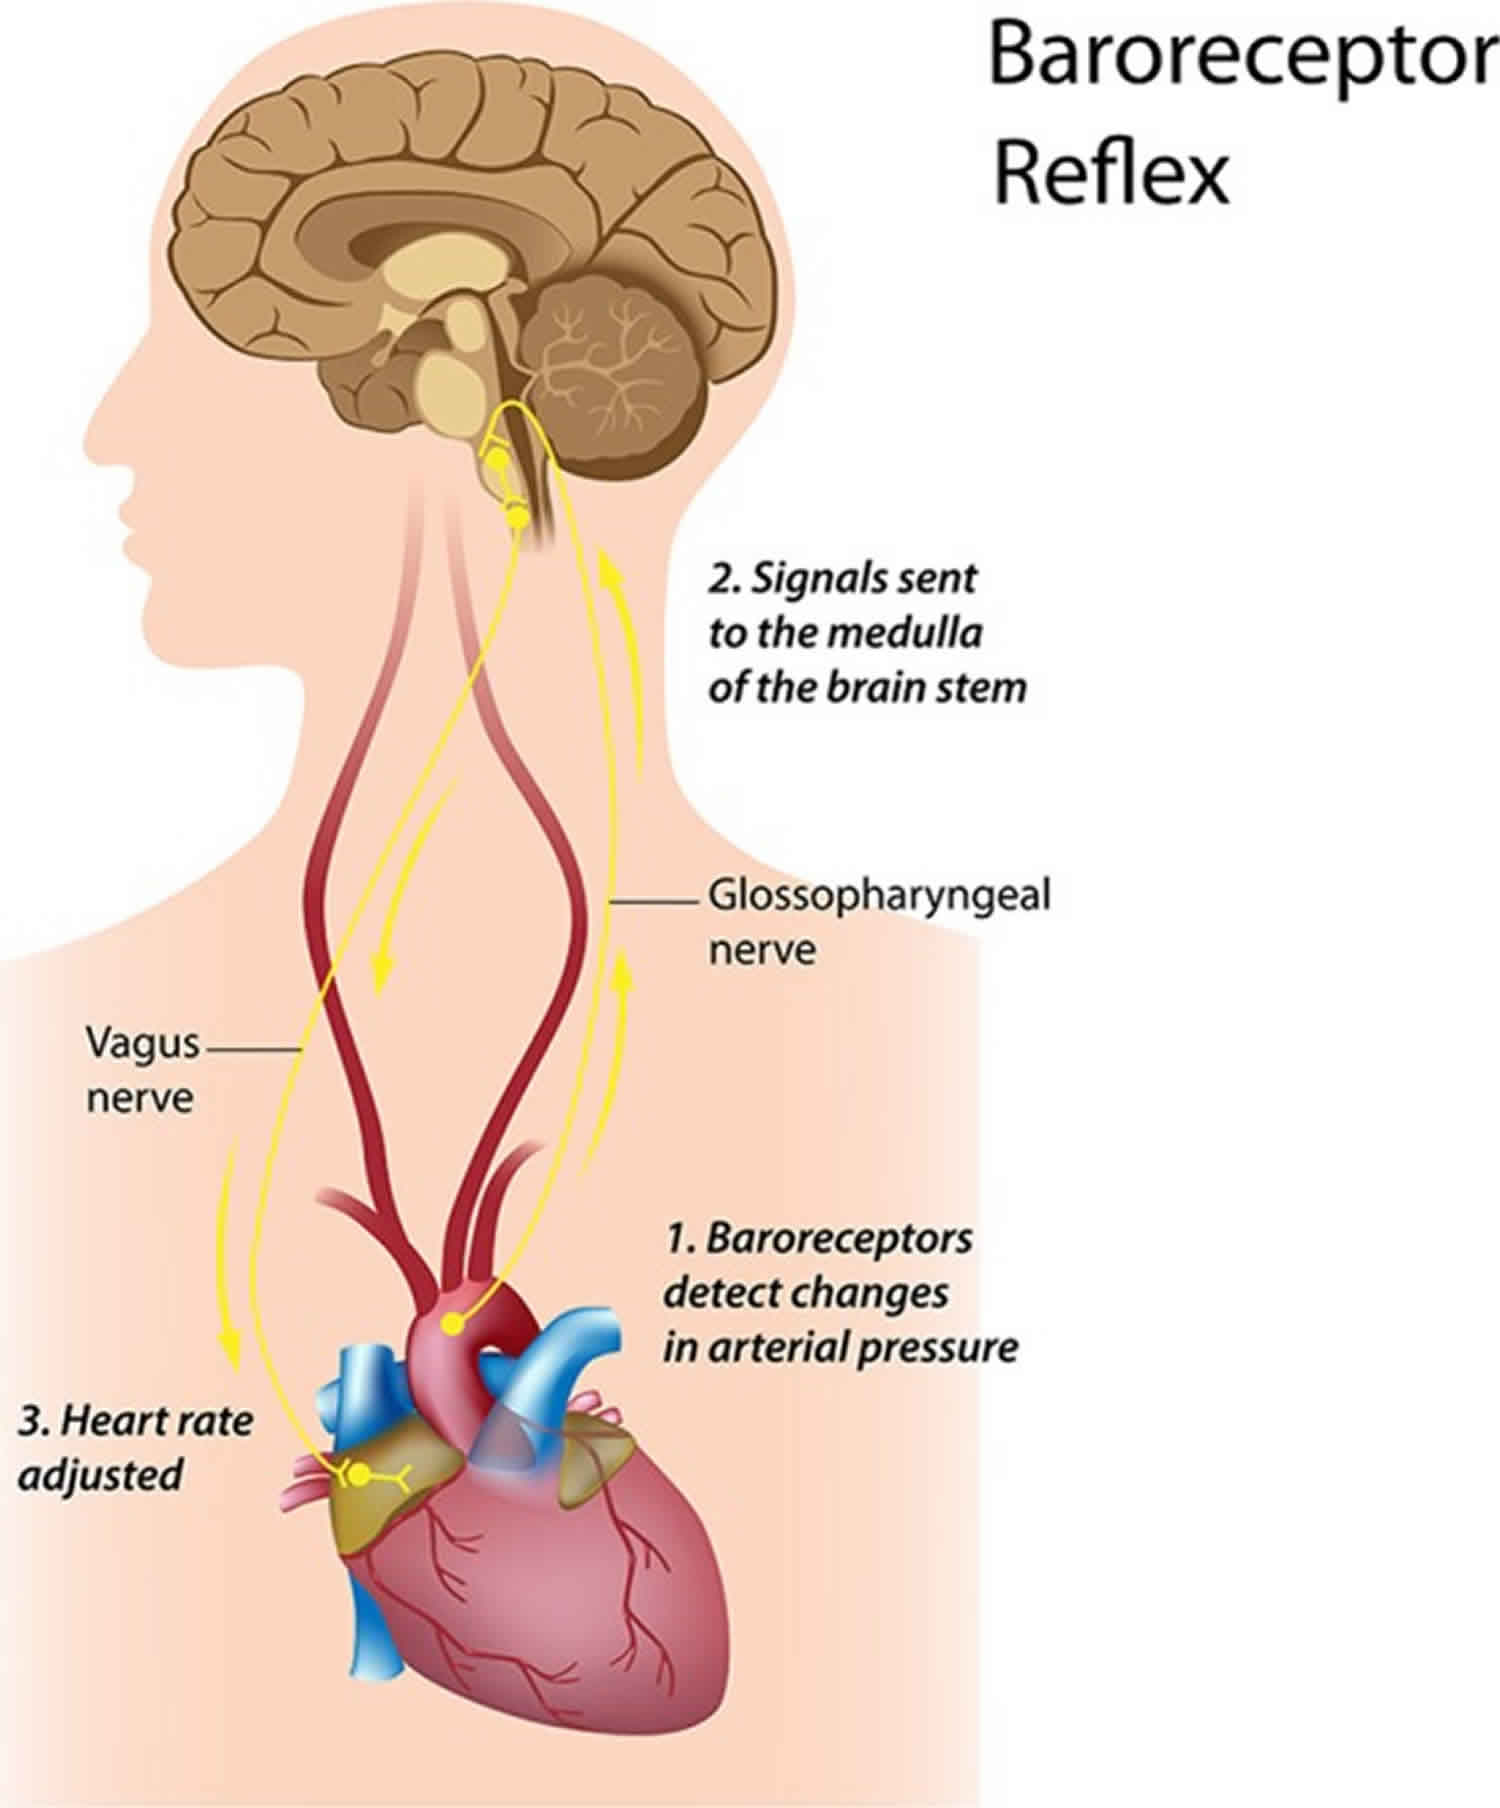
The autonomic, cardiovascular, central nervous, endocrine, and respiratory systems, and baroreceptors and chemoreceptors influence heart rate variability over a short time period and contribute to the very-low to high frequencies of the heart rate variability spectrum 27. Baroreceptors, which are BP sensors located in the aortic arch and internal carotid arteries, contribute to short-term heart rate variability 28. When you inhale, heart rate increases. BP rises about 4–5 seconds later. Baroreceptors detect this rise and fire more rapidly. When you exhale, heart rate decreases. BP falls 4–5 seconds later 29. The baroreflex makes this acceleration and deceleration of the heart, called respiratory sinus arrhythmia, possible 17.
The baroreflex links heart rate, BP, and vascular tone. Oscillation in one cardiovascular function causes identical oscillations in the others 30. Baroreceptor firing due to BP changes activates mechanisms that change heart rate and vascular tone. Rising BP triggers decreases in heart rate and vascular tone, while falling BP causes increases in both.
24 hour heart rate variability
Circadian rhythms, core body temperature, metabolism, the sleep cycle, and the renin–angiotensin system contribute to 24 hour heart rate variability recordings, which represent the “gold standard” for clinical heart rate variability assessment 27. These recordings achieve greater predictive power than short-term measurements 31. Although cardiac physiologists calculate 24 hour and short-term heart rate variability measurements using the same mathematical formulas, they cannot substitute for each other and their physiological meaning can profoundly differ 32.
How is heart rate variability detected?
Clinicians use electrocardiograph (ECG) or photoplethysmograph (PPG) sensors to detect the interbeat interval (IBI). While the ECG method had been considered to be more accurate than the photoplethysmograph method because early software algorithms could more easily detect the sharp upward spike of the R wave than the curved peak of the blood volume pulse signal, newer algorithms have improved peak detection from the pulse wave. The ECG method should be used when recordings are contaminated by frequent abnormal beats (e.g., premature ventricular contractions), since the ECG’s morphology and timing properties allow software algorithms to discriminate normal sinus beats from ectopic beats 33.
All heart rate variability assessments are calculated from an interbeat interval (IBI) file. However, in some cases there can be differences in the interbeat interval (IBI) files derived from ECG and photoplethysmograph data. Several studies have shown that when the recordings are taken during a resting state (sitting quietly as done in most resting baseline recordings), the interbeat interval (IBI) values between ECG and photoplethysmograph are highly correlated 34. However, during ambulatory monitoring or when a person experiences a stressor strong enough to activate the sympathetic system, there can be significant differences due to changes in pulse transit time (the time it takes the BP wave to propagate from the heart to the periphery), which result from changes in the elasticity of the arteries. When arteries stiffen due to sympathetic activation, the BP wave travels faster. The accuracy of heart rate variability measurements is primarily determined by the sampling rate of the data acquisition system. Kuusela 35 recommends a sampling rate of 200 Hz unless overall variability among RR intervals is unusually low, as in case of heart failure. In contrast, Berntson et al. 36 recommend a minimum sampling rate of 500–1000 Hz. However, for many applications, like heart rate variability biofeedback, a sampling rate of 126 Hz may be adequate.
There are many ECG configurations, with varying numbers of leads, used for ambulatory and stationary monitoring. For example, a standard three-lead ECG chest placement locates active and reference electrodes over the right and left coracoid processes, respectively, and a second active electrode over the xiphoid process (Figure 3).
Figure 3. ECG electrode placement

Heart rate variability analysis methods
It was recognized as far back as 1979 that nomenclature, analytical methods, and definitions of heart rate variability measures required standardization. Therefore, an International Task Force consisting of members from the European Society of Cardiology and the North American Society for Pacing and Electrophysiology was established. Their report was published in Task Force 37.
Heart rate variability can be assessed with various analytical approaches, although the most commonly used are frequency domain or power spectral density analysis and time domain analysis. In both methods, the time intervals between each successive normal QRS complex are first determined. All abnormal beats not generated by sinus node depolarizations are eliminated from the record.
Scientists use power spectral analysis to separate heart rate variability into its component rhythms that operate within different frequency ranges (Figure 4). Power spectral density analysis provides information of how power is distributed (the variance and amplitude of a given rhythm) as a function of frequency (the time period of a given rhythm). The main advantages of spectral analysis over the time domain measures are that it supplies both frequency and amplitude information about the specific rhythms that exist in the heart rate variability waveform, providing a means to quantify the various oscillations over any given period in the heart rate variability recording. The values are expressed as the power spectral density, which is the area under the curve (peak) in a given segment of the spectrum. The power or height of the peak at any given frequency indicates the amplitude and stability of the rhythm. The frequency reflects the period of time over which the rhythm occurs. For example, a 0.1 Hz frequency has a period of 10 seconds. In order to understand how power spectral analysis distinguishes the various underlying physiological mechanisms that are reflected in the heart’s rhythm, a brief review of these underlying physiological mechanisms follows.
Figure 4 shows a typical example of an heart rate variability recoding from an adult human at rest. Using filtering techniques, the high-frequency (HF), low-frequency (LF), and very-low-frequency (VLF) bands have been extracted from the original heart rate variability signal and spectral power has been calculated for each band.
Figure 4. Power spectral analysis

Footnote: This figure shows a typical heart rate variability recording over a 15-min period during resting conditions in a healthy individual. The top trace shows the original heart rate variability waveform. Filtering techniques were used to separate the original waveform into very-low-frequency (VLF), low-frequency (LF), and high-frequency (HF) bands as shown in the lower traces. The bottom of the figure shows the power spectra (left) and the percentage of power (right) in each band.
[Source 16]Sources of heart rate variability
The Task Force report (1996) divided heart rhythm oscillations into four primary frequency bands. These included the ultra-low-frequency (ULF), very-low-frequency (VLF), low-frequency (LF), and high-frequency (HF) bands. The Task Force report also stated that the analysis should be done on 5-min segments, although other recording periods are often used. When other recording lengths are analyzed and reported, the length of the recording should be reported since this has large effects on both heart rate variability frequency and time domain values.
High-frequency band
The high-frequency (HF) spectrum is the power in each of the 288 5-min segments (monitored during a 24-hour period) in the range from 0.15 to 0.4 Hz. This band reflects parasympathetic or vagal activity and is frequently called the respiratory band because it corresponds to the heart rate variations related to the respiratory cycle. These heart rate changes are known as respiratory sinus arrhythmia. Heart rate accelerates during inspiration and slows during expiration. During inhalation, the cardiovascular center inhibits vagal outflow resulting in speeding the heart rate. Conversely, during exhalation, it restores vagal outflow resulting in slowing the heart rate via the release of acetylcholine 38. The magnitude of the oscillation is variable, but can usually be exaggerated by slow, deep breathing.
The modulation of vagal tone helps maintain the dynamic autonomic regulation important for cardiovascular health. Deficient vagal inhibition is implicated in increased morbidity 39. The mechanism linking the variability of heart rate to respiration is complex and involves both central and reflex interactions. A large number of studies have shown that total vagal blockade essentially eliminates high-frequency (HF) oscillations and reduces the power in the low-frequency (LF) range 40.
Reduced parasympathetic (high frequency) activity has been found in a number of cardiac pathologies and in patients under stress or suffering from panic, anxiety, or worry. Lowered parasympathetic activity may primarily account for reduced heart rate variability in aging 41. In younger healthy individuals, it is not uncommon to see an obvious increase in the high-frequency (HF) band at night with a decrease during the day 42.
Low-frequency band
The low-frequency (LF) band ranges between 0.04 and 0.15 Hz. This region was previously called the “baroreceptor range” or “mid-frequency band” by many researchers, since it primarily reflects baroreceptor activity while at rest 43. The vagus nerves are a major conduit though which afferent neurological signals from the heart and other visceral organs are relayed to the brain, including the baroreflex signals 44. Baroreceptors are stretch-sensitive mechanoreceptors located in the chambers of the heart and vena cavae, carotid sinuses (which contain the most sensitive mechanoreceptors), and the aortic arch (Figure 5). When BP rises, the carotid and aortic tissues are distended, resulting in increased stretch and, therefore, increased baroreceptor activation. At normal resting BPs, many baroreceptors actively report BP information and the baroreflex modulates autonomic activity.
Active baroreceptors generate action potentials (“spikes”) more frequently. The greater their stretch or detection of an increased rate of change, the more frequently baroreceptors fire action potentials. Baroreceptor action potentials are relayed to the nucleus of the solitary tract in the medulla, which uses baroreceptor firing frequency to measure BP. Increased activation of the nucleus of the solitary tract inhibits the vasomotor center and stimulates the vagal nuclei. The end-result of baroreceptor activations tuned to pressure increases is inhibition of the sympathetic nervous system and activation of the parasympathetic nervous system. By coupling sympathetic inhibition with parasympathetic activation, the baroreflex maximizes BP reduction when BP is detected as too high. Sympathetic inhibition reduces peripheral resistance, while parasympathetic activation depresses heart rate (reflex bradycardia) and contractility. In a similar manner, sympathetic activation, along with inhibition of vagal outflow, allows the baroreflex to elevate BP. Baroreflex gain is commonly calculated as the beat-to-beat change in heart rate per unit of change in BP. Decreased baroreflex gain is related to impaired regulatory capacity and aging.
The existence of a cardiovascular system resonance frequency, which is caused by the delay in the feedback loops in the baroreflex system, has been long established 45. Lehrer et al. 46 have proposed that each individual’s cardiovascular system has a unique resonance frequency, which can be identified by measuring heart rate variability while an individual breathes between 7.5 and 4.5 breaths per minute. When the cardiovascular system oscillates at this frequency, there is a distinctive high-amplitude peak in the heart rate variability power spectrum around 0.1 Hz. Most mathematical models show that the resonance frequency of the human cardiovascular system is determined by the feedback loops between the heart and brain 47. In humans and many other mammals, the resonance frequency of the system is approximately 0.1 Hz, which is equivalent to a 10-seconds rhythm.
The sympathetic system does not appear to produce rhythms much above 0.1 Hz, while the parasympathetic system can be observed to affect heart rhythms down to 0.05 Hz (20-s rhythm). During periods of slow respiration rates, vagal activity can easily generate oscillations in the heart rhythms that cross over into the LF band 48. Therefore, respiratory-related efferent vagally-mediated influences are particularly present in the low-frequency (LF) band when respiration rates are below 8.5 breaths per minute or 7-seconds periods 49 or when an individual sighs or takes a deep breath.
In ambulatory 24-hour heart rate variability recordings, it has been suggested that the low-frequency (LF) band also reflects sympathetic activity and the LF/HF ratio has been controversially reported as an assessment of the balance between sympathetic and parasympathetic activity 50. A number of researchers 51 have challenged this perspective and have persuasively argued that in resting conditions, the low-frequency (LF) band reflects baroreflex activity and not cardiac sympathetic innervation.
The perspective that the low-frequency (LF) band reflects sympathetic activity came from observations of 24-hour ambulatory recordings where there are frequent sympathetic activations primarily due to physical activity, but also due to emotional stress reactions, which can create oscillations in the heart rhythms that cross over into the lower part of the low-frequency (LF) band. In long-term ambulatory recordings, the low-frequency (LF) band fairly approximates sympathetic activity when increased sympathetic activity occurs 52. This will be discussed in more detail in the very-low-frequency (VLF) section. Unfortunately, some authors have assumed that this interpretation was also true of short-term resting recordings and have confused slower breathing-related increases in low-frequency (LF) power with sympathetic activity, when in reality it is almost entirely vagally mediated. Remember that the baroreflex is primarily vagally mediated 53.
Porges 54 suggests that under conditions when participants pace their breathing at 0.1 Hz (10-s rhythm or 6 breaths per minute), which is a component of many heart rate variability biofeedback training protocols, the low-frequency (LF) band includes the summed influence of both efferent vagal pathways (myelinated and unmyelinated, which reflects total cardiac vagal tone).
Figure 5. Baroreceptors
Autonomic balance and the LF/HF ratio
The autonomic balance hypothesis assumes that the sympathetic nervous system and parasympathetic nervous system competitively regulate SA node firing, where increased sympathetic nervous system activity is paired with decreased parasympathetic nervous system activity. While some orthostatic challenges can produce reciprocal changes in sympathetic nervous system activation and vagal withdrawal, psychological stressors can also result in independent changes in sympathetic nervous system or parasympathetic nervous system activity. It is now generally accepted that both branches of the autonomic nervous system can be simultaneously active 55. Therefore, the relationship between the sympathetic nervous system and parasympathetic nervous system in generating low-frequency (LF) power appears to be complex, non-linear, and dependent upon the experimental manipulation employed 56.
The ratio of low-frequency (LF) to high-frequency (HF) power is called the LF/HF ratio. The interpretation of the LF/HF ratio is controversial due to the issues regarding the low-frequency (LF) band described above. However, once the mechanisms are understood as well as the importance of the recording context (i.e., ambulatory vs. resting conditions and normal vs. paced breathing), the controversy is resolved. Recall that the power in the low-frequency (LF) band can be influenced by vagal, sympathetic, and baroreflex mechanisms depending on the context, whereas high-frequency (HF) power is produced by the efferent vagal activity due to respiratory activity. It is often assumed that a low LF/HF ratio reflects greater parasympathetic activity relative to sympathetic activity due to energy conservation and engaging in “tend-and-befriend” behaviors 57. However, LF/HF ratio is often shifted due to reductions in low-frequency (LF) power. Therefore, the LF/HR ratio should be interpreted with caution and the mean values of high-frequency (HF) and low-frequency (LF) power taken into consideration. In contrast, a high LF/HF ratio may indicate higher sympathetic activity relative to parasympathetic activity as can be observed when people engage in meeting a challenge that requires effort and increased sympathetic nervous system activation. Again, the same cautions must be taken into consideration, especially in short-term recordings.
Very-low-frequency band
The very-low-frequency (VLF) band is the power in the heart rate variability power spectrum range between 0.0033 and 0.04 Hz. Although all 24-hour clinical measures of heart rate variability reflecting low heart rate variability are linked with increased risk of adverse outcomes, the very-low-frequency (VLF) band has stronger associations with all-cause mortality than the low-frequency (LF) and high-frequency (HF) bands 58. Low very-low-frequency (VLF) power has been shown to be associated with arrhythmic death 59. Additionally, low power in this band has been associated with high inflammation in a number of studies 60 and has been correlated with low levels of testosterone, while other biochemical markers, such as those mediated by the hypothalamic pituitary adrenal (HPA) axis (e.g., cortisol), did not 61.
Historically, the physiological explanation and mechanisms involved in the generation of the very-low-frequency (VLF) component have not been as well defined as the low-frequency (LF) and high-frequency (HF) components, and this region has been largely ignored. Long-term regulation mechanisms and autonomic nervous system activity related to thermoregulation, the renin-angiotensin system, and other hormonal factors may contribute to this band (Akselrod et al., 1981; Cerutti et al., 1995; Claydon and Krassioukov, 2008). Recent work by Dr. Andrew Armour has shed new light on the mechanisms underlying the very-low-frequency (VLF) rhythm and suggests that we may have to reconsider both the mechanisms and importance of this band.
Dr. Armour’s group has developed the technology to obtain long-term single-neuron recordings from a beating heart, and simultaneously, from extrinsic cardiac neurons 62. Figure 6 shows the very-low-frequency (VLF) rhythm obtained from an afferent neuron located in the intrinsic cardiac nervous system in a dog heart. In this case, the very-low-frequency (VLF) rhythm is generated from intrinsic sources and cannot be explained by sources such as movement. The black area in the bottom of the figure labeled “rapid ventricular pacing” shows the time period where efferent spinal neurons were stimulated. The resulting increase in efferent sympathetic activity (bottom row) clearly elevates the amplitude of the single afferent neuron’s intrinsic very-low-frequency (VLF) rhythm (top row).
This work, combined with findings by Kember et al. 63, implies that the very-low-frequency (VLF) rhythm is generated by the stimulation of afferent sensory neurons in the heart, which in turn activate various levels of the feedback and feed-forward loops in the heart’s intrinsic cardiac nervous system, as well as between the heart, the extrinsic cardiac ganglia, and spinal column. Thus, the very-low-frequency (VLF) rhythm is produced by the heart itself and is an intrinsic rhythm that appears to be fundamental to health and well-being. Dr. Armour has observed that when the amplitude of the very-low-frequency (VLF) rhythm at the neural level is diminished, an animal subject is in danger and will expire shortly if they proceed with the research procedures (personal communication with McCraty). Sympathetic blockade does not affect very-low-frequency (VLF) power and very-low-frequency (VLF) activity is seen in tetraplegics, whose SNS innervation of the heart and lungs is disrupted 64. These findings further support a cardiac origin of the very-low-frequency (VLF) rhythm.
In healthy individuals, there is an increase in very-low-frequency (VLF) power that occurs during the night and peaks before waking 65. This increase in autonomic activity may correlate with the morning cortisol peak.
In summary, experimental evidence suggests that the very-low-frequency (VLF) rhythm is intrinsically generated by the heart and that the amplitude and frequency of these oscillations are modulated by efferent sympathetic activity. Normal very-low-frequency (VLF) power appears to indicate healthy function, and increases in resting very-low-frequency (VLF) power may reflect increased sympathetic activity. The modulation of the frequency of this rhythm due to physical activity 66, stress responses, and other factors that increase efferent sympathetic activation can cause it to cross over into the lower region of the LF band during ambulatory monitoring or during short-term recordings when there is a significant stressor.
Figure 6. Very-low-frequency heart rhythm

Footnote: Long-term single-neuron recordings from an afferent neuron in the intrinsic cardiac nervous system in a beating dog heart. The top row shows neural activity, the second row, the actual neural recording, and the third row, the left ventricular pressure. This intrinsic rhythm has an average period of 90 s with a range between 75 and 100 s (0.013–0.01 Hz), which falls within the very-low-frequency (VLF) band.
[Source 16]Ultra-low-frequency band
The ultra-low-frequency (ULF) band falls below 0.0033 Hz (333 seconds or 5.6 minutes). Oscillations or events in the heart rhythm with a period of 5 minutes or greater are reflected in this band and it can only be assessed with 24-hour and longer recordings 31. The circadian oscillation in heart rate is the primary source of the ultra-low-frequency (ULF) power, although other very slow-acting regulatory processes, such as core body temperature regulation, metabolism, and the renin-angiotensin system likely add to the power in this band 37. Different psychiatric disorders show distinct circadian patterns in 24-h heart rates, particularly during sleep 67.
The Task Force report (1996) stated that analysis of 24-hour recordings should divide the record into 5-min segments and that heart rate variability analysis should be performed on the individual segments prior to the calculation of mean values. This effectively filters out any oscillations with periods longer than 5 min. However, as shown in Figure 7, when spectral analysis is applied to entire 24-hour records, several lower frequency rhythms are easily detected in healthy individuals. At the present time, the clinical relevance of these lower frequency rhythms is unknown, largely due to the Task Force guidelines that eliminate their presence from most analysis procedures.
Figure 7. Normal heart rate variability

Foonote: This figure shows the power in the various frequency bands for 24-hour heart rate variability and 95% confidence intervals for each of the bands. The left side of the figure reveals a number of slower rhythms that make up the ultra-low-frequency (ULF) band. The analysis was conducted using the healthy sample described in Umetani et al. 41). The right side of the figure shows an analysis of the same data performed on 5-minutes segments as is traditionally done.
[Source 16]Time domain measurements of heart rate variability
Time domain measures are the simplest to calculate and include the mean normal-to-normal (NN) intervals during the entire recording and other statistical measures such as the standard deviation between normal-to-normal intervals (SDNN). However, time domain measures do not provide a means to adequately quantify autonomic dynamics or determine the rhythmic or oscillatory activity generated by the different physiological control systems. Since they are always calculated the same way, data collected by different researchers are comparable, but only if the recording lengths are exactly the same and the data are collected under the same conditions.
Time domain indices quantify the amount of variance in the interbeat interval (IBI) using statistical measures. For 24-h recordings, the three most important time domain measures are the standard deviation between normal-to-normal intervals (SDNN), the SDNN index, and the Root Mean Square of the Successive Differences (RMSSD). For short-term assessments, the SDNN, Root Mean Square of the Successive Differences (RMSSD), pNN50, and HR Max – HR Min are most commonly reported.
Standard deviation between normal-to-normal intervals (SDNN)
The standard deviation between normal-to-normal intervals (SDNN) is the standard deviation of the normal (NN) sinus-initiated interbeat interval (IBI) measured in milliseconds. This measure reflects the ebb and flow of all the factors that contribute to heart rate variability (HRV). In 24-hour recordings, the SDNN is highly correlated with ultra-low-frequency (ULF) and total power 41. In short-term resting recordings, the primary source of the variation is parasympathetically-mediated respiratory sinus arrhythmia, especially with slow, paced breathing protocols.
SDNN values are highly correlated with the lower frequency rhythms discussed in Table 1. Low age-adjusted values predict both morbidity and mortality. Classification within a higher SDNN category is associated with a higher probability of survival. For example, patients with moderate SDNN values, 50–100 ms, have a 400% lower risk of mortality than those with low values, 0–50 ms, in 24-h recordings 68.
Table 1. Correlations between time and frequency domain measures in 24-hour recordings.
| HR (ms) | N-D delta | SDNN | Ln total power | Ln ULF | SDANN | SDNN index | Ln 5-min total power | Ln 5-min VLF | Ln 5-min LF | Ln 5-min HF | Ln RMSSD | Ln LF/HF | |
|---|---|---|---|---|---|---|---|---|---|---|---|---|---|
| HR (ms) | 1 | ||||||||||||
| N-D delta | 0.29 | 1 | |||||||||||
| SDNN | 0.61 | 0.66 | 1 | ||||||||||
| Ln total power | 0.55 | 0.66 | 0.98 | 1 | |||||||||
| Ln ULF | 0.47 | 0.67 | 0.95 | 0.99 | 1 | ||||||||
| SDANN | 0.47 | 0.70 | 0.96 | 0.97 | 0.98 | 1 | |||||||
| SDNN index | 0.72 | 0.43 | 0.79 | 0.73 | 0.62 | 0.62 | 1 | ||||||
| Ln 5-min total power | 0.71 | 0.40 | 0.78 | 0.71 | 0.60 | 0.61 | 0.99 | 1 | |||||
| Ln 5-min VLF | 0.74 | 0.49 | 0.83 | 0.80 | 0.70 | 0.68 | 0.96 | 0.93 | 1 | ||||
| Ln 5-min LF | 0.57 | 0.27 | 0.63 | 0.61 | 0.49 | 0.48 | 0.87 | 0.84 | 0.81 | 1 | |||
| Ln 5-min HF | 0.36 | 0.38 | 0.56 | 0.54 | 0.44 | 0.44 | 0.79 | 0.75 | 0.68 | 0.75 | 1 | ||
| Ln RMSSD | 0.54 | 0.41 | 0.68 | 0.64 | 0.54 | 0.54 | 0.90 | 0.86 | 0.80 | 0.82 | 0.95 | 1 | |
| Ln LF/HF | −0.02 | −0.31 | −0.27 | −0.24 | −0.20 | −0.21 | −0.37 | −0.34 | −0.27 | −0.20 | −0.80 | −0.66 |
Standard deviation of the average normal-to-normal intervals (SDANN)
The standard deviation of the average normal-to-normal intervals (SDANN) (mean heart rate) for each of the 5-minutes segments during a 24-hour recording. Like the SDNN, it is measured and reported in milliseconds. This index is correlated with the SDNN and is generally considered redundant.
Standard deviation between normal-to-normal intervals (SDNN) index
The standard deviation between normal-to-normal intervals (SDNN) index is the mean of the standard deviations of all the normal-to-normal (NN) intervals for each 5-min segment of a 24-h heart rate variability recording. Therefore, this measurement only estimates variability due to the factors affecting heart rate variability within a 5-min period. It is calculated by first dividing the 24-h record into 288 5-min segments and then calculating the standard deviation of all normal-to-normal (NN) intervals contained within each segment. The SDNN Index is the average of these 288 values. The SDNN index is believed to primarily measure autonomic influence on heart rate variability. This measure tends to correlate with very-low-frequency (VLF) power over a 24-hour period.
Root Mean Square of the Successive Differences (RMSSD)
The RMSSD is the root mean square of successive differences between normal heartbeats. This value is obtained by first calculating each successive time difference between heartbeats in milliseconds. Then, each of the values is squared and the result is averaged before the square root of the total is obtained. The RMSSD reflects the beat-to-beat variance in heart rate and is the primary time domain measure used to estimate the vagally-mediated changes reflected in heart rate variability. While the RMSSD is correlated with high-frequency (HF) power 31, the influence of respiration rate on this index is uncertain 69. Lower RMSSD values are correlated with higher scores on a risk inventory of sudden unexplained death in epilepsy 70.
pNN50
The pNN50 is the percentage of adjacent normal-to-normal (NN) intervals that differ from each other by more than 50 ms. It is correlated with the RMSSD and HF power. However, the RMSSD typically provides a better assessment of respiratory sinus arrhythmia (especially in older subjects) and most researchers prefer it to the pNN50 71.
HR max – HR min
HR Max – HR Min is the average difference between the highest and lowest heart rates during each respiratory cycle. This measure is especially used for assessment in paced breathing protocols and is highly correlated with the SDNN and RMSSD.
Why is heart rate variability important?
An optimal level of heart rate variability within an organism’s key regulatory systems is critical to the inherent flexibility and adaptability or resilience that epitomizes healthy function and well-being. While too much instability is detrimental to efficient physiological functioning and energy utilization, too little variation indicates depletion or pathology.
Heart rate variability is a marker for disease and adaptability
The clinical importance of heart rate variability was noted as far back as 1965 when it was found that fetal distress is preceded by alterations in heart rate variability before any changes occur in heart rate itself 72. In the 1970s, heart rate variability analysis was shown to predict autonomic neuropathy in diabetic patients before the onset of symptoms 73. Low heart rate variability has since been confirmed as a strong, independent predictor of future health problems and as a correlate of all-cause mortality 74. Reduced heart rate variability is also observed in patients with autonomic dysfunction, including anxiety, depression, asthma, and sudden infant death 75.
Based on indirect evidence, reduced heart rate variability may correlate with disease and mortality because it reflects reduced regulatory capacity, which is the ability to adaptively respond to challenges like exercise or stressors. For example, patients with low overall heart rate variability demonstrated reduced cardiac regulatory capacity and an increased likelihood of prior myocardial infarction (heart attack). In this sample, a measure of cardiac autonomic balance did not predict previous heart attacks 76.
Patient age may mediate the relationship between reduced heart rate variability and regulatory capacity. Heart rate variability declines with age 41 and aging often involves nervous system changes, like loss of neurons in the brain and spinal cord, which may degrade signal transmission 77 and reduce regulatory capacity.
Reduced regulatory capacity may contribute to functional gastrointestinal disorders, inflammation, and hypertension. While patients with functional gastrointestinal disorders often have reduced heart rate variability 78, Heart rate variability biofeedback has increased vagal tone and improved symptom ratings in these patients 79.
The parasympathetic nervous system may help regulate inflammatory responses via a cholinergic anti-inflammatory system 80. While the experimental administration of lipopolysaccharide to healthy volunteers decreases heart rate variability and vagal tone 81, heart rate variabilityB training has reduced the symptoms produced by this intervention 82..
Hypertensive patients often present with reduced baroreflexes and heart rate variability 83. Heart rate variability biofeedback can increase baroreflex gain, which is the amplitude of heart rate changes, and heart rate variability, and decrease BP 84. Several randomized-controlled studies have documented BP reductions in hypertensive patients who received heart rate variability biofeedback 85.
Heart rate variability is also an indicator of psychological resiliency and behavioral flexibility, reflecting the individual’s capacity to adapt effectively to changing social or environmental demands 76. More recently, several studies have shown an association between higher levels of resting heart rate variability and performance on cognitive performance tasks requiring the use of executive functions 7 and that heart rate variability, especially heart rate variability-coherence, can be increased in order to produce improvements in cognitive function as well as a wide range of clinical outcomes, including reduced health care costs 86.
Summary
The SA node normally generates the heartbeat, which is modulated by autonomic efferent neurons and circulating hormones. There is a dynamic balance between sympathetic and parasympathetic nervous outflows in a healthy, resilient, and responsive nervous system. heart rate variability is generated by multiple regulatory mechanisms that operate on different time scales. Recent findings demonstrate the importance of the intrinsic cardiac nervous system and cardiac afferents in generating the heart rhythm and modulating the time interval between heartbeats. Vagally-mediated heart rate variability appears to represent an index of self-regulatory control, such that individuals with greater resting heart rate variability perform better on tests of executive functions.
Since the low-frequency (LF) band primarily reflects the vagally-mediated transmission between the heart and the central nervous system in the context of short-term BP regulation, resting measurements should not be used as markers of sympathetic nervous system activity. Based on 24-h monitoring, ultra-low-frequency (ULF) and very-low-frequency (VLF) rhythms are more strongly associated with overall health status than high-frequency (HF) rhythms. When age-adjusted values are low, they are also more strongly associated with future health risk and all-cause mortality.
Heart rate variability biofeedback exercises the baroreceptor reflex to enhance homeostatic regulation and restore regulatory capacity. Both the heart rhythm coherence and resonance frequency approaches to heart rate variability biofeedback train clients to produce auto-coherent heart rhythms with a single peak in the low-frequency (LF) region (typically around 0.1 Hz) and no significant peaks in the very-low-frequency (VLF) and high-frequency (HF) regions. Emotional self-regulation strategies can contribute to improved client health and performance, alone, or in combination with heart rate variability biofeedback training. A coherent heart is not a metronome since its rhythms are characterized by dynamic complexity with stability over longer time scales.
References- Shaffer F, Ginsberg JP. An Overview of Heart Rate Variability Metrics and Norms. Front Public Health. 2017;5:258. Published 2017 Sep 28. doi:10.3389/fpubh.2017.00258 https://www.ncbi.nlm.nih.gov/pmc/articles/PMC5624990
- Aging and nonlinear heart rate control in a healthy population. Beckers F, Verheyden B, Aubert AE. Am J Physiol Heart Circ Physiol. 2006 Jun; 290(6):H2560-70.
- Is the normal heartbeat chaotic or homeostatic? Goldberger AL. News Physiol Sci. 1991 Apr; 6():87-91.
- Gevirtz RN, Lehrer PM, Schwartz MS. Cardiorespiratory biofeedback. 4th ed In: Schwartz MS, Andrasik F, editors. , editors. Biofeedback: A Practitioner’s Guide. New York: The Guilford Press; (2016). p. 196–213.
- McCraty R, Atkinson M, Tomasino D, Bradley RT. The coherent heart: heart-brain interactions, psychophysiological coherence, and the emergence of system-wide order. Boulder Creek, CA: Institute of Heartmath; 2009.
- McCraty R, Shaffer F. Heart Rate Variability: New Perspectives on Physiological Mechanisms, Assessment of Self-regulatory Capacity, and Health risk. Glob Adv Health Med. 2015;4(1):46–61. doi:10.7453/gahmj.2014.073 https://www.ncbi.nlm.nih.gov/pmc/articles/PMC4311559
- Heart rate variability, prefrontal neural function, and cognitive performance: the neurovisceral integration perspective on self-regulation, adaptation, and health. Thayer JF, Hansen AL, Saus-Rose E, Johnsen BH. Ann Behav Med. 2009 Apr; 37(2):141-53.
- Sometimes higher heart rate variability is not better heart rate variability: results of graphical and nonlinear analyses. Stein PK, Domitrovich PP, Hui N, Rautaharju P, Gottdiener J. J Cardiovasc Electrophysiol. 2005 Sep; 16(9):954-9.
- Heart Rate Variability: New Perspectives on Physiological Mechanisms, Assessment of Self-regulatory Capacity, and Health risk. McCraty R, Shaffer F. Glob Adv Health Med. 2015 Jan; 4(1):46-61.
- Young HA, Benton D. Heart-rate variability: a biomarker to study the influence of nutrition on physiological and psychological health?. Behav Pharmacol. 2018;29(2 and 3-Spec Issue):140–151. doi:10.1097/FBP.0000000000000383 https://www.ncbi.nlm.nih.gov/pmc/articles/PMC5882295
- The central autonomic network: functional organization, dysfunction, and perspective. Benarroch EE. Mayo Clin Proc. 1993 Oct; 68(10):988-1001.
- Claude Bernard and the heart-brain connection: further elaboration of a model of neurovisceral integration. Thayer JF, Lane RD. Neurosci Biobehav Rev. 2009 Feb; 33(2):81-8.
- Shaffer F., Venner J. (2013). Heart rate variability anatomy and physiology. Biofeedback 41, 13–25 10.5298/1081-5937-41.1.05
- We should be using nonlinear indices when relating heart-rate dynamics to cognition and mood. Young H, Benton D. Sci Rep. 2015 Nov 13; 5():16619.
- A meta-analysis of heart rate variability and neuroimaging studies: implications for heart rate variability as a marker of stress and health. Thayer JF, Ahs F, Fredrikson M, Sollers JJ 3rd, Wager TD. Neurosci Biobehav Rev. 2012 Feb; 36(2):747-56.
- Shaffer F, McCraty R, Zerr CL. A healthy heart is not a metronome: an integrative review of the heart’s anatomy and heart rate variability. Front Psychol. 2014;5:1040. Published 2014 Sep 30. doi:10.3389/fpsyg.2014.01040 https://www.ncbi.nlm.nih.gov/pmc/articles/PMC4179748
- Counterpoint: respiratory sinus arrhythmia is due to the baroreflex mechanism. Karemaker JM. J Appl Physiol (1985). 2009 May; 106(5):1742-3; discussion 1744.
- The normal range and determinants of the intrinsic heart rate in man. Opthof T. Cardiovasc Res. 2000 Jan 1; 45(1):177-84.
- Tortora GJ, Derrickson BH. Principles of Anatomy and Physiology. 15th ed New York: John Wiley and Sons, Inc; (2017).
- Parasympathetic nervous system and heart failure: pathophysiology and potential implications for therapy. Olshansky B, Sabbah HN, Hauptman PJ, Colucci WS. Circulation. 2008 Aug 19; 118(8):863-71.
- A quantitative systematic review of normal values for short-term heart rate variability in healthy adults. Nunan D, Sandercock GR, Brodie DA. Pacing Clin Electrophysiol. 2010 Nov; 33(11):1407-17.
- Gellhorn E. Autonomic Imbalance and the Hypthalamus: Implications for Physiology, Medicine, Psychology, and Neuropsychiatry. London: Oxford University Press; (1957).
- Autonomic nervous function in patients with peptic ulcer studied by spectral analysis of heart rate variability. Nada T, Nomura M, Iga A, Kawaguchi R, Ochi Y, Saito K, Nakaya Y, Ito S. J Med. 2001; 32(5-6):333-47.
- Sleep, respiratory physiology, and nocturnal asthma. Ballard RD. Chronobiol Int. 1999 Sep; 16(5):565-80.
- An introduction to heart rate variability: methodological considerations and clinical applications. Billman GE, Huikuri HV, Sacha J, Trimmel K. Front Physiol. 2015; 6():55.
- The LF/HF ratio does not accurately measure cardiac sympatho-vagal balance. Billman GE. Front Physiol. 2013; 4:26.
- A healthy heart is not a metronome: an integrative review of the heart’s anatomy and heart rate variability. Shaffer F, McCraty R, Zerr CL. Front Psychol. 2014; 5():1040.
- Eckberg DL, Sleight P. Human Baroreflexes in Health and Disease. Oxford: Clarendon Press; (1992).
- Lehrer PM, Vaschillo E. The future of heart rate variability biofeedback. Biofeedback (2008) 36:11–4.
- Heart rate variability biofeedback as a method for assessing baroreflex function: a preliminary study of resonance in the cardiovascular system. Vaschillo E, Lehrer P, Rishe N, Konstantinov M. Appl Psychophysiol Biofeedback. 2002 Mar; 27(1):1-27.
- Heart rate variability: measurement and clinical utility. Kleiger RE, Stein PK, Bigger JT Jr. Ann Noninvasive Electrocardiol. 2005 Jan; 10(1):88-101.
- Kuusela T. Methodological aspects of heart rate variability analysis. In: Kamath MV, Watanabe MA, Upton ARM, editors. , editors. Heart Rate Variability (HRV) Signal Analysis. Boca Raton, FL: CRC Press; (2013). p. 9–42.
- An efficient method for ectopic beats cancellation based on radial basis function. Mateo J, Torres A, Rieta JJ. Conf Proc IEEE Eng Med Biol Soc. 2011; 2011():6947-50.
- How accurate is pulse rate variability as an estimate of heart rate variability? A review on studies comparing photoplethysmographic technology with an electrocardiogram. Schäfer A, Vagedes J. Int J Cardiol. 2013 Jun 5; 166(1):15-29.
- Kuusela T. (2013). Methodological aspects of heart rate variability analysis, in Heart Rate Variability (HRV) Signal Analysis: Clinical Applications, eds Kamath M. V., Watanabe M. A., Upton A. R. M., editors. (Boca Raton, FL: CRC Press; ), 10–42
- Berntson G. G., Quigley K. S., Lozano D. (2007). Cardiovascular psychophysiology, in Handbook of Psychophysiology, eds Cacioppo J. T., Tassinary L. G., Berntson G. G., editors. (New York, NY: Cambridge University Press; ), 182–210
- Heart rate variability: standards of measurement, physiological interpretation and clinical use. Task Force of the European Society of Cardiology and the North American Society of Pacing and Electrophysiology. Circulation. 1996 Mar 1; 93(5):1043-65.
- Human sinus node responses to repetitive, ramped carotid baroreceptor stimuli. Eckberg DL, Eckberg MJ. Am J Physiol. 1982 Apr; 242(4):H638-44.
- The relationship of autonomic imbalance, heart rate variability and cardiovascular disease risk factors. Thayer JF, Yamamoto SS, Brosschot JF. Int J Cardiol. 2010 May 28; 141(2):122-31.
- Cardiovascular neural regulation explored in the frequency domain. Malliani A, Pagani M, Lombardi F, Cerutti S. Circulation. 1991 Aug; 84(2):482-92.
- Twenty-four hour time domain heart rate variability and heart rate: relations to age and gender over nine decades. Umetani K, Singer DH, McCraty R, Atkinson M. J Am Coll Cardiol. 1998 Mar 1; 31(3):593-601.
- Age, gender and fractal scaling in heart rate variability. Otsuka K, Cornelissen G, Halberg F. Clin Sci (Lond). 1997 Oct; 93(4):299-308.
- Malliani A. (1995). Association of heart rate variability components with physiological regulatory mechanisms, in Heart Rate Variability, eds Malik M., Camm A. J., editors. (Armonk, NY: Futura Publishing Company, Inc.), 173–188
- Putative roles of neuropeptides in vagal afferent signaling. de Lartigue G. Physiol Behav. 2014 Sep; 136():155-69.
- Resonances in the cardiovascular system caused by rhythmical muscle tension. Vaschillo EG, Vaschillo B, Pandina RJ, Bates ME. Psychophysiology. 2011 Jul; 48(7):927-36.
- Lehrer P., Vaschillo B., Zucker T., Graves J., Katsamanis M., Aviles M., et al. (2013). Protocol for heart rate variability biofeedback training. Biofeedback 41, 98–109 10.5298/1081-5937-41.3.08
- Model for the assessment of heart period and arterial pressure variability interactions and of respiration influences. Baselli G, Cerutti S, Badilini F, Biancardi L, Porta A, Pagani M, Lombardi F, Rimoldi O, Furlan R, Malliani A. Med Biol Eng Comput. 1994 Mar; 32(2):143-52.
- Heart rate variability biofeedback increases baroreflex gain and peak expiratory flow. Lehrer PM, Vaschillo E, Vaschillo B, Lu SE, Eckberg DL, Edelberg R, Shih WJ, Lin Y, Kuusela TA, Tahvanainen KU, Hamer RM. Psychosom Med. 2003 Sep-Oct; 65(5):796-805.
- Cardiac coherence: a new, noninvasive measure of autonomic nervous system order. Tiller WA, McCraty R, Atkinson M. Altern Ther Health Med. 1996 Jan; 2(1):52-65.
- Power spectral analysis of heart rate and arterial pressure variabilities as a marker of sympatho-vagal interaction in man and conscious dog. Pagani M, Lombardi F, Guzzetti S, Rimoldi O, Furlan R, Pizzinelli P, Sandrone G, Malfatto G, Dell’Orto S, Piccaluga E. Circ Res. 1986 Aug; 59(2):178-93.
- Sympathovagal balance from heart rate variability: an obituary. Heathers JA. Exp Physiol. 2012 Apr; 97(4):556.
- Spectral analysis of fluctuations in heart rate: an objective evaluation of autonomic nervous control in chronic renal failure. Axelrod S, Lishner M, Oz O, Bernheim J, Ravid M. Nephron. 1987; 45(3):202-6.
- Time delay of vagally mediated cardiac baroreflex response varies with autonomic cardiovascular control. Keyl C, Schneider A, Dambacher M, Bernardi L. J Appl Physiol (1985). 2001 Jul; 91(1):283-9.
- The polyvagal perspective. Porges SW. Biol Psychol. 2007 Feb; 74(2):116-43.
- Berntson G. G., Cacioppo J. T. (1999). Heart rate variability: a neuroscientific perspective for further studies. Card. Electrophysiol. Rev. 3, 279–282 10.1023/A:1009920002142
- The LF/HF ratio does not accurately measure cardiac sympatho-vagal balance. Billman GE. Front Physiol. 2013; 4():26.
- Taylor S. E. (2006). Tend and befriend biobehavioral bases of affiliation under stress. Curr. Dir. Psychol. Sci. 15, 273–277 10.1111/j.1467-8721.2006.00451.x
- Autonomic dysfunction predicts mortality in patients with multiple organ dysfunction syndrome of different age groups. Schmidt H, Müller-Werdan U, Hoffmann T, Francis DP, Piepoli MF, Rauchhaus M, Prondzinsky R, Loppnow H, Buerke M, Hoyer D, Werdan K. Crit Care Med. 2005 Sep; 33(9):1994-2002.
- Posttraumatic stress disorder and impaired autonomic modulation in male twins. Shah AJ, Lampert R, Goldberg J, Veledar E, Bremner JD, Vaccarino V. Biol Psychiatry. 2013 Jun 1; 73(11):1103-10.
- Decreased heart rate variability is associated with higher levels of inflammation in middle-aged men. Lampert R, Bremner JD, Su S, Miller A, Lee F, Cheema F, Goldberg J, Vaccarino V. Am Heart J. 2008 Oct; 156(4):759.e1-7.
- Saliva testosterone and heart rate variability in the professional symphony orchestra after “public faintings” of an orchestra member. Theorell T, Liljeholm-Johansson Y, Björk H, Ericson M. Psychoneuroendocrinology. 2007 Jul; 32(6):660-8.
- Armour J. A. (2003). Neurocardiology: Anatomical and Functional Principles. Boulder Creek, CA: Institute of HeartMath
- Competition model for aperiodic stochastic resonance in a Fitzhugh-Nagumo model of cardiac sensory neurons. Kember GC, Fenton GA, Armour JA, Kalyaniwalla N. Phys Rev E Stat Nonlin Soft Matter Phys. 2001 Apr; 63(4 Pt 1):041911.
- Heart rate variability: origins, methods, and interpretive caveats. Berntson GG, Bigger JT Jr, Eckberg DL, Grossman P, Kaufmann PG, Malik M, Nagaraja HN, Porges SW, Saul JP, Stone PH, van der Molen MW. Psychophysiology. 1997 Nov; 34(6):623-48.
- Circadian heart rate and blood pressure variability considered for research and patient care. Singh RB, Cornélissen G, Weydahl A, Schwartzkopff O, Katinas G, Otsuka K, Watanabe Y, Yano S, Mori H, Ichimaru Y, Mitsutake G, Pella D, Fanghong L, Zhao Z, Rao RS, Gvozdjakova A, Halberg F. Int J Cardiol. 2003 Jan; 87(1):9-28; discussion 29-30.
- Physical activity influences heart rate variability and very-low-frequency components in Holter electrocardiograms. Bernardi L, Valle F, Coco M, Calciati A, Sleight P. Cardiovasc Res. 1996 Aug; 32(2):234-7.
- Stampfer H. G., Dimmitt S. B. (2013). Variations in circadian heart rate in psychiatric disorders: theoretical and practical implications. Chronophysiol. Ther. 3, 41–50 10.2147/CPT.S43623
- Decreased heart rate variability and its association with increased mortality after acute myocardial infarction. Kleiger RE, Miller JP, Bigger JT Jr, Moss AJ. Am J Cardiol. 1987 Feb 1; 59(4):256-62.
- Time domain, geometrical and frequency domain analysis of cardiac vagal outflow: effects of various respiratory patterns. Penttilä J, Helminen A, Jartti T, Kuusela T, Huikuri HV, Tulppo MP, Coffeng R, Scheinin H. Clin Physiol. 2001 May; 21(3):365-76.
- RMSSD, a measure of vagus-mediated heart rate variability, is associated with risk factors for SUDEP: the SUDEP-7 Inventory. DeGiorgio CM, Miller P, Meymandi S, Chin A, Epps J, Gordon S, Gornbein J, Harper RM. Epilepsy Behav. 2010 Sep; 19(1):78-81.
- Dynamic heart rate variability: a tool for exploring sympathovagal balance continuously during sleep in men. Otzenberger H, Gronfier C, Simon C, Charloux A, Ehrhart J, Piquard F, Brandenberger G. Am J Physiol. 1998 Sep; 275(3):H946-50.
- ELECTRONIC EVALUATION OF THE FETAL HEART RATE. VIII. PATTERNS PRECEDING FETAL DEATH, FURTHER OBSERVATIONS. HON EH, LEE ST. Am J Obstet Gynecol. 1963 Nov 15; 87():814-26.
- Mortality in diabetic autonomic neuropathy. Ewing DJ, Campbell IW, Clarke BF. Lancet. 1976 Mar 20; 1(7960):601-3.
- Heart rate variability from short electrocardiographic recordings predicts mortality from all causes in middle-aged and elderly men. The Zutphen Study. Dekker JM, Schouten EG, Klootwijk P, Pool J, Swenne CA, Kromhout D. Am J Epidemiol. 1997 May 15; 145(10):899-908.
- Power spectrum analysis and cardiovascular morbidity in anxiety disorders. Cohen H, Benjamin J. Auton Neurosci. 2006 Jul 30; 128(1-2):1-8.
- Cardiac autonomic balance versus cardiac regulatory capacity. Berntson GG, Norman GJ, Hawkley LC, Cacioppo JT. Psychophysiology. 2008 Jul; 45(4):643-52.
- Brain size, sex, and the aging brain. Jäncke L, Mérillat S, Liem F, Hänggi J. Hum Brain Mapp. 2015 Jan; 36(1):150-69.
- Gevirtz R. (2013). The promise of heart rate variability biofeedback: evidence-based applications. Biofeedback 41, 110–120 10.5298/1081-5937-41.3.01
- Restoration of vagal tone: a possible mechanism for functional abdominal pain. Sowder E, Gevirtz R, Shapiro W, Ebert C. Appl Psychophysiol Biofeedback. 2010 Sep; 35(3):199-206.
- Physiology and immunology of the cholinergic antiinflammatory pathway. Tracey KJ. J Clin Invest. 2007 Feb; 117(2):289-96.
- Influence of acute epinephrine infusion on endotoxin-induced parameters of heart rate variability: a randomized controlled trial. Jan BU, Coyle SM, Oikawa LO, Lu SE, Calvano SE, Lehrer PM, Lowry SF. Ann Surg. 2009 May; 249(5):750-6.
- Voluntarily produced increases in heart rate variability modulate autonomic effects of endotoxin induced systemic inflammation: an exploratory study. Lehrer P, Karavidas MK, Lu SE, Coyle SM, Oikawa LO, Macor M, Calvano SE, Lowry SF. Appl Psychophysiol Biofeedback. 2010 Dec; 35(4):303-15.
- Hypertension, blood pressure, and heart rate variability: the Atherosclerosis Risk in Communities (ARIC) study. Schroeder EB, Liao D, Chambless LE, Prineas RJ, Evans GW, Heiss G. Hypertension. 2003 Dec; 42(6):1106-11.
- Lehrer P. M. (2013). How does heart rate variability biofeedback work? Resonance, the baroreflex, and other mechanisms. Biofeedback 41, 26–31 10.5298/1081-5937-41.1.02
- Reineke A. (2008). The effects of heart rate variability biofeedback in reducing blood pressure for the treatment of essential hypertension. Diss. Abstr. Int. Sec. B Sci. Eng. 68, 4880
- Coherence: a novel nonpharmacological modality for lowering blood pressure in hypertensive patients. Alabdulgader AA. Glob Adv Health Med. 2012 May; 1(2):56-64.


