close

Food Additives

Food Additives

Lithium orotate

lithium orotate

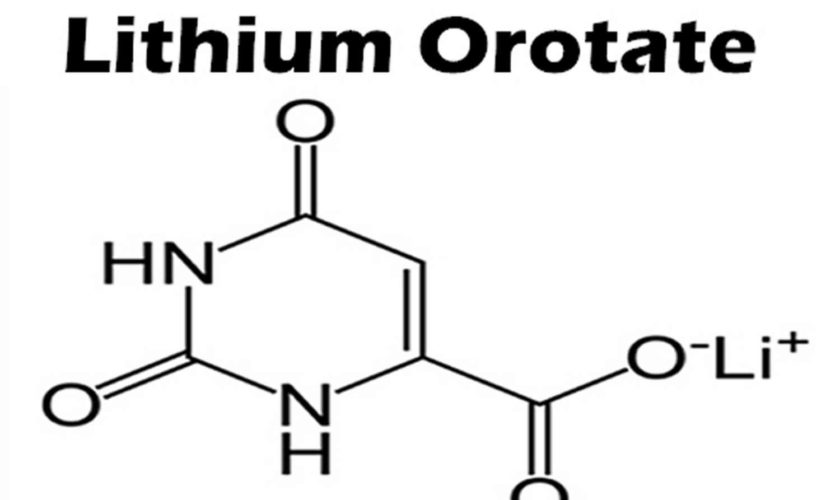
What is lithium orotate

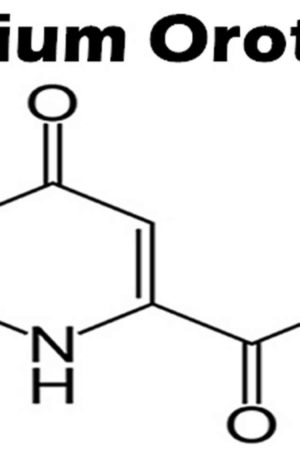
Lithium orotate is a salt of orotic acid and lithium. Lithium orotate is widely available over the internet and marketed as a dietary supplement for conditions such as bipolar disorder, alcoholism, and aggression, although it is NOT U.S. Food and Drug Administration (FDA) approved for the treatment of any medical condition. Lithium orotate is available in some drug stores and health food stores under various brand names. Lithium orotate are advertised without regulation, and they are purchased and used without medical supervision or monitoring. The widespread availability of herbal and “dietary supplement” products from internet sources has increased the potential for poisonings. Patients who obtain Lithium orotate are subject to toxicity, drug-drug interactions, and other adverse effects.

  • Proper medical diagnosis and a clear description of all possible treatment options should always be the first plan of action when treating mental disorders.

While lithium orotate is capable of providing lithium to the body, like lithium carbonate and other lithium salts, there are no systematic clinical study reviews supporting the efficacy of lithium orotate and it is only barely researched between 1973–1986 to treat certain medical conditions, such as alcoholism 1.

Animal models suggest that lithium orotate has similar pharmacokinetics, but the lithium orotate may achieve higher tissue concentrations at the same dosages than commonly prescribed for lithium carbonate and lithium citrate formulations 2. This may be secondary to lower renal clearance of the lithium orotate salt 3.

In 1973, Nieper 4 reported that lithium orotate contained 3.83 mg of elemental lithium per 100 mg and lithium carbonate contained 18.8 mg of elemental lithium per 100 mg. Nieper went on to claim that lithium did not dissolve from the orotate carrier until it passed through the blood–brain barrier 4; however, a 1976 study documented that lithium concentrations within the brains of rats were not statistically different between equivalent dosages of lithium from lithium orotate, lithium carbonate, or lithium chloride 5. While this study was conducted with rats, it directly contradicts the aforementioned assumptions made by Nieper and others 5. The pharmacokinetics of lithium orotate in human brains is poorly documented and further inquiry is needed to affirm that lithium concentrations in the brain are higher with lithium orotate. Major medical research has not been conducted on lithium orotate since the 1980s due to its patent status and the abundant availability of lithium carbonate. As previously stated, lithium intake appears to be effective even at low doses, and this may account for lithium orotates claimed effectiveness 6.

Do not use lithium without telling your doctor if you are pregnant. It could cause harm to the unborn baby. Use an effective form of birth control, and tell your doctor if you become pregnant during treatment. Early voluntary reports to international birth registries suggested an increase in cardiovascular malformations, especially for Ebstein’s anomaly, with first trimester use of Lithium. Subsequent case-control and cohort studies indicate that the increased risk for cardiac malformations is likely to be small; however, the data are insufficient to establish a drug-associated risk. There are concerns for maternal and/or neonatal Lithium toxicity during late pregnancy and the postpartum period. Published animal developmental and toxicity studies in mice and rats report an increased incidence of fetal mortality, decreased fetal weight, increased fetal skeletal abnormalities, and cleft palate (mouse fetuses only) with oral doses of Lithium that produced serum concentrations similar to the human therapeutic range. Other published animal studies report adverse effects on embryonic implantation in rats after Lithium administration. The background risk of major birth defects and miscarriage for the indicated population(s) is unknown. In the U.S. general population, the estimated background risk of major birth defects and miscarriage in clinically recognized pregnancies is 2-4% and 15-20%, respectively.

You should not breast-feed while using this medicine. Limited published data reports the presence of Lithium carbonate in human milk with breast milk levels measured at 0.12 to 0.7 mEq or 40 to 45% of maternal plasma levels. Infants exposed to Lithium during breastfeeding may have plasma levels that are 30 to 40% of maternal plasma levels. Signs and symptoms of Lithium toxicity such as hypertonia, hypothermia, cyanosis, and ECG changes have been reported in some breastfed neonates and infants. Increased prolactin levels have been measured in lactating women, but the effects on milk production are not known. Breastfeeding is not recommended with maternal Lithium use; however, if a woman chooses to breastfeed, the infant should be closely monitored for signs of Lithium toxicity. Discontinue breastfeeding if a breastfed infant develops Lithium toxicity. Consider regular monitoring of Lithium levels and thyroid function in a breastfed infant.

Is lithium orotate safe?

Lithium orotate’s safety remains in question. There have been numerous case reports of patients requiring medical attention after taking lithium orotate supplements 7, 8, 9.

Orotic acid can be mutagenic in mammalian somatic cells. It is also mutagenic for bacteria and yeast 10.

An 18-year-old woman presented to our emergency department after ingesting 18 tablets of Find Serenity Now®; each tablet contained, according to the listing, 120 mg of lithium orotate [3.83 mg of elemental lithium per 100 mg of (organic) lithium orotate compared to 18.8 mg of elemental lithium per 100 mg of (inorganic) lithium carbonate] 7. The patient complained of nausea and reported one episode of emesis (vomiting). Her examination revealed normal vital signs. The only finding was a mild tremor without rigidity. Almost 90 minutes after the ingestion, her serum lithium level was 0.31 mEq/L, a urine drug screen was negative, and an electrocardiogram (ECG) showed a normal sinus rhythm. The patient received intravenous fluids and an anti-emetic; one hour later, her repeat serum lithium level was 0.40 mEq/L. After 3 hours of observation, nausea and tremor were resolved, and she was subsequently transferred to a psychiatric hospital for further care.

Lithium’s widespread use and its narrow therapeutic index can lead to adverse effects in up to 90% of all users 11. Most toxicity is mild and includes lethargy, vomiting, ataxia, and myoclonus, but massive, acute ingestions or severe chronic toxicity can lead to coma or seizures 7. Other adverse effects include thyroid and parathyroid abnormalities, serotonergic crisis, cardiovascular abnormalities, and nephrogenic diabetes insipidus 12.

Onset and severity of symptoms vary upon the timing of ingestion and product formulation. The risk of toxicity increases with increased age, renal insufficiency, hyponatremia, volume depletion, drug-drug interactions, and comorbidities or co-ingestions 13. Significant toxicity tends to occur when levels are well above the upper therapeutic level (1.5 mEq/L); however, lithium’s variable absorption and delayed tissue concentrations make interpretation of serum levels difficult. Toxicity may also occur at lower levels, especially in the setting of chronic use 14.

Lithium orotate vs Lithium carbonate

Lithium Carbonate is a white, light, alkaline powder with molecular formula Li2CO3 and molecular weight 73.89. Lithium Carbonate is the carbonate salt of lithium, a soft alkali metal, with antimanic and hematopoietic activities. Lithium interferes with transmembrane sodium exchange in nerve cells by affecting sodium, potassium-stimulated adenosine triphosphatase (Na+, K+-ATPase); alters the release of neurotransmitters; affects cyclic adenosine monophosphate (cAMP) concentrations; and blocks inositol metabolism resulting in depletion of cellular inositol and inhibition of phospholipase C-mediated signal transduction. While lithium has no psychotropic effects in normal individuals, it has potent mood stabilizing properties in patients with bipolar disorders, mania and recurrent depression. The mechanism of action of lithium is unknown, but is thought to be mediated by its replacement of sodium ions and disruption of membrane potentials in the central nervous system. It may also act by differential effects on neurotransmitter induced depolarization of membranes or interference with phosphatidylinositol pathways. In addition, lithium stimulates granulocytopoiesis and appears to increase the level of pluripotent hematopoietic stem cells by stimulating the release of hematopoietic cytokines and/or directly acting on hematopoietic stem cells.

Lithium was approved for use in bipolar illness for the treatment of mania for more than 50 years in the United States since 1970 and it is still widely used for this indication. Manic symptoms include hyperactivity, rushed speech, poor judgment, reduced need for sleep, aggression, and anger. Lithium also helps to prevent or lessen the intensity of manic episodes. Lithium has also been used in therapy of schizophrenia, alcohol dependence, attention deficit disorder and migraine headaches. Lithium is available as capsules or tablets of 150, 300, 450 and 600 mg in generic forms as well in several brand names including Carbolith, Duralith and Eskalith. A typical maintenance dose regimen is 600 to 900 mg daily. Lithium levels are generally monitored because of the narrow therapeutic window between toxicity and effectiveness aiming for levels between 0.6 and 1.2 mEq/L in chronic situations (higher in acute). Common side effects include metallic taste, nausea, tremor, polyuria, polydipsia and weight gain. Uncommon side effects include hypothyroidism.

Concurrent administration of lithium carbonate and potassium iodide or other iodine-containing compounds may enhance hypothyroid and goitrogenic effects of either drug 15.

Lithium can cause side effects that may impair your thinking or reactions. Be careful if you drive or do anything that requires you to be awake and alert.

Call your doctor at once if you have any early signs of lithium toxicity, such as nausea, vomiting, diarrhea, drowsiness, muscle weakness, tremor, lack of coordination, blurred vision, or ringing in your ears.

Lithium is not approved for use by anyone younger than 12 years old.

Liver test abnormalities have been reported to occur in a small proportion of patients on long term therapy with lithium. These abnormalities are usually asymptomatic and transient, reversing even with continuation of medication. Instances of more marked elevations in serum aminotransferases have been reported in patients taking overdoses of lithium, but the other metabolic and systemic effects of lithium overdose generally overshadow hepatic adverse effects. Lithium has not been associated with instances of clinically apparent acute liver injury with jaundice.

Before taking lithium

You should not use lithium if you are allergic to it.

Lithium may be used to treat manic episodes associated with bipolar disorder; however, there is a fine line between too much and too little and ongoing monitoring is needed to prevent lithium toxicity.

Obtain serum Lithium concentration assay after 4 days, drawn 12 hours after the last oral dose. Adjust daily dosage based on serum Lithium concentration and clinical response. Fine hand tremor, polyuria and mild thirst may occur during initial therapy for the acute manic phase, and may persist throughout treatment. Transient and mild nausea and general discomfort may also appear during the first few days of Lithium administration. These adverse reactions may subside with continued treatment, concomitant administration with food, temporary reduction or cessation of dosage.

  • Lithium is usually taken two to three times daily with food.
  • There is a fine line between too much and too little lithium. Always take lithium exactly as directed and go to your scheduled appointments. Never take any herbal supplements or over the counter remedies without consulting your doctor or pharmacist first as many drugs may affect blood levels of lithium.
  • If you miss a dose of lithium, take it as soon as you remember. If it is close to your next dose, do not double up on the dose.
  • Do not crush or chew extended-release tablets; swallow whole.
  • Too much caffeine may decrease the amount of lithium in your body.
  • Lithium may affect your mental alertness or make you drowsy. Do not drive until you know how lithium will affect you. Avoid alcohol.
  • Ensure you keep adequately hydrated while taking lithium and maintain an adequate salt intake (your doctor will discuss this requirement). The risk of side effects of lithium is increased if you are dehydrated, or if you are excessively hydrated. Excessive sweating or diarrhea may also upset the balance of lithium in the blood.
  • Contact your doctor if you become ill or have an infection as your dosage of lithium may need to be altered or temporarily discontinued.
  • Seek urgent medical attention if symptoms similar to diabetes (such as excessive thirst or excessive urine production), or serotonin syndrome ( occur.
  • Stop lithium and contact your doctor urgently if symptoms of lithium toxicity such as diarrhea, vomiting, tremor, drowsiness, muscle weakness or confusion occur.
  • Seek urgent medical advice if symptoms consistent with serotonin syndrome (such as agitation, hallucinations, fast heart rate, dizziness, flushing, nausea, diarrhea) develop.
  • You will need to go for regular blood tests while you are taking lithium to ensure that the dosage is appropriate for you.
  • May affect your mental and physical abilities so be careful driving or operating machinery until you know how lithium affects you.
  • Do not take any other medications, including those bought over the counter, without first checking with your doctor or pharmacist that they are compatible with lithium.

Tell your doctor if you have ever had:

  • an abnormal electrocardiograph or ECG (sometimes called an EKG);
  • fainting spells;
  • a family history of death before age 45;
  • kidney disease;
  • heart disease;
  • a debilitating illness;
  • a thyroid disorder;
  • low levels of sodium in your blood; or
  • if you are dehydrated.

Some medicines can interact with lithium and cause a serious condition called serotonin syndrome. Be sure your doctor knows if you also take stimulant medicine, opioid medicine, herbal products, or medicine for depression, mental illness, Parkinson’s disease, migraine headaches, serious infections, or prevention of nausea and vomiting. Ask your doctor before making any changes in how or when you take your medications.

Other drugs that will affect lithium

Tell your doctor about all your current medicines. Many drugs can interact with lithium, especially:

  • a diuretic or “water pill”;
  • fluoxetine (Prozac);
  • metronidazole;
  • potassium iodide thyroid medication;
  • heart or blood pressure medication;
  • seizure medicine; or
  • nonsteroidal anti-inflammatory drugs – aspirin, ibuprofen (Advil, Motrin), naproxen (Aleve), celecoxib, diclofenac, indomethacin, meloxicam, and others.

This list is not complete and many other drugs may interact with lithium. This includes prescription and over-the-counter medicines, vitamins, and herbal products. Not all possible drug interactions are listed here.

How long does it take for lithium to work?

A reduction in manic symptoms should be noticed within one to three weeks. Your doctor will determine if your symptoms have improved enough to warrant lithium long-term.

Lithium is completely absorbed in the gastrointestinal tract with peak levels occurring 0.25 to 3 hours after oral administration of immediate-release preparations and two to six hours after sustained-release preparations.

Lithium dosing information

Adult Dose of Lithium for Mania

Comments:

  • Dosing must be individualized according to serum levels and the response to treatment.
  • Obtain serum Lithium concentrations regularly until the serum concentration and clinical condition of the patient has stabilized. Adjust daily dosage based on serum Lithium concentration and clinical response.
  • Alternative extended release formulation doses are 600 mg 3 times a day (acute control) and 300 mg 3 to 4 times a day (long-term control).

Uses:

  • Treatment of manic episodes of bipolar disorder
  • Maintenance treatment for individuals with bipolar disorder

Acute Control:

  • Titrate to serum Lithium concentrations between 0.8 and 1.2 mEq/L.
  • Usual dose: 1800 mg/day
  • Extended release formulations: 900 mg orally in the morning and at nighttime
  • Regular release formulations: 600 mg orally 3 times a day, in the morning, afternoon, and nighttime

Long-term Control:

  • Titrate to serum Lithium concentrations between 0.8 and 1 mEq/L
  • Maintenance dose: 900 to 1200 mg/day
  • Extended release formulations: 600 mg orally in the morning and at nighttime
  • Regular release formulations: 300 mg orally 3 to 4 times a day

Adult Dose of Lithium for Bipolar Disorder

Comments:

  • Dosing must be individualized according to serum levels and the response to treatment.
  • Alternative extended release formulation doses are 600 mg 3 times a day (acute control) and 300 mg 3 to 4 times a day (long-term control).

Uses:

  • Treatment of manic episodes of bipolar disorder
  • Maintenance treatment for individuals with bipolar disorder

Acute Control:

  • Usual dose: 1800 mg/day
  • Extended release formulations: 900 mg orally in the morning and at nighttime
  • Regular release formulations: 600 mg orally 3 times a day, in the morning, afternoon, and nighttime

Long-term Control:

  • Maintenance dose: 900 to 1200 mg/day
  • Extended release formulations: 600 mg orally in the morning and at nighttime
  • Regular release formulations: 300 mg orally 3 to 4 times a day

Pediatric 12 years and older dose of Lithium for Mania

Comments:

  • Dosing must be individualized according to serum levels and the response to treatment.
  • Alternative extended release formulation doses are 600 mg 3 times a day (acute control) and 300 mg 3 to 4 times a day (long-term control).
  • Maintenance therapy reduces the frequency of manic episodes and diminishes the intensity of the episodes.

Uses:

  • Treatment of manic episodes of bipolar disorder
  • Maintenance treatment for individuals with bipolar disorder

12 years and older acute control:

Usual dose: 1800 mg/day

  • Extended release formulations: 900 mg orally in the morning and at nighttime
  • Regular release formulations: 600 mg orally 3 times a day, in the morning, afternoon, and nighttime

Long-term Control:

  • Maintenance dose: 900 to 1200 mg/day
  • Extended release formulations: 600 mg orally in the morning and at nighttime
  • Regular release formulations: 300 mg orally 3 to 4 times a day

Pediatric 12 years and older dose of Lithium for Bipolar Disorder

Comments:

  • Dosing must be individualized according to serum levels and the response to treatment.
  • Alternative extended release formulation doses are 600 mg 3 times a day (acute control) and 300 mg 3 to 4 times a day (long-term control).
  • Maintenance therapy reduces the frequency of manic episodes and diminishes the intensity of the episodes.

Uses:

  • Treatment of manic episodes of bipolar disorder
  • Maintenance treatment for individuals with bipolar disorder

12 years and older acute control:

  • Usual dose: 1800 mg/day
  • Extended release formulations: 900 mg orally in the morning and at nighttime
  • Regular release formulations: 600 mg orally 3 times a day, in the morning, afternoon, and nighttime

Long-term Control:

  • Maintenance dose: 900 to 1200 mg/day
  • Extended release formulations: 600 mg orally in the morning and at nighttime
  • Regular release formulations: 300 mg orally 3 to 4 times a day

Lithium side effects

Get emergency medical help if you have signs of an allergic reaction to lithium: hives; difficulty breathing; swelling of your face, lips, tongue, or throat.

If you are between the ages of 18 and 60, take no other medication or have no other medical conditions, side effects you are more likely to experience include:

  • Fine hand tremor, frequent urination, and mild thirst commonly occur during lithium initiation. Sometimes these effects may persist throughout treatment.
  • Nausea during initiation is common but usually subsides with continued administration.
  • Diarrhea, vomiting, drowsiness, muscular weakness, loss of appetite and coordination difficulties may be an early sign of lithium toxicity. Dizziness, blurred vision, ringing in the ears and excessive production of dilute urine may occur with higher (toxic) lithium levels. Seek urgent medical advice.
  • Lithium may also cause irregular heartbeat, drying and thinning of hair, alopecia, dry mouth, weight gain, itchiness, and other side effects. Long-term use may lead to hypothyroidism or other thyroid problems.
  • Dosing may be difficult because there is not much of a margin between an adequate dose of lithium and a toxic dose.
  • Monitoring is required, particularly during therapy initiation but also long-term.
  • Not suitable for people with significant renal or cardiovascular disease, in those who are frail, dehydrated, taking diuretics or with low levels of sodium. Not recommended for children aged less than 12.
  • Full effects of lithium in pregnancy have not been fully determined so advice is to avoid lithium, particularly in the first trimester.
  • May interact with several other medications including diuretics (water pills), NSAIDs and ACE inhibitors.
  • Interaction or overdosage may cause serotonin syndrome (symptoms include mental status changes [such as agitation, hallucinations, coma, delirium]), fast heart rate, dizziness, flushing, muscle tremor or rigidity and stomach symptoms (including nausea, vomiting, and diarrhea).

Notes: In general, seniors or children, people with certain medical conditions (such as liver or kidney problems, heart disease, diabetes, seizures) or people who take other medications are more at risk of developing a wider range of side effects.

Call your doctor at once if you have:

  • a light-headed feeling, like you might pass out;
  • irregular heartbeats, shortness of breath;
  • fever, increased thirst or urination;
  • weakness, dizziness or spinning sensation;
  • confusion, memory problems, hallucinations;
  • uncontrolled muscle movements, slurred speech;
  • loss of bowel or bladder control;
  • a seizure (blackout or convulsions);
  • dehydration symptoms – feeling very thirsty or hot, being unable to urinate, heavy sweating, or hot and dry skin; or
  • increased pressure inside the skull – severe headaches, ringing in your ears, dizziness, nausea, vision problems, pain behind your eyes.

Seek medical attention right away if you have symptoms of serotonin syndrome, such as: agitation, hallucinations, fever, sweating, shivering, fast heart rate, muscle stiffness, twitching, loss of coordination, nausea, vomiting, or diarrhea.

Common lithium side effects may include:

  • drowsiness;
  • tremors in your hands;
  • dry mouth, increased thirst or urination;
  • nausea, vomiting, loss of appetite, stomach pain;
  • changes in your skin or hair;
  • cold feeling or discoloration in your fingers or toes;
  • feeling uneasy; or
  • impotence, loss of interest in sex.

This is not a complete list of side effects and others may occur. Call your doctor for medical advice about side effects.

Nervous system

Frequency not reported: Abnormal reflex convulsions, acute dystonia, ataxia, benign intracranial hypertension, blackout spells, choreoathetotic movements, cerebellar syndrome, clonic movements of whole limbs, coarse tremor of the extremities and lower jaw, cogwheel rigidity, coma, convulsions, diffuse slowing of EEG, dizziness, downbeat nystagmus, drowsiness, dysarthria, dysgeusia/taste distortion, encephalopathy, encephalopathic syndrome, epileptiform seizures, extrapyramidal syndrome, fine hand tremor, giddiness, headache, hyperactive deep tendon reflexes, hypertonicity, impaired consciousness, lack of coordination, lethargy, metallic/salty taste, myoclonus, nystagmus, peripheral sensorimotor neuropathy, poor memory, potentiation and disorganization of EEG background rhythm, pseudotumor cerebri (increased intracranial pressure and papilledema), psychomotor retardation, seizures, serotonin syndrome, slowed intellectual functioning, slurred speech/speech disorder, somnolence, startle response, stupor, tendency to sleep, tongue movements, transient electroencephalogram (EEG), tremor, vertigo, widening of EEG frequency spectrum

  • Drowsiness and lack of coordination may be early signs of lithium toxicity, and may occur at lithium levels below 2 mEq/L.
  • Ataxia and giddiness occurred at levels above 2 mEq/L.
  • Fine hand tremor may occur during initial therapy for the acute manic phase, and may persist during therapy.
  • The development of transient EEG changes, headache, dysgeusia/taste distortion, and metallic taste were unrelated to dosage.
  • Peripheral neuropathy may occur in patients on long-term treatment, but is usually reversible after discontinuation of therapy.

Cardiovascular

The development of transient ECG changes, chest tightness, and edematous swelling of ankles/wrists were unrelated to dosage.

Painful discoloration of the fingers/toes and coldness of extremities (resembling Raynaud’s syndrome) occurred within one day of initiation; the patient recovered after discontinuation. The exact mechanism for this side effect is unknown.

Frequency not reported: Atrioventricular block, bradycardia, cardiac arrhythmia, cardiomyopathy, chest tightness, conduction disturbance, ECG changes, edema, hypotension, inversion of T-waves, isoelectricity of ECG, peripheral circulatory collapse, peripheral edema/edematous swelling of ankles or wrists, peripheral vasculopathy, QT prolongation, Raynaud’s phenomena/syndrome, reversible flattening of ECG, sinus node dysfunction with severe bradycardia and/or sinoatrial block (may result in syncope), transient ECG changes, unmasking of Brugada syndrome, ventricular tachyarrhythmia

Gastrointestinal

Frequency not reported: Abdominal pain/discomfort, constipation, dental caries, diarrhea, dry mouth, excessive salivation, flatulence, gastritis, incontinence of feces, indigestion, nausea/transient and mild nausea, salivary gland swelling, swollen lips, vomiting

  • Diarrhea and vomiting may be early signs of lithium toxicity, and may occur at lithium levels below 2 mEq/L.
  • Transient and mild nausea may occur within the first few days of therapy.
  • The development of metallic/salty taste, dental caries, and swollen lips were unrelated to dosage.

Dermatologic

Frequency not reported: Acne/acneform eruptions, alopecia, anesthesia of skin, chronic folliculitis/folliculitis, cutaneous ulcers, drying and thinning of hair, generalized pruritus with/without rash, papular skin disorders, pruritus, psoriasis onset/exacerbation, urticaria, xerosis cutis

The development of generalized pruritus with/without rash and cutaneous ulcers were unrelated to dosage.

Endocrine

Frequency not reported: Diffuse nontoxic goiter with/without hypothyroidism, euthyroid goiter, hyperparathyroidism, hyperthyroidism, hypothyroidism (including myxedema), iodine 131 uptake increased, lower T3 and T4 levels, thyrotoxicosis

Hyperthyroidism has been rarely reported, and may persist after discontinuation of treatment.

Hyperparathyroidism may persist after discontinuation of treatment.

The development of diffuse nontoxic goiter with/without hypothyroidism and hyperparathyroidism were unrelated to dosage.

Musculoskeletal

Muscular weakness develops early in lithium toxicity, and may occur at lithium levels below 2 mEq/L.

Muscle hyperirritability includes fasciculations, twitching, clonic movements of whole limbs.

The development of swollen/painful joints and polyarthralgia were unrelated to dosage.

Frequency not reported: Arthralgia/polyarthralgia, muscle hyperirritability, muscular weakness, myalgia, myasthenia gravis, myoclony, rhabdomyolysis, swollen/painful joints, twitching

Renal

Frequency not reported: Decreased creatinine clearance, glycosuria, histological renal changes with interstitial fibrosis, lithium-induced chronic kidney disease, microcysts, nephrogenic diabetes insipidus, nephrotic syndrome, oliguria, renal dysfunction

Diabetes insipidus may persist after discontinuation of treatment.

Histological renal changes with interstitial fibrosis occurred in patients on prolonged treatment, and was usually reversible upon discontinuation. Long-term treatment may cause permanent kidney changes and impairment of renal function; high serum concentrations and/or acute lithium toxicity may worsen these changes.

Metabolic

Frequency not reported: Anorexia, dehydration, excessive weight gain, hypercalcemia, hypermagnesemia, hyponatremia, polydipsia, thirst/mild thirst, transient hyperglycemia/hyperglycemia, weight loss

The development of transient hyperglycemia, hypercalcemia, and excessive weight gain were unrelated to dosage.

Other side effects

Tinnitus occurred at levels above 2 mEq/L.

Mild thirst may occur during initial therapy for the acute manic phase, and may persist during therapy; in some cases, thirst resembled diabetes insipidus. The development of thirst was unrelated to dosage.

General discomfort may also appear within the first few days of therapy.

The development of fever was unrelated to dosage.

Frequency not reported: Fall, fasciculations, fatigue, feeling dazed, fever, general discomfort, lithium toxicity, tinnitus

Genitourinary

Frequency not reported: Albuminuria, impotence/sexual dysfunction, incontinence of urine, large output of dilute urine, lithium-induced polyuria/polyuria

At levels above 2 mEq/L, patients excreted a large output of dilute urine.

Polyuria may occur during initial therapy for the acute manic phase, and may persist during therapy; in some cases, polyuria resembled diabetes insipidus. The development of polyuria was unrelated to dosage.

The development of albuminuria was unrelated to dosage.

Psychiatric

Frequency not reported: Confusion, delirium, hallucinations, restlessness, tics, worsening of organic brain syndromes

The worsening of organic brain syndromes was unrelated to dosage.

Hypersensitivity

Frequency not reported: Allergic rashes, angioedema

Ocular

Frequency not reported: Blindness, blurred vision, enlargement of the blind spot, exophthalmos, optic atrophy, transient scotomata/scotoma, visual field constriction

Blurred vision occurred at levels above 2 mEq/L.

Oncologic

Frequency not reported: Collecting duct renal carcinoma, oncocytoma

Collecting duct renal carcinoma occurred in patients on long-term therapy.

Hematologic

Frequency not reported: Leukocytosis

The development of leukocytosis was unrelated to dosage.

Lithium-Induced Polyuria

Chronic Lithium treatment may be associated with diminution of renal concentrating ability, occasionally presenting as nephrogenic diabetes insipidus, with polyuria and polydipsia. The concentrating defect and natriuretic effect characteristic of this condition may develop within weeks of Lithium initiation. Lithium can also cause renal tubular acidosis, resulting in hyperchloremic metabolic acidosis. Such patients should be carefully managed to avoid dehydration with resulting Lithium retention and toxicity. This condition is usually reversible when Lithium is discontinued, although for patients treated with long-term Lithium, nephrogenic diabetes insipidus may be only partly reversible upon discontinuation of Lithium. Amiloride may be considered as a therapeutic agent for Lithium-induced nephrogenic diabetes insipidus.

Hyponatremia

Lithium can cause hyponatremia by decreasing sodium reabsorption by the renal tubules, leading to sodium depletion. Therefore, it is essential for patients receiving Lithium treatment to maintain a normal diet, including salt, and an adequate fluid intake (2500 to 3000 mL) at least during the initial stabilization period. Decreased tolerance to Lithium has also been reported to ensue from protracted sweating or diarrhea and, if such occur, supplemental fluid and salt should be administered under careful medical supervision and Lithium intake reduced or suspended until the condition is resolved. In addition, concomitant infection with elevated temperatures may also necessitate a temporary reduction or cessation of medication.

Symptoms are also more severe with faster-onset hyponatremia. Mild hyponatremia (i.e., serum Na > 120 mEq/L) can be asymptomatic. Below this threshold, clinical signs are usually present, consisting mainly of changes in mental status, such as altered personality, lethargy, and confusion. For more severe hyponatremia (serum Na < 115 mEq/L), stupor, neuromuscular hyperexcitability, hyperreflexia, seizures, coma, and death can result. During treatment of hyponatremia, serum sodium should not be elevated by more than 10 to 12 meq/L in 24 hours, or 18 meq/L in 48 hours. In the case of severe hyponatremia where severe neurologic symptoms are present, a faster infusion rate to correct serum sodium concentration may be needed. Patients rapidly treated or with serum sodium <120mEq/L are more at risk of developing osmotic demyelination syndrome (previously called central pontine myelinolysis). Occurrence is more common among patients with alcoholism, undernutrition, or other chronic debilitating illness. Common signs include flaccid paralysis, dysarthria. In severe cases with extended lesions patients may develop a locked-in syndrome (generalized motor paralysis). Damage often is permanent. If neurologic symptoms start to develop during treatment of hyponatremia, serum sodium correction should be suspended to mitigate the development of permanent neurologic damage.

Lithium-Induced Chronic Kidney Disease

The predominant form of chronic renal disease associated with long-term Lithium treatment is a chronic tubulointerstitial nephropathy. The biopsy findings in patients with Lithium induced chronic tubulointerstitial nephropathy include tubular atrophy, interstitial fibrosis, sclerotic glomeruli, tubular dilation, and nephron atrophy with cyst formation. The relationship between renal function and morphologic changes and their association with Lithium treatment has not been established. Chronic tubulointerstitial nephropathy patients might present with nephrotic proteinuria (>3.0g/dL), worsening renal insufficiency and/or nephrogenic diabetes insipidus. Postmarketing cases consistent with nephrotic syndrome in patients with or without chronic tubulointerstitial nephropathy have also been reported. The biopsy findings in patients with nephrotic syndrome include minimal change disease and focal segmental glomerulosclerosis. The discontinuation of Lithium in patients with nephrotic syndrome has resulted in remission of nephrotic syndrome.

Kidney function should be assessed prior to and during Lithium treatment. Routine urinalysis and other tests may be used to evaluate tubular function (e.g., urine specific gravity or osmolality following a period of water deprivation, or 24-hour urine volume) and glomerular function (e.g., serum creatinine, creatinine clearance, or proteinuria). During Lithium treatment, progressive or sudden changes in renal function, even within the normal range, indicate the need for re­ evaluation of treatment.

Encephalopathic Syndrome

An encephalopathic syndrome, characterized by weakness, lethargy, fever, tremulousness and confusion, extrapyramidal symptoms, leukocytosis, elevated serum enzymes, BUN (blood urea nitrogen) and fasting blood glucose, has occurred in patients treated with Lithium and an antipsychotic. In some instances, the syndrome was followed by irreversible brain damage. Because of a possible causal relationship between these events and the concomitant administration of Lithium and antipsychotics, patients receiving such combined treatment should be monitored closely for early evidence of neurological toxicity and treatment discontinued promptly if such signs appear. This encephalopathic syndrome may be similar to or the same as neuroleptic malignant syndrome.

Serotonin Syndrome

Lithium can precipitate serotonin syndrome, a potentially life-threatening condition. The risk is increased with concomitant use of other serotonergic drugs (including selective serotonin reuptake inhibitors, serotonin and norepinephrine reuptake inhibitors, triptans, tricyclic antidepressants, fentanyl, tramadol, tryptophan, buspirone, and St. John’s Wort) and with drugs that impair metabolism of serotonin, i.e., MAOIs (monoamine oxidase inhibitors).

Serotonin syndrome signs and symptoms may include mental status changes (e.g., agitation, hallucinations, delirium, and coma), autonomic instability (e.g., tachycardia, labile blood pressure, dizziness, diaphoresis, flushing, hyperthermia), neuromuscular symptoms (e.g., tremor, rigidity, myoclonus, hyperreflexia, incoordination), seizures, and gastrointestinal symptoms (e.g., nausea, vomiting, diarrhea).

Monitor all patients taking Lithium for the emergence of serotonin syndrome. Discontinue treatment with Lithium and any concomitant serotonergic agents immediately if the above symptoms occur, and initiate supportive symptomatic treatment. If concomitant use of Lithium with other serotonergic drugs is clinically warranted, inform patients of the increased risk for serotonin syndrome and monitor for symptoms.

Hypothyroidism or Hyperthyroidism

Lithium is concentrated within the thyroid and can inhibit thyroid synthesis and release which can lead to hypothyroidism. Where hypothyroidism exists, careful monitoring of thyroid function during Lithium stabilization and maintenance allows for correction of changing thyroid parameters, if any. Where hypothyroidism occurs during Lithium stabilization and maintenance supplemental thyroid treatment may be used. Paradoxically, some cases of hyperthyroidism have been reported including Grave’s disease, toxic multinodular goiter and silent thyroiditis.

Monitor thyroid function before the initiation of treatment, at three months and every six to twelve months while treatment is ongoing. If serum thyroid tests warrant concern, monitoring should occur more frequently.

Hypercalcemia and Hyperparathyroidism

Long-term Lithium treatment is associated with persistent hyperparathyroidism and hypercalcemia. When clinical manifestations of hypercalcemia are present, Lithium withdrawal and change to another mood stabilizer may be necessary. Hypercalcemia may not resolve upon discontinuation of Lithium, and may require surgical intervention. Lithium-induced cases of hyperparathyroidism are more often multiglandular compared to standard cases. False hypercalcemia due to plasma volume depletion resulting from nephrogenic diabetes insipidus should be excluded in individuals with mildly increased serum calcium. Monitor serum calcium concentrations regularly.

Unmasking of Brugada Syndrome

There have been postmarketing reports of a possible association between treatment with Lithium and the unmasking of Brugada Syndrome. Brugada Syndrome is a disorder characterized by abnormal electrocardiographic (ECG) findings and a risk of sudden death. Lithium should be avoided in patients with Brugada Syndrome or those suspected of having Brugada Syndrome. Consultation with a cardiologist is recommended if: (1) treatment with Lithium is under consideration for patients suspected of having Brugada Syndrome or patients who have risk factors for Brugada Syndrome, e.g., unexplained syncope, a family history of Brugada Syndrome, or a family history of sudden unexplained death before the age of 45 years, (2) patients who develop unexplained syncope or palpitations after starting Lithium treatment.

Pseudotumor Cerebri

Cases of pseudotumor cerebri (increased intracranial pressure and papilledema) have been reported with Lithium use. If undetected, this condition may result in enlargement of the blind spot, constriction of visual fields and eventual blindness due to optic atrophy. Consider discontinuing Lithium if this syndrome occurs.

Symptoms of lithium overdose

The toxic concentrations for Lithium (≥1.5 mEq/L) are close to the therapeutic range (0.8 to 1.2mEq/L). Some patients abnormally sensitive to Lithium may exhibit toxic signs at serum concentrations that are considered within the therapeutic range.

To reduce the risk of acute Lithium toxicity during treatment initiation, facilities for prompt and accurate serum Lithium determinations should be available before initiating treatment.

Lithium may take up to 24 hours to distribute into brain tissue, so occurrence of acute toxicity symptoms may be delayed.

Diarrhea, vomiting, drowsiness, muscular weakness and lack of coordination may be early signs of Lithium toxicity, and can occur at Lithium concentrations below 2.0 mEq/L. At higher concentrations, giddiness, ataxia, blurred vision, tinnitus and a large output of dilute urine may be seen. Serum Lithium concentrations above 3.0 mEq/L may produce a complex clinical picture involving multiple organs and organ systems, coma, and eventually death. Serum Lithium concentrations should not be permitted to exceed 2.0 mEq/L.

Neurological signs of Lithium toxicity range from mild neurological adverse reactions such as fine tremor, lightheadedness, and weakness; to moderate manifestations like apathy, drowsiness, hyperreflexia, muscle twitching, and slurred speech; and severe manifestations such as clonus, confusion, seizure, coma and death. Cardiac manifestations involve electrocardiographic changes, such as prolonged QT interval, ST and T-wave changes and myocarditis. Renal manifestations include urine concentrating defect, nephrogenic diabetes insipidus, and renal failure. Respiratory manifestations include dyspnea, aspiration pneumonia, and respiratory failure. Gastrointestinal manifestations include nausea, vomiting, and bloating.

No specific antidote for Lithium poisoning is known. Early symptoms of Lithium toxicity can usually be treated by reduction or cessation of Lithium, before restarting treatment at a lower dose 24 to 48 hours later.

  • blurred vision
  • clumsiness or unsteadiness
  • convulsions (seizures)
  • diarrhea
  • drowsiness
  • increase in the amount of urine
  • lack of coordination
  • loss of appetite
  • muscle weakness
  • nausea or vomiting
  • ringing in the ears
  • slurred speech
  • trembling (severe)

The risk of acute toxicity is increased with a recent onset of concurrent illness or with the concomitant administration of drugs which increase Lithium serum concentrations by pharmacokinetic interactions. Additional risk factors for acute Lithium toxicity include acute ingestion, age-related decline in renal function, volume depletion and/or changes in electrolyte concentrations, especially sodium and potassium. Dose requirements during the acute manic phase are higher to maintain therapeutic serum concentrations and decrease when manic symptoms subside. The risk of Lithium toxicity is very high in patients with significant renal or cardiovascular disease, severe debilitation or dehydration, or sodium depletion, and for patients receiving prescribed medications that may affect kidney function, such as angiotensin converting enzyme inhibitors (ACE inhibitors), diuretics (loops and thiazides) and NSAIDs. For these patients, consider starting with lower doses and titrating slowly while frequently monitoring serum Lithium concentrations and signs of Lithium toxicity.

In severe cases of Lithium poisoning, the first and foremost goal of treatment consists of elimination of this ion from the patient. Administration of gastric lavage should be performed, but use of activated charcoal is not recommended as it does not significantly absorb Lithium ions. Hemodialysis is the treatment of choice as it is an effective and rapid means of removing Lithium in patients with severe toxicity. As an alternative option, urea, mannitol and aminophylline can induce a significant increase in Lithium excretion. Appropriate supportive care for the patient should be undertaken. In particular, patients with impaired consciousness should have their oral airway protected and it is critical to correct any volume depletion or electrolyte imbalance. Specifically, patients should be monitored to prevent hypernatremia while receiving normal saline and careful regulation of kidney function is of utmost importance.

Serum Lithium concentrations should be closely monitored as there may be a rebound in serum Lithium concentrations as a result of delayed diffusion from the body tissues. Likewise, during the late recovery phase, Lithium should be re- administered with caution taking into account the possible release of significant Lithium stores in body tissues.

References
  1. Lithium orotate in the treatment of alcoholism and related conditions. Alcohol. 1986 Mar-Apr;3(2):97-100. https://www.ncbi.nlm.nih.gov/pubmed/3718672
  2. Smith DF, Schou M. Kidney function and lithium concentrations of rats given an injection of lithium orotate or lithium carbonate. J Pharm Pharmacol. 1979;31(3):61–63.
  3. Kling MA, Manowitz P, Pollack IW. Rat brain and serum lithium concentrations after acute injections of lithium carbonate and orotate. J Pharm Pharmacol. 1978;30(6):368–370.
  4. The clinical applications of lithium orotate. A two years study. Agressologie. 1973;14(6):407-11. https://www.ncbi.nlm.nih.gov/pubmed/4607169
  5. Smith DF. Lithium orotate, carbonate and chloride: pharmacokinetics, polyuria in rats. British Journal of Pharmacology. 1976;56(4):399-402. https://www.ncbi.nlm.nih.gov/pmc/articles/PMC1666891/pdf/brjpharm00512-0006.pdf
  6. Low dosage lithium augmentation in venlafaxine resistant depression: an open-label study. Psychiatriki. 2012 Apr-Jun;23(2):143-8. https://www.ncbi.nlm.nih.gov/pubmed/22796912
  7. Pauzé DK, Brooks DE. Lithium toxicity from an internet dietary supplement. Journal of Medical Toxicology. 2007;3(2):61-62. doi:10.1007/BF03160910. https://www.ncbi.nlm.nih.gov/pmc/articles/PMC3550087/pdf/13181_2009_Article_BF03160910.pdf
  8. Possible dangers of a “nutritional supplement” lithium orotate. Ann Clin Psychiatry. 2013 Feb;25(1):71. https://www.ncbi.nlm.nih.gov/pubmed/23376874
  9. Kwan, D.; Beyene, J.; Shah, P. S. (1 November 2009). “Adverse Consequences of Internet Purchase of Pharmacologic Agents or Dietary Supplements”. Journal of Pharmacy Technology. 25 (6): 355–360.  https://doi.org/10.1177/875512250902500602
  10. Orotic Acid, anhydrous MSDS. http://www.sciencelab.com/msds.php?msdsId=9926339
  11. Chen KP, Shen W, Lu ML. Implication of serum concentration monitoring in patients with lithium intoxication. Psychiatry and Clinical Neurosciences. 2004;58:25–29.
  12. Oakley P, Whyte I, Carter G. Lithium toxicity: An iatrogenic problem in susceptible individuals. Australian and New Zealand J of Psychiatry. 2001;35:833.
  13. Okusa MD, Crystal LJT. Clinical manifestations and management of acute lithium intoxication. American J of Med. 1994;97:383–388.
  14. Astruc B, Petit P, Abbar M. Overdose with sustainedrelease lithium preparations. EUR Psychiatry. 1999;14:172–174.
  15. Evaluations of Drug Interactions. 2nd ed. and supplements. Washington, DC: American Pharmaceutical Assn., 1976, 1978., p. 140
read more
Food Additives

Guar gum

guar gum

What is guar gum

Guar gum also called guaran, guar flour or Gum cyamopsis, is mainly consisting of high molecular weight (50,000-8,000,000) polysaccharides composed of galactomannan with the mannose:galactose ratio about 2:1. Guar gum is extracted from the endosperm of the seed (guar beans) of the guar plant (Cyamopsis tetragonoloba L. Taub syn. Cyamopsis psoraloides) that has thickening and stabilizing properties useful in the food, feed and industrial applications. Guar gum is used as thickener, stabilizer and emulsifier, and approved in most areas of the world (e.g. EU, USA, Japan, and Australia). Guar gum food additive is E 412. The guar seeds (guar beans) are mechanically dehusked, hydrated, milled and screened according to application 1. Guar gum is typically produced as a free-flowing, off-white powder. Commercial food‐grade guar gum is reported to contain usually about 80% guaran, 5–6% crude protein, 8–15% moisture, 2.5% crude fiber, 0.5–0.8% ash, and small amounts of lipids composed mainly of free and esterified plant fatty acids.

Table 1. General composition of guar gum

ConstituentPercentage
Galactomannan75–85
Moisture8.0–14
Protein (N x 6.25)5.0–6.0
Fiber2.0–3.0
Ash0.5–1.0
[Source 2]

Possible impurities

The commercial samples of guar gum contain approximately 4-12% moisture, 2-5% acid-soluble ash, 0.4-1.2% ash, and 2-6% protein. The samples of clarified guar gum contain approximately 5-10% moisture, 0.2-0.8% acid-soluble matter, 0.1-0.5% ash, and 0.1-0.6% protein.

Apart from the gum content, the guar gum contains:

  • husk residues represented by the acid-insoluble-matter criterion (not more than 7.0%)
  • proteins from the germ represented by the protein criteria (not more than 10.0%)
  • ethanol/isopropanol residues for washing or extraction solvent(not more than 1% singly or in combination)
  • microbiological contamination

In the United States, guar gum is listed for use as an emulsifier, formulation aid and firming agent in the following foods:

Food CategoryMaximum Use Level (%)
Baked goods & baking mixes0.35
Breakfast cereals1.2
Cheeses0.8
Daily products analogs1
Fats and oils2
Jams and jellies1
Milk products0.6
Processed vegetable and vegetable juices2
Soup and soup mixes0.8
Sweet sauces, toppings and syrups1
All other foods0.5

Figure 1. Guar seeds (guar beens)

Guar-seeds

Figure 2. Galactomannan – the principal component of this gum is a galactomannan with a linear chain of (1 -> 4) linked ß-D-mannopyranose units with alpha-D-galactopyranose units attached by (1 -> 6) linkages to every alternate mannose. 

galactomannan

The guar plant (Cyamopsis tetragonoloba L. Taub syn. Cyamopsis psoraloides) has been cultivated in India and Pakistan for centuries 1. It can also be cultivated in the southern hemisphere in semi-arid zones in Brazil, Australia and South Africa or in the Southern part of the USA, like Texas or Arizona. The guar kernel is composed of several layers, namely the husk (16-18%) on the outside, the germ (43-46%) and the endosperm (34-40%), which is composed of guar gum.

Guar splits are obtained after separation of the husk and the germ. After heat treatment, the hull is easy to separate by either attrition milling or various types of impact mills. The endosperm is recovered by sieving from the finer germ and hull fractions, and then milled to obtain powdered guar gum. The guar gum may be further purified clarified by dissolution in water, precipitation and recovery with ethanol or isopropanol. It is called as clarified (purified, extracted) guar gum. Clarified guar gum in the market is normally standardized with sugars.

Guar gum is mainly consisting of the high molecular weight polysaccharides composed of galactomannans which are consisting of a linear chain of (1→4)-linked β-D-mannopyranosyl units with (1→6)-linked α-D-galactopyranosyl residues as side chains. The mannose: galactose ratio is approximately 2:1. The molecular weight range is 50,000-8,000,000.

The clarified guar gum has higher galactomannans content and no longer contains the cell structure. The gum is a white to yellowish white, nearly odorless, free-flowing powder with a bland taste.

Guar gum is insoluble in organic solvents. The gum is soluble in cold water without heating to form a highly viscous so1ution. Guar gum solutions have buffering capacity and are very stable in the pH 4.0-10.5 range. Addition of a small amount of sodium borate to a water solution of guar gum will result in formation of a gel.

The caloric value was determined in groups of 10 rats fed for one week a 5 g basal diet supplemented with either 1 g or 3 g corn starch or 1 g and 3 g guar gum. At 1 g level guar gum was equivalent to corn starch but at the 3 g level there was a lower equivalence. In a further bioavailable calorie assay groups of 10 male weanling rats (Sprague-Dawley) were given 5 g basal diet or plus 0.5, 1, 2 g sucrose or 0.5, 1, 2 g guar gum for 10 days. Comparison of the carcass weight gain showed that guar gum was not a source of bioavailable calories 3. The rat can use guar flour as a precursor for liver glycogen but at a much reduced efficiency as shown by 15 controls receiving cocoa butter alone (<0.1% glycogen), or cocoa butter + 30% wheat flour (2.6% glycogen) and 18 test animals receiving cocoa butter + 30% guar flour (0.8% glycogen) for two days 4. The digestibility of guar gum in rats fed 0.4 g/day was estimated to be 76% 5. However another digestibility study in groups of five male and five female rats (Purdue strain) on a mannose-free diet showed that 83-100% of mannose fed as 1% guar gum in the diet for 18 hours was excreted in the feces over a total of 30 hours. Some decrease in chain length of galactomannans may have occurred probably through the action of the microflora as mammals are not known to possess mannosidase. Liberation of galactose was not determined 6. Incubation of solutions or suspensions with human gastric juice, duodenal juice + bile, pancreatic juice and succus entericus with or without added rabbit small gut membrane enzymes produced no evidence of hydrolysis (Semenza, 1975). Rat large gut
microflora partially hydrolyzed guar gum in vitro 7.

Feeding chicks for four weeks on a diet containing 3% cholesterol, 3% guar gum and 3% cholesterol + 3% guar gum reduced the serum cholesterol level especially if both cholesterol and guar gum were ingested. Liver cholesterol was only depressed if cholesterol and guar gum were fed 8. Groups each of eight male Holtzman rats were maintained on a purified synthetic diet, or the diet plus 1% cholesterol, or the diet plus 1% cholesterol and 10% guar gum for 28 days. The increased liver cholesterol and liver total lipid induced by cholesterol feeding was largely counteracted by concurrent feeding of guar gum. Ten per cent. but not 5% guar gum added concurrently to a casein/sucrose diet with 1% cholesterol and 10% corn oil significantly reduced serum and liver cholesterol. Five per cent. guar gum reduced only the liver cholesterol when only 5% corn oil was used with a commercial diet 9.

Is guar gum gluten free?

Yes.

Gluten-Containing Grains and Their Derivatives

  • Wheat
  • Varieties and derivatives of wheat such as:
    • wheatberries
    • durum
    • emmer
    • semolina
    • spelt
    • farina
    • farro
    • graham
    • KAMUT® khorasan wheat
    • einkorn wheat
  • Rye
  • Barley
  • Triticale
  • Malt in various forms including: malted barley flour, malted milk or milkshakes, malt extract, malt syrup, malt flavoring, malt vinegar
  • Brewer’s Yeast
  • Wheat Starch that has not been processed to remove the presence of gluten to below 20ppm and adhere to the FDA Labeling Law*

*According to the FDA, if a food contains wheat starch, it may only be labeled gluten-free if that product has been processed to remove gluten, and tests to below 20 parts per million of gluten. With the enactment of this law on August 5th, 2014, individuals with celiac disease or gluten intolerance can be assured that a food containing wheat starch and labeled gluten-free contains no more than 20ppm of gluten. If a product labeled gluten-free contains wheat starch in the ingredient list, it must be followed by an asterisk explaining that the wheat has been processed sufficiently to adhere to the FDA requirements for gluten-free labeling.

Guar gum allergy

A few case reports have been published on guar gum allergy, one in Finnish 10, another mentioned anaphylactic shock to guar gum (food additive E412) contained in a meal substitute 11, occupational allergic rhinitis from guar gum 12 and occupational asthma caused by guar gum 13.

Guar gum vs Xanthan gum

Xanthan gum is a high-molecular weight (of the order of 1000 kDa) polysaccharide gum comprising primarily of D-glucose and D-mannose as the dominant hexose units, along with D-glucuronic acidand pyruvic acid 14. Xanthan gum is produced by the fermentation of a carbohydrate source in a pure culture of Xanthomonas campestris, the naturally occurring bacteria. The fermentation medium comprises of a carbohydrate, a nitrogen source, and mineral salts. Once the fermentation process is complete, xanthan gum is recovered from the fermentation broth by alcohol precipitation in the form of a sodium, calcium, or potassium salt. The resulting coagulum is separated, rinsed, pressed, dried, and ground as part of down-stream processing and marketed as a cream-coloured powder.

Xanthan gum (E 415) is generally used as a thickener, stabiliser, emulsifier and foaming agent. The present assessment focuses in its proposed use as a thickener in infant formulae, follow-up formulae, and formulae for special medical purposes intended for infants.

An important property of xanthan gum solutions is the physicochemical interaction with plant galactomannans, such as locust bean gum and guar gum, or konjac glucomannan. The addition of any of these gums to a solution of xanthan gum at room temperature causes a synergistic increase in viscosity 15.

The European Food Safety Authority Panel noted that in cases, where xanthan gum (E 415) is added in combination with other gums, such as locust bean gum (E 410), guar gum (E 412) or konjac glucomannan (E 425 (ii)) to food, the synergistic increase in viscosity has to be taken into consideration. This may be relevant in particular for the above mentioned combined uses of xanthan gum and guar gum in infant food for special medical purposes.

Xanthan gum (E 415) is authorized as a food additive in the European Union (EU) according to Annex II and III to Regulation (EC) No 1333/2008 on food additives and it was previously evaluated by the European Union Scientific Committee for Food (SCF) and the Joint FAO/WHO Expert Committee on Food Additives (JECFA), who both allocated an acceptable daily intake (ADI) ‘not specified’ for this gum.

According to the industry, during the fermentation process, the Xanthomonas campestris bacteria produce enzymes (i.e. amylases, cellulases or protease) which are reduced as much as possible or deactivated throughout the manufacturing process.

The European Food Safety Authority Panel noted that limits for possible residual bacterial enzymatic activities may be required in the EU specifications.

Xanthan gum (E 415) can be regarded as non‐toxic based on the results of acute oral toxicity studies.

From short‐term and subchronic toxicity studies, no toxicological relevant changes were reported apart from a decrease in red blood cell count and hemoglobin concentration in dogs receiving 2,000 mg/kg body weight per day for 12 weeks. This effect was marginal and it was not reproduced in a dog chronic toxicity study at 1,000 mg/kg body weight per day, the highest dose tested. The European Food Safety Authority Panel noted that decreased total serum cholesterol was frequently reported.

For genotoxicity, insufficient experimental data were available. However, taking into account the information on structure–activity relationships and considering that xanthan gum has a molecular weight far above the threshold for absorption, according to absorption, distribution, metabolism, and excretion data, it was not degraded in the intestine and is slightly fermented to non‐hazardous short‐chain fatty acids (SCFAs) by the gut microbiota, the European Food Safety Authority Panel concluded that xanthan gum (E 415) does not give rise to concerns for genotoxicity.

In chronic and long‐term studies, no adverse effects, including biochemical and hematological parameters, were reported in dogs and rats. The European Food Safety Authority Panel noted that decreased red blood cell counts reported in a subchronic toxicity study in dogs receiving 2,000 mg/kg body weight per day at 6 and 12 weeks, effect which was marginal and not reproduced in a dog chronic toxicity study at 1,000 mg/kg body weight per day for 107 weeks, the highest dose tested.

Dietary feeding of xanthan gum at levels of 0 (control), 250 and 500 mg/kg body weight per day to groups of albino rats of both sexes during a three‐generation reproduction study had no adverse effect on reproduction as judged by all the endpoints evaluated. No prenatal developmental toxicity studies were available to the European Food Safety Authority Panel.

In special studies in neonatal piglets, no test substance‐related effects in hematology or clinical chemistry parameters were observed at any dose. In the high‐dose group (3,750 mg/kg body weight per day) histopathological findings rated from minimal to moderate were observed in the large intestine (cecum, colon, rectum) and small intestine (duodenum). These effects were observed in fewer animals in the lower dose groups (375 and 750 mg/kg body weight per day) and the severity was considered minimal. The Panel considered the no‐observed‐adverse-effect‐level (NOAEL) for xanthan gum in neonatal piglets to be 375 mg/kg body weight per day, based on the changes of the feces (green, soft, watery, increased defecation) in the mid‐dose and high dose group, and the no‐observed‐adverse‐effect‐level (NOAEL) was 750 mg/kg body weight per day based on histopathological changes in the intestine in the high dose.

From a human study with repeated intake ranging from 10.4 to 12.9 g of xanthan gum per day (assuming a body weight of 70 kg corresponding to 149–184 mg/kg body weight per day), it was reported that xanthan gum acts as a bulk laxative causing no adverse dietary nor physiological effects. The only effects observed were moderate (10%) reduction in serum cholesterol and a significant increase in fecal bile acid concentrations 16.

A study investigating the effect of repeated intake of 15 g xanthan gum/day (assuming a body weight of 70 kg corresponding to 214 mg/kg body weight per day) on colonic function showed significant increases in stool output, frequency of defecation and flatulence due to the ingestion of the xanthan gum 17.

In clinical studies involving infants, the European Food Safety Authority Panel noted that consumption of xanthan gum in infant formula or formula for special medical purposes in infant was well tolerated, did not influence minerals (Ca, P, Mg), fat and nitrogen balance and did not affect growth characteristics up to concentration of 1,500 mg/L (232 mg/kg body weight per day) 18. These results were supported by the outcome of the post‐marketing surveillance with formulae containing xanthan gum at a concentration of approximately 750 mg/L of reconstituted formula 18.

The European Food Safety Authority Panel on Food Additives and Nutrient Sources added to Food provides a scientific opinion re‐evaluating the safety of xanthan gum (E 415) as food additive 18. Based on the reported use levels, a refined xanthan gum (E 415) exposure of up to 64 mg/kg body weight per day in children for the general population, 38 mg/kg body weight per day for children consumers only of food supplements at the high level exposure and 115 mg/kg body weight per day for infants consuming foods for special medical purposes and special formulae, were estimated. Xanthan gum (E 415) is unlikely to be absorbed intact and is expected to be fermented by intestinal microbiota. No adverse effects were reported at the highest doses tested in chronic and carcinogenicity studies and there is no concern with respect to the genotoxicity 18. Repeated oral intake by adults of xanthan gum up to 214 mg/kg body weight per day for ten days was well tolerated, but some individuals experienced abdominal discomfort, an undesirable but not adverse effect. The European Food Safety Authority Panel concluded that there is no need for a numerical Acceptable Daily Intake (ADI) for xanthan gum (E 415), and that there is no safety concern for the general population at the refined exposure assessment of xanthan gum (E 415) as food additive 18. Considering the outcome of clinical studies and post‐marketing surveillance, the European Food Safety Authority Panel concluded that there is no safety concern from the use of xanthan gum (E 415) in foods for special medical purposes and special formulae for infants and young children at concentrations reported by the food industry. The current re‐evaluation of xanthan gum (E 415) as a food additive is not considered to be applicable for infants under the age of 12 weeks.

Xantham Gum Safety Data for General population

Following the conceptual framework for the risk assessment of certain food additives re‐evaluated under European Commission Regulation No 257/2010 19:

  • From all the data received, data were adequate for a refined exposure assessment for 25 out of 79 food categories;
  • Based on the reported use levels, a refined exposure (non‐brand‐loyal scenario) of up to 64 mg/kg body weight per day in children (3–9 years) was estimated;
  • Refined exposure assessments for consumers only of food supplements was also calculated and was up to 38 mg/kg body weight per day for children (3–9 years) considering high level exposure (95th percentile);
  • Xanthan gum is unlikely to be absorbed intact and is expected to be partially fermented by intestinal microbiota;
  • Adequate toxicity data were available;
  • There was no concern with respect to genotoxicity;
  • No adverse effects were reported in chronic studies in rats and dogs up to 1,000 mg/kg body weight per day, the highest dose tested. In rats, the compound was not carcinogenic;
  • Repeated oral intake by adults of large amounts of xanthan gum up to 15,000 mg/person per day, corresponding to 214 mg/kg body weight per day for at least ten days was well tolerated, but some individuals experienced abdominal discomfort, which was considered by the European Food Safety Authority Panel as undesirable but not adverse;

The European Food Safety Authority Panel concluded that there is no need for a numerical acceptable daily intake (ADI) for xanthan gum (E 415), and that there is no safety concern at the refined exposure assessment for the reported uses and use levels of xanthan gum (E 415) as a food additive 18.

Xantham Gum Safety Data for Infants and young children consuming foods for special medical purposes and special formulae

Concerning the use of xanthan gum (E 415) in ‘dietary foods for special medical purposes and special formulae for infants’ and in ‘dietary foods for babies and young children for special medical purposes:

  • For populations consuming foods for special medical purposes and special formulae, the highest refined exposure estimates (p95) on the maximum reported data from food industry (750 mg/L for categories 13.1.5.1 and 250 mg/L for 13.1.5.2) were up to 115 mg/kg body weight per day for infants (12 weeks–11 months, brand loyal scenario);
  • In a number of clinical studies, consumption of xanthan gum in infant formula or formula for special medical purposes in infant was well tolerated up to concentration of 1,500 mg/L (232 mg/kg body weight per day);
  • No cases of adverse effects were reported from post‐marketing surveillance with formulae containing xanthan gum at a concentration of approximately of 750 mg/L of reconstituted formula which supported the results of the clinical studies;

The European Food Safety Authority Panel concluded, that there is no safety concern from the use of xanthan gum (E 415) in foods for special medical purposes consumed by infants and young children at concentrations reported by the food industry 18.

Xanthan gum possible impurities

Possible impurities of xantham gum include the nitrogen source from the fermentation medium, remaining alcohols used for the precipitation (isopropanol or ethanol) and heavy metals as contaminants. Microbiological contamination has also to be excluded.

An interested party has provided information on the content of lead (ND–2.0 mg/kg), arsenic (ND–2 mg/kg), cadmium (ND–0.1 mg/kg) and mercury (ND–1 mg/kg) in xanthan gum. According to the European Commission specifications, impurities of the toxic element lead are accepted up to concentration of 2 mg/kg.

Based on analytical data provided by the sponsor for three different batches of xanthan gum lead and arsenic concentrations are below the limit of detection about 4 parts per billion (ppb) or 4 µg/kg or 4 micrograms per kilogram which is 3 orders of magnitude lower than the limit in the specifications 2 parts per million (ppm) or 2 mg/kg or 2 milligrams per kilogram for lead. Isopropanol is found at concentrations 339-467 mg/Kg, close to the specification limit of 500 mg/Kg.

Is guar gum safe?

In the European Union, guar gum was evaluated by the Joint Food and Agriculture Organization (FAO)/World Health Organisation (WHO) Expert Committee on Food Additives (JECFA) in 1970, 1974 and 1975 20, who allocated an acceptable daily intake (ADI) ‘not specified’. Guar gum has been also evaluated by the Scientific Committee for Food in 1977 21 who endorsed the acceptable daily intake (ADI) ‘not specified’ allocated by JECFA. The European Food Safety Authority Panel considered that adequate exposure and toxicity data were available. Guar gum is practically undigested, not absorbed intact, but significantly fermented by enteric bacteria in humans. No adverse effects were reported in subchronic and carcinogenicity studies at the highest dose tested; no concern with respect to the genotoxicity. Oral intake of guar gum was well tolerated in adults. The European Food Safety Authority Panel concluded that there is no need for a numerical acceptable daily intake (ADI) for guar gum (E 412), and there is no safety concern for the general population at the refined exposure assessment of guar gum (E 412) as a food additive 22. The European Food Safety Authority Panel considered that for uses of guar gum in foods intended for infants and young children the occurrence of abdominal discomfort should be monitored and if this effect is observed doses should be identified as a basis for further risk assessment. Therefore, the European Food Safety Authority Panel concluded that the available data do not allow an adequate assessment of the safety of guar gum (E 412) in infants and young children consuming these foods for special medical purposes 22.

In 1998, the Scientific Committee for Food 23 accepted the use of guar gum in foods for special medical purposes for infants and young children at levels up to 10 g/L in ready‐to‐use liquid formulae containing extensively hydrolyzed protein and in ready‐to‐use liquid formulae containing partially hydrolyzed proteins for infants in good health at levels up to 1 g/L. In 2001, the Scientific Committee for Food accepted the use of guar gum in all weaning foods at levels up to 10 and up to 20 g/kg in gluten‐free cereal‐based foods, singly or in combination 24. In 2003, the Scientific Committee for Food re‐evaluated guar gum in the revision of the essential requirements of infant formulae and follow‐on formulae intended for the feeding of infants and young children 25.

The in vitro degradation and the in vivo digestibility of guar gum have been investigated in animals and humans which demonstrated that guar gum would not be absorbed unchanged and would not be metabolized by enzymes present in the gastrointestinal tract. However, it would be partially fermented to short‐chain fatty acids (SCFAs) during its passage through the large intestine by the action of the intestinal tract microflora 22. The rate of hydrolysis in the gastrointestinal tract in humans is unknown; however, it is expected that fermentation of guar gum would lead to the production of products such as short‐chain fatty acids (SCFAs) which were considered of no concern by the European Food Safety Authority Panel.

  • Guar gum is regarded as not acutely toxic, based on the results of acute oral toxicity studies.
  • In short‐term and subchronic studies in mice, rats, dogs and monkeys, no adverse effects were observed at the highest dose tested.
  • The European Food Safety Authority Panel considered the available genotoxicity data on guar gum (E 412) to be sufficient to conclude that there is no concern with respect to genotoxicity.
  • Overall, the European Food Safety Authority Panel considered guar gum as not carcinogenic 22.

Guar gum did not show reproductive effects (fertility) or developmental toxicity effects in the available studies. From a combined fertility/developmental study in rats 26, the European Food Safety Authority Panel could identify a no‐observed‐adverse‐effect‐level (NOAEL) of 5,200 mg/kg body weight per day for reproductive effects based on decreased number of corpora lutea and a NOAEL for developmental toxicity of 11,800 mg/kg body weight per day the highest dose tested.

Re‐evaluation of the use of guar gum (E 412) in foods for infants from 12 weeks of age and for young children. The European Food Safety Authority Panel acknowledged that consumption to the concerned food categories would be short and noted that it is prudent to keep the number of additives used in foods for infants and young children to the minimum necessary and that there should be strong evidence of need as well as safety before additives can be regarded as acceptable for use in infant formulae and foods for infants and young children 22. If guar gum is added in combination with locust bean gum and carrageenan to a follow‐on formula, the maximum level recommended by the Scientific Committee for Food for guar gum should not be exceeded by the total concentration of these three substances. The European Food Safety Authority Panel noted that it may be considered to establish specific purity criteria for the use of guar gum in food for infants and young children 22.

From the refined brand‐loyal estimated exposure scenario taking into account the foods for special medical purposes, mean exposure to guar gum (E 412) from its use as a food additive ranged for infants between 325 and 609 mg/kg body weight per day and between 120 and 457 mg/kg body weight per day for toddlers. The 95th percentile of exposure ranged for infants between 912 and 1,555 mg/kg body weight per day and for toddlers between 310 and 743 mg/kg body weight per day.

The refined estimates are based on 51 out of 86 food categories in which guar gum (E 412) is authorized. The main food categories, in term of amount consumed, not taken into account were breakfast cereals, gluten‐free dietary foods for infants and young children, snacks and most of alcoholic beverages. However, based on the information in the Mintel Global New Products Database, in the EU market, no breakfast cereals are labelled with guar gum (E 412), and few alcoholic drinks are labelled with the additive. Therefore, the European Food Safety Authority Panel considered that the uncertainties identified would, in general, result in an overestimation of the exposure to guar gum (E 412) as a food additive in European countries for all scenarios.

The European Food Safety Authority Panel noted that use levels of guar gum (E 412) in food for infants under the age of 12 weeks would require a specific risk assessment in line with the recommendations given by JECFA 27 and the Scientific Committee for Food 23 and endorsed by the 2012 European Food Safety Authority Panel 28. Therefore, the current re‐evaluation of guar gum (E 412) as a food additive is not considered to be applicable for infants under the age of 12 weeks and will be performed separately.

General population

The European Food Safety Authority Panel concluded that there is no need for a numerical Acceptable Daily Intake (ADI) for guar gum (E 412), and that there is no safety concern for the general population at the refined exposure assessment for the reported uses of guar gum (E 412) as a food additive.

  • Adequate exposure data were available; in the general population, the highest refined exposure assessments calculated based on the reported data from food industry were for infants (12 weeks–11 months) up to 812 mg/kg body weight per day (brand‐loyal scenario),
  • Guar gum is practically undigested, not absorbed intact, but significantly fermented by enteric bacteria in humans,
  • Adequate toxicity data were available,
  • No adverse effects were reported in subchronic studies in rodents at the highest dose tested of 15,000 mg guar gum/kg body weight per day in mice and 18,000 mg guar gum/kg body weight per day in rats,
  • There is no concern with respect to the genotoxicity of guar gum,
  • No carcinogenic effects were reported at the highest dose tested of 7,500 mg guar gum/kg body weight per day in mice and 2,500 mg guar gum/kg body weight per day in rats,
  • Oral intake of large amount of guar gum in (9,000–30,000 mg/person corresponding to 128–429 mg/kg body weight per day) was well tolerated in adults. In most studies after consumption of around 15,000 mg per day in adults corresponding to 214 mg/kg body weight per day, some individuals experienced abdominal discomfort which was considered by the European Food Safety Authority Panel as undesirable but not adverse,
  • In one interventional study with diabetic children abdominal discomfort was reported in 5 out of 22 children given 13,500 mg guar gum per day corresponding to 314 mg/kg body weight per day,
  • Using the refined exposure assessment (non brand‐loyal scenario), the European Food Safety Authority Panel noted that exposures for high level consumers (children and adults) would be below the level at which some abdominal discomfort was reported,
  • No data on abdominal discomfort were available for infants and young children,

The European Food Safety Authority Panel considered that for uses of guar gum in foods intended for infants and young children the occurrence of abdominal discomfort should be monitored and if this effect is observed doses should be identified as a basis for further risk assessment.

Infants and young children consuming foods for special medical purposes and special formulae

Concerning the use of guar gum (E 412) in ‘dietary foods for special medical purposes and special formulae for infants’ and ‘in dietary foods for babies and young children for special medical purposes and given that:

  • For populations consuming dietary foods for special medical purposes and special formulae, the highest refined exposure estimate (p95) calculated based on the reported data from food industry are for infants (12 weeks‐11 months) consuming dietary foods for special medical purposes and special formulae up to 1,555 mg/kg body weight per day (brand‐loyal scenario),
  • Infants and young children consuming these foods may be exposed to a greater extent to guar gum (E 412) than their healthy counterparts because the permitted levels of guar gum (E 412) in products for special medical purposes are 10‐fold higher than in infant formulae and follow‐on formulae for healthy individuals,
  • Infants and young children consuming foods belonging to these food categories may show a higher susceptibility to the gastrointestinal effects of guar gum than their healthy counterparts due to their underlying medical condition,
  • No adequate specific studies addressing the safety of use of guar gum (E 412) in this population under certain medical conditions were available,
  • It was not possible to assess at which exposure level of guar gum the gastrointestinal effects developed in this specific population,

The European Food Safety Authority Panel concluded that the available data do not allow an adequate assessment of the safety of guar gum (E 412) in infants and young children consuming these foods for special medical purposes 22.

The European Food Safety Authority Panel recommended that the maximum limits for the impurities of toxic elements (lead, mercury and arsenic) in the European Commission specification for guar gum (E 412) should be revised in order to ensure that guar gum (E 412) as a food additive will not be a significant source of exposure to those toxic elements in food in particular for infants and children. The European Food Safety Authority Panel noted that currently detected levels of these toxic elements were orders of magnitude below those defined in the European Union specifications, and therefore, the current limits could be lowered.

The European Food Safety Authority Panel recommended to harmonize the microbiological specifications in the European Union Regulation for polysaccharidic thickening agents, such as gums, and to include criteria for the absence of Salmonella spp. and Escherichia coli for total aerobic microbial count and for total combined yeasts and moulds count into the European Union specifications of guar gum (E 412).

The European Food Safety Authority Panel recommended to give separate specifications in the European Union regulation for guar gum and clarified guar gum differing significantly in the protein content.

The European Food Safety Authority Panel considered that no threshold dose can be established for allergic reactions. Therefore, it is advisable that exposure to eliciting allergens, such as proteinaceous compounds, is avoided as much as possible and therefore the European Food Safety Authority Panel recommended that their content should be reduced as much as possible, which can be achieved, for example, by clarification of guar gum.

The European Food Safety Authority Panel recommended that additional data should be generated to assess the potential health effects of guar gum (E 412) when used in ‘dietary foods for infants for special medical purposes and special formulae for infants’ and in ‘dietary foods for babies and young children for special medical purposes’ 22.

Guar gum uses

Guar gum is used as thickener, stabilizer and emulsifier, and as fiber source 29 and approved in most areas of the world (e.g. EU, USA, Japan, and Australia). Guar gum food additive is E 412. In the United States, guar gum is listed for use as an emulsifier, formulation aid and firming agent.

Beverages

Guar gum is used in beverages for thickening and viscosity control because of its several inherent properties. The important property of guar gum is its resistance to breakdown under low pH conditions present in beverages. Guar gum is soluble in cold water which makes it easy to use in beverage processing plants. It improves the shelf life of beverages.

Processed cheeses

In cheese product, syneresis or weeping is a problem of serious concern. Guar gum prevents syneresis or weeping by water phase management and thus also improves the texture and body of the product 30. In cheese products it is allowed up to 3% of the total weight. Guar gum in the soft cheeses enhances the yield of curd solids and gives a softer curve with separated whey. Low-fat cheese can be produced with addition of guar gum (at concentration 0.0025–0.01% w/v) without changing the rheology and texture compared with full-fat cheese.

Dairy products

Main purpose of using guar gum in frozen products is stabilization. Guar gum has important role in ice cream stabilization because of its water binding properties. Its use in high temperature short time processes is very favorable because such processes require hydrocolloids that can fully hydrate in a short processing time. According to McKiernan 31 locust bean gum has all the properties of an ideal gum but it hydrates slowly which is not favorable in high temperature short time process. Julien 32 obtained satisfactory results with guar as stabilizer in continuous ice cream processing. Guar gum should be used in ice cream mix at a concentration level of 0.3% 33. It was also used in combination with carrageenan in a mixed guar-carrageenan system developed for high temperature short time process. Like locust bean gum its performance can be improved when used in combination with other stabilizers 34. Guar gum in ice cream improves the body, texture, chewiness and heat shock resistance. Partially hydrolyzed guar gum (at 2–6% concentration level) decreases syneresis and improves the textural and rheological properties of low-fat yoghurt comparable with full-fat yoghurt 35.

Table 2. Food applications of guar gum

FoodDose levelFunction
Chapati0.75%Softness
Bread0.50%Softness, loaf volume
Fried Products0.5–1.0%Oil uptake reduction
Yoghurt2.00%Texture improver
Cake0.15%Fat replacer, Firmness
Sausage0.13–0.32%Softness
Pasta1.50%Texture improver
Ice cream0.50%Smaller ice crystals
Baked goods1.00%Dough improver
Tomato Ketchup0.5–1.0%Consistency improver,
Tomato Ketchup0.5–1.0%Serum loss reduction
[Source 36]

Processed meat products

Guar gum has strong water holding capacity in both hot and cold water. Hence, it is very effectively used as a binder and lubricant in the manufacturing of sausage products and stuffed meat products. It performs specific functions in processed meat products like syneresis control, prevention of fat migration during storage, viscosity control of liquid phase during processing and cooling and control of accumulation of the water in the can during storage. Guar gum also enhances the creaming stability and control rheology of emulsion prepared by egg yolk 37

Bakery products

Addition of guar gum in cake and biscuit dough improves the machinability of the dough that is easily removed from the mold and can be easily sliced without crumbling. At 1% addition of in batter of doughnuts, it gives desirable binding and film-forming properties that decreases the penetration of fats and oils. Guar gum in combination with starch is found to be effective in prevention of dehydration, shrinking and cracking of frozen-pie fillings 38. In wheat bread dough, addition of guar gum results in significant increase in loaf volume on baking 39. Guar gum along with xanthan gum retard staling in gluten-free rice cakes by decreasing the weight loss and retrogradation enthalpy 40. Similarly, guar gum also retards staling in chapati at room temperature as well as refrigerated temperature by controlling retrogradation of starch 41.

Salad dressings and sauces

Its cold water dispersibility and compatibility with high acidic emulsions enable it to use as thickener in salad dressing at about 0.2–0.8% of total weight. In salad dressings, it acts as an emulsion stabilizer by enhancing the viscosity of water phase and hence decreasing the separation rate of the water and oil phase 33. Guar gum has been found useful as a thickener in place of tragacanth in pickle and relish sauces 42. Guar gum enhances the consistency of tomato ketchup more prominently than other hydrocolloids like carboxy methyl cellulose, Sodium alginate, gum acacia and pectin. On addition of guar gum serum loss and flow values of tomato ketchup decreases which makes it a novel thickener for tomato ketchup 43.

Health benefits

Various studies have been conducted on animals to test for both harmful and beneficial effect of guar gum. Guar is completely degraded in the large intestine by Clostridium butyricum 44. Harmful effects are observed only when the guar gum is given to the animals at a high concentration of about 10–15% on weight basis. This high concentration will reduce growth of animal due to decreased feed intake and impaired digestion. It is considered that the high viscosity of the intestinal tract contents, resulting from intake of guar gum at higher concentration, is the major cause of the negative effects. Hence, guar gum can only be used for its beneficial effects at lower concentration of about 0.5–1.0%. Above this concentration it will show negative effects of higher viscosity, decreased protein efficacy and lipid utilization. High viscosity of guar gum when used at a higher concentration, above 1.0% will not only interfere with nutritional properties of the food but also with the physicochemical and sensory properties of the food product which is not accepted by the consumer. Partial hydrolysis of guar gum reduces the chain length and molecular weight of the polymer and ultimately the lower viscosity makes it a novel soluble fiber that resembles in basic chemical structure with native guar gum and has various applications in clinical nutrition associated with ingestion of dietary fiber. It solves all the problems of high viscosity of guar gum. With hydrolyzed guar gum it is possible to increase the dietary fiber content of various food products like beverages without disturbing the nutritional and sensory properties of the food products. Partial hydrolysis of guar gum supplementation to the diet also reduces the laxative requirement, incidence of diarrhea and symptoms of irritable bowel syndrome 45. For treatment of irritable bowel syndrome (IBS) water soluble non-gelling fibers are preferred. Due to its water solubility and non-gelling behavior, partially hydrolyzed guar gum decreased the symptoms in both forms of irritable bowel syndrome (IBS) i.e. constipation predominant and diarrhea predominant 46.

In vitro study shows that presence of guar gum significantly decreases the digestion of starch. It acts as a barrier between starch and starch hydrolyzing enzymes 47.

Guar gum shows cholesterol and glucose lowering effects because of its gel forming properties. It also helps in weight loss and obesity prevention. Due to gel forming capacity of guar gum soluble fiber, an increased satiation is achieved because of slow gastric emptying. Diet supplemented with guar gum decreased the appetite, hunger and desire for eating 48. Mechanism behind cholesterol lowering by guar gum is due to increase in excretion of bile acids in feces and decrease in enterohepatic bile acid which may enhances the production of bile acids from cholesterol and thus hepatic free cholesterol concentration is reduced 49. Hypotriacylglycerolemic effects are due to decrease in absorption of dietary lipids and reduced activity of fatty acid synthase in liver 50. Toxicity study on partially hydrolyzed guar gum has revealed that it is not mutagenic up to dose level of 2500 mg/day 51. Adequate intake of guar gum as dietary fiber helps in the maintenance of bowel regularity, significant reductions in total and LDL “bad” cholesterol, control of diabetes, enhancement of mineral absorption and prevention of digestive problems like constipation 52.

Other non-food uses

Other commercial importance of guar gum is because of its use in oil and gas well stimulation specifically hydraulic fracturing in which high pressure is used to crack rock 36. Guar gum makes the fracturing fluid thicker so that it can carry sand into fractured rock. This fracture remains open due to presence of sand which creates a path for gas or oil to flow to well bore. Guar derivatives for use in fracturing fluids are hydroxypropyl guar (HPG) and carboxymethyl hydroxypropyl guar (CMHPG). In textile and carpet printing, guar gum thickens the dye solutions which allow more sharply printed patterns to be produced. Guar gum has been used in explosives for over 25 years as an additive to dynamite for water blocking. In recent years, it has become the primary gelling agent in water based slurry explosives. Water blocking, swelling and gelling property of guar gum make it enable to use as an additive in explosive industry. Explosive property is maintained by mixing of ammonium nitrate, nitroglycerine and oil explosives with guar gum even in wet conditions. The production of paper is enhanced by an addition of small amounts of guar gum to the pulp. It serves as a fiber deflocculent and dry-strength additive. It provides denser surface to the paper used in printing. Research investigation shows that high viscosity guar gum derivatives can be obtained by treatment of guar gum with complexing agents like organic titanates, chromium salts and aluminum salts. These agents react with guar gum to form complexes with high viscosity gel.

Guar gum side effects

Guar gum can cause abdominal pain, flatulence, diarrhea, nausea, and cramps.

References
  1. Guar Gum. Chemical and Technical Assessment. Prepared by Yoko Kawamura, Ph.D., for the 69th JECFA. http://www.fao.org/fileadmin/templates/agns/pdf/jecfa/cta/69/Guar_gum.pdf
  2. Chudzikowski RJ. Guar gum and its applications. J Soc Cosmet Chem. 1971;22:43–60.
  3. Robaislek, E. (1974) Bioavailable calorie assay of guar gum. Unpublished report from WARF Institute, Inc. submitted to the World Health Organization by Institut Européen des Industries de la Gomme de Caroube
  4. Krantz, J. C., jr (1948) The feeding of guar gum to rats (lifespan) and to monkeys. Unpublished report from the University of Maryland, School of Medicine submitted to the World Health Organization by General Mills Chemicals, Inc.
  5. Booth, A. N., Hendrickson, A. P. and De Eds, F. (1963) Physiologic effects of three microbial polysaccharides on rats, Toxicol. appl. Pharmacol., 5, 478-484
  6. Tsai, L. B. & Whistler, R. L. (1975) Digestibility of galactomannans. Unpublished report submitted to the World Health Organization by Professor H. Neukom, Chairman of the Technical Committee of Inst. Europ. des Industries de la Gomme de Caroube
  7. Semenza, G. (1975) Report on the possible digestion of locust bean gum in the stomach and/or in the small intestine in an in vitro study. Unpublished report from the Eidgenössische Technische Hochschule Zürich submitted to the World Health Organization by the Institut Européen des Industries de la Gomme de Caroube
  8. Couch, J. R., Bakshi, Y. K., Fergusson, T. M., Smith, E. B. & Creger, C. R. (1967) The effect of processing on the nutritional value of guar meal for broiler chicks, Brit. Poultry Sci., 8, 243-250
  9. Riccardi, B. A. & Fahrenback, H. J. (1967) Effect of guar gum and pectin N.F. on serum and liver lipids of cholesterol fed rats, Proc. Soc. Exp. Biol. Med., 124, (3), 749-752
  10. Duodecim. 1990;106(10):829-30. Finnish. No abstract available. Duodecim. 1990;106(10):829-30. https://www.ncbi.nlm.nih.gov/pubmed/1670299
  11. Anaphylactic shock to guar gum (food additive E412) contained in a meal substitute. Allergy. 2007 Jul;62(7):822. https://onlinelibrary.wiley.com/doi/full/10.1111/j.1398-9995.2007.01369.x
  12. Occupational allergic rhinitis from guar gum. Clin Allergy. 1988 May;18(3):245-52. https://www.ncbi.nlm.nih.gov/pubmed/3396193
  13. Occupational asthma caused by guar gum. J Allergy Clin Immunol. 1990 Apr;85(4):785-90. https://www.ncbi.nlm.nih.gov/pubmed/2324416
  14. XANTHAN GUM. 82nd JECFA – Chemical and Technical Assessment (CTA), 2016. Prepared by Eugenia Dessipri, Ph.D., and Reviewed by Madduri V. Rao, Ph.D. http://www.fao.org/3/a-br568e.pdf
  15. García‐Ochoa F, Santos VE, Casas JA and Gomez E, 2000. Xanthan gum: production, recovery, and properties. Biotechnology Advances, 18, 549–579.
  16. Eastwood MA, Brydon WG and Anderson DM, 1987. The dietary effects of xanthan gum in man. Food Additives and Contaminants, 4, 17–26.
  17. Daly J, Tomlin J and Read NW, 1993. The effect of feeding xanthan gum on colonic function in man: correlation with in vitro determinants of bacterial breakdown. British Journal of Nutrition, 69, 897–902.
  18. Re‐evaluation of xanthan gum (E 415) as a food additive. EFSA Journal 14 July 2017. https://efsa.onlinelibrary.wiley.com/doi/10.2903/j.efsa.2017.4909
  19. EFSA ANS Panel (EFSA ANS Panel on Food Additives and Nutrient Sources added to Food), 2014. Statement on a conceptual framework for the risk assessment of certain food additives re‐evaluated under Commission Regulation (EU) No 257/2010. EFSA Journal 2014;12(6):3697, 11 pp. https://doi.org/10.2903/j.efsa.2014.3697
  20. JECFA (Joint FAO/WHO Expert Committee on Food Additives), 1975a. In: Toxicological Evaluation of Certain Food Additives. 19th Report of the Joint FAO/WHO Expert Committee on Food Additives, World Health Organisation (WHO), tech. Rep. Ser. 1975, No 576; FAO Nutrition Meetings report Series, 1975, No 55. http://whqlibdoc.who.int/trs/WHO_TRS_576.pdf
  21. SCF (Scientific Committee for Food), 1978. Reports from the Scientific Committee for Food (7th series). Opinion expressed 1977. Food science and techniques, 1978.
  22. Re‐evaluation of guar gum (E 412) as a food additive. EFSA Journal 24 February 2017. https://efsa.onlinelibrary.wiley.com/doi/10.2903/j.efsa.2017.4669
  23. SCF (Scientific Committee for Food), 1998. Opinion of the Scientific Committee of Food on the applicability of the ADI (Acceptable Daily Intake) for food additives to infants. 17 September 1998.
  24. SCF (Scientific Committee on Food), 2001. Guidance on submissions for food additive evaluations by the scientific committee on food. Opinion expressed on 11 July 2001.
  25. SCF (Scientific Committee for Food), 2003. Report of the Scientific Committee on Food on the Revision of Essential Requirements of Infant Formulae and Follow‐on Formulae. Adopted on 4 April 2003. SCF/CS/NUT/IF/65 Final. 18 May 2003.
  26. Collins TF, Welsh JJ, Black TN, Graham SL and O’Donnell MW Jr, 1987. Study of the teratogenic potential of guar gum. Food and Chemical Toxicology, 25, 807–814.
  27. JECFA (Joint FAO/WHO Expert Committee on Food Additives), 1978. Evaluation of certain food additives. Twenty‐first report of the Joint FAO/WHO Expert Committee on Food Additives. No. 617. World Health Organization, Geneva.
  28. EFSA ANS Panel (European Food Safety Authority Panel on Food Additives and Nutrient Sources added to Food), 2012. Guidance for submission for food additive evaluations. EFSA Journal 2012;10(7):2760, 60 pp. doi:10.2903/j.efsa.2012.2760
  29. Morris JB. Morphological and reproductive characterization of guar (cyamopsis tetragonoloba) genetic resources regenerated in Georgia, USA. Genet Resour Crop Ev. 2010;57:985–993. doi: 10.1007/s10722-010-9538-8.
  30. Klis JB. Woody’s Chunk O’Gold cold-pack cheese food weeps no more. Food Processing Marketing. 1966;27:58–59.
  31. McKiernan BJ (1957) The role of gums in stabilizers. Paper presented at the Michigan Dairy Manufacturer’s Annual Conference, Michigan State University, East Lansing, Michigan
  32. Julien JP. A study of some stabilizers in relation to HTST pasteurization of Ice cream. Ice Cream Trade J. 1953;49:44.
  33. Goldstein AM, Alter EN (1959b) Guar Gum. In: Whistler (ed) Industrial gums, polysaccharides and their derivatives. Academic Press, New York, pp 321
  34. Weinstein B (1958) Stabilizers for ice cream type desserts. U.S. Patent 2856289
  35. Brennan CS, Tudorica CM. Carbohydrate-based fat replacers in the modification of the rheological, textural and sensory quality of yoghurt: comparative study of the utilisation of barley beta-glucan, guar gum and inulin. Int J Food Sci and Technol. 2008;43:824–833. doi: 10.1111/j.1365-2621.2007.01522.x
  36. Mudgil D, Barak S, Khatkar BS. Guar gum: processing, properties and food applications—A Review. Journal of Food Science and Technology. 2014;51(3):409-418. doi:10.1007/s13197-011-0522-x. https://www.ncbi.nlm.nih.gov/pmc/articles/PMC3931889/
  37. Ercelebi EA, Ibanoglu E. Stability and rheological properties of egg yolk granule stabilized emulsions with pectin and guar gum. Int J Food Prop. 2010;13:618–630. doi: 10.1080/10942910902716984
  38. Werbin SJ (1950) Natural Gums in the Baking Industry, Paper presented at the American Association of Cereal Chemists, Dec. 5
  39. Cawley RW. The role of wheat flour pentosans in baking. II. Effect of added flour pentosans and other gums on gluten starch loaves. J Sci Food Agr. 1964;15:834–838. doi: 10.1002/jsfa.2740151204.
  40. Sumnu G, Koksel F, Sahin S, Basman A, Meda V. The effects of xanthan and guar gums on staling of gluten-free rice cakes baked in different ovens. Int J Food Sci Technol. 2010;45:87–93. doi: 10.1111/j.1365-2621.2009.02107.x
  41. Shaikh MI, Ghodke SK, Ananthanarayan L. Inhibition of staling in chapati (Indian unleavened flat bread) J Food Process Pres. 2008;32:378–403. doi: 10.1111/j.1745-4549.2008.00185.x
  42. Burrell JR. Pickles and sauces. Food Manuf. 1958;33:10–13.
  43. Gujral HS, Sharma A, Singh N. Effects of hydrocolloids, storage temperature and duration on the consistency of tomato ketchup. Int J Food Prop. 2002;5:179–191. doi: 10.1081/JFP-120015600
  44. Hartemink R, Schoustra SE, Rombouts FM. Degradation of guar gum by intestinal bacteria. Bioscience Microflora. 1999;18:17–25.
  45. Partially hydrolyzed guar gum: clinical nutrition uses. Slavin JL, Greenberg NA. Nutrition. 2003 Jun; 19(6):549-52.
  46. Role of partially hydrolyzed guar gum in the treatment of irritable bowel syndrome. Giannini EG, Mansi C, Dulbecco P, Savarino V. Nutrition. 2006 Mar; 22(3):334-42. https://www.ncbi.nlm.nih.gov/pubmed/16413751/
  47. Dartois A, Singh J, Kaur L, Singh H. Influence of guar gum on the in vitro starch digestibility-rheological and microstructural characteristics. Food Biophysics. 2010;5:149–160. doi: 10.1007/s11483-010-9155-2
  48. Guar gum: a miracle therapy for hypercholesterolemia, hyperglycemia and obesity. Butt MS, Shahzadi N, Sharif MK, Nasir M. Crit Rev Food Sci Nutr. 2007; 47(4):389-96. https://www.ncbi.nlm.nih.gov/pubmed/17457723/
  49. Guar gum and similar soluble fibers in the regulation of cholesterol metabolism: current understandings and future research priorities. Rideout TC, Harding SV, Jones PJ, Fan MZ. Vasc Health Risk Manag. 2008; 4(5):1023-33. https://www.ncbi.nlm.nih.gov/pmc/articles/PMC2605338/
  50. Yamamoto Y. Hypolipidemic effects of a guar gum-xanthan gum mixture in rats fed high sucrose diet. Journal of Japanese Society of Nutrition and Food Science. 2001;54:139–145. doi: 10.4327/jsnfs.54.139
  51. Takahashi H, Yang SI, Fujiki M, Kim M, Yamamoto T, Greenberg NA. Toxicity studies of partially hydrolyzed guar gum. Int J Toxicol. 1994;13:273–278. doi: 10.3109/10915819409140599
  52. Chemical and physical properties, safety and application of partially hydrolized guar gum as dietary fiber. Yoon SJ, Chu DC, Raj Juneja L. J Clin Biochem Nutr. 2008 Jan; 42():1-7.
read more
Food Additives

Formaldehyde

Formaldehyde

What is formaldehyde

Formaldehyde (CH2O) is also known as methanal, methylene oxide, oxymethylene, methylaldehyde, oxomethane, and formic aldehyde. At room temperature, formaldehyde is a colorless gas with a pungent, irritating and pungent odor, highly flammable gas that is sold commercially as 30–50% (by weight) aqueous solutions 1. Formaldehyde (CH2O) is highly reactive, readily undergoes polymerization, is highly flammable, and can form explosive mixtures in air. Formaldehyde (CH2O) decomposes at temperatures above 150 °C. Formaldehyde is readily soluble in water, alcohols, and other polar solvents. In aqueous solutions, formaldehyde hydrates and polymerizes and can exist as methylene glycol, polyoxymethylene, and hemiformals. Solutions with high concentrations (>30%) of formaldehyde become turbid as the polymer precipitates. As a reactive aldehyde, formaldehyde can undergo a number of self-association reactions, and it can associate with water to form a variety of chemical species with properties different from those of the pure monomolecular substance. These associations tend to be most prevalent at high concentrations of formaldehyde; hence, data on properties at high concentrations are not relevant to dilute conditions.

Formaldehyde is produced worldwide on a large scale. Formaldehyde is produced worldwide on a large scale by catalytic, vapour-phase oxidation of methanol. Formaldehyde is used mainly in the production of resins that are used as adhesives and binders for wood products, pulp, paper, glasswool and rockwool. Formaldehyde is also used extensively in the production of plastics and coatings, in textile finishing and in the manufacture of industrial chemicals. It is used as a disinfectant and preservative (formalin) in many applications.

When formaldehyde is released to or formed in air, most of it degrades, and a very small amount moves into water. When formaldehyde is released into water, it does not move into other media but is broken down. Formaldehyde does not persist in the environment, but its continuous release and formation result in long-term exposure near sources of release and formation.

  • The International Agency for Research on Cancer 2, 3 has classified formaldehyde is carcinogenic to humans (Group 1).
  • Based on the same evidence, the U.S. National Toxicology Program 13th Report on Carcinogens determined that formaldehyde is known to be a human carcinogen 4. In an earlier assessment, the U.S. EPA IRIS program determined that formaldehyde was a probable human carcinogen, based on limited evidence for cancer in formaldehyde-exposed workers and evidence of nasal tumors in laboratory animals.

Formaldehyde exposure:

  • Indoor air may contain formaldehyde from pressed wood products and smoke from cigarettes and poorly vented gas stoves, wood-burning stoves, or kerosene heaters. Workers in mortuaries, hospitals, medical laboratories, or other places that make or use formaldehyde or formaldehyde-containing products may be exposed to higher levels of formaldehyde than the general public. These workers may breathe in formaldehyde or have skin contact with formaldehyde.
  • Irritation of the skin, eyes, nose and throat occurred in some individuals with short-term exposure to low concentrations of formaldehyde in air. Some people with asthma were especially sensitive to formaldehyde. Allergic skin reactions have been reported in some formaldehyde-exposed workers. Lightheadedness, dizziness, and incoordination also have been reported by some laboratory technicians exposed to formaldehyde in air. Direct contact with formaldehyde solutions has caused serious eye damage in some cases. Drinking large amounts of formaldehyde solutions can cause severe pain, vomiting, unconsciousness, and possible death. A number of studies of formaldehyde-exposed workers found evidence for increased risk of dying from myeloid leukemia or cancer of the nose or pharynx. Nasal tissue damage and nose tumors were found in laboratory animals who breathed in moderate concentrations of formaldehyde in air for 6 hours per day for most of their lives.

An air quality formaldehyde guideline of 0.1 mg/m³ has been derived based upon the development of nose and throat irritation in humans; this guidance value is to be used with a 30-min averaging time 5. A drinking-water guideline for formaldehyde of 900 µg/litre has been derived based on a no-observed-adverse-effect level (NOAEL) of 15 mg/kg body weight divided by an uncertainty factor of 100, and assuming 20% intake from water 6.

Pure formaldehyde is not available commercially but is sold as 30–50% (by weight) aqueous solutions. Formalin (37% formaldehyde) is the most common solution. Methanol or other substances are usually added to the solution as stabilizers to reduce the intrinsic polymerization of formaldehyde. In solid form, formaldehyde is marketed as trioxane [(CH2O)3] and its polymer paraformaldehyde, with 8–100 units of formaldehyde.

Formaldehyde is ubiquitously present in the environment as a result of natural sources (including forest fires) and from man-made sources, such as automotive and other fuel combustion and industrial on-site uses. The major source of atmospheric formaldehyde is the photochemical oxidation and incomplete combustion of hydrocarbons 7. Secondary formation also occurs, by the oxidation of natural and anthropogenic organic compounds present in air. Motor vehicles are the largest direct human source of formaldehyde in the environment of the source country. The highest concentrations measured in the environment occur near human activities; these are of prime concern for the exposure of humans and other biota. Releases from industrial processes are considerably less. Industrial uses of formaldehyde include the production of resins and fertilizers.

Formaldehyde natural sources

  • Formaldehyde occurs naturally in the environment and is the product of many natural processes. It is released during biomass combustion, such as forest and brush fires (Howard, 1989; Reinhardt, 1991). In water, it is also formed by the irradiation of humic substances by sunlight 8.
  • As a metabolic intermediate, formaldehyde is present at low levels in most living organisms 9. Formaldehyde is emitted by bacteria, algae, plankton, and vegetation10.
  • Human body turnover of formaldehyde was estimated to be approximately 0.61-0.91 mg/kg body weight per minute and 878-1310 mg/kg body weight per day assuming a half life of 1-1.5 min. Compared with formaldehyde turnover and the background levels of formaldehyde from food sources (1.7-1.4 mg/kg body weight per day for a 60-70 kg person), including from dietary methanol, the relative contribution of external formaldehyde from consumption of animal products (milk, meat) from target animals exposed to formaldehyde-treated feed was negligible (<0.001 %). Oral exposure to formaldehyde from
    aspartame involves metabolism to methanol and further oxidation to formaldehyde. At the current ADI (acceptable daily intake) of 40 mg/kg body weight per day for aspartame, formaldehyde would be approximately 4 mg/kg body weight per day and represent only 0.3-0.4 % of the endogenous turnover of formaldehyde. Acceptable daily intake (ADI) is a measure of the amount of a specific substance in food or drinking water that can be ingested on a daily basis over a lifetime without an appreciable health risk 11.

Formaldehyde man made sources

Man made sources of formaldehyde include direct sources such as fuel combustion, industrial on-site uses, and off-gassing from building materials and consumer products 12.

Although formaldehyde is not present in gasoline, it is a product of incomplete combustion and is released, as a result, from internal combustion engines. The amount generated depends primarily on the composition of the fuel, the type of engine, the emission control applied, the operating temperature, and the age and state of repair of the vehicle. Therefore, emission rates are variable 13.

Based on data for 1997 reported to the National Pollutant Release Inventory, on-road motor vehicles are the largest direct source of formaldehyde released into the Canadian environment. Data on releases from on-road vehicles were estimated by modelling, based on assumptions outlined in Environment Canada 14. The amount estimated by modelling to have been released in 1997 from on-road motor vehicles was 11,284 tonnes 15. While Environment Canada 15 did not distinguish between gasoline-powered and diesel-powered vehicles, it has been estimated, based on emissions data from these vehicles, that they account for about 40% and 60% of on-road automotive releases, respectively. Aircraft emitted an estimated 1730 tonnes, and the marine sector released about 1175 tonnes 15. It can be expected that the rates of release of formaldehyde from automotive sources have changed and will continue to change; many current and planned modifications to automotive emission control technology and gasoline quality would lead to decreases in the releases of formaldehyde and other volatile organic compounds 15.

Other man made combustion sources (covering a range of fuels from wood to plastics) include wood-burning stoves, fireplaces, furnaces, power plants, agricultural burns, waste incinerators, cigarette smoking, and the cooking of food 16. Cigarette smoking in Canada is estimated to produce less than 84 tonnes per year, based on estimated emission rates 17 and a consumption rate of approximately 50 billion cigarettes per year 18. Canadian coal-based electricity generating plants are estimated to emit 0.7–23 tonnes per year, based on US emission factors 19, the high heating value of fuel, and Canadian coal consumption in 1995. A gross estimate of formaldehyde emissions from municipal, hazardous, and biomedical waste in Canada is 10.6 tonnes per year, based on measured emission rates from one municipal incinerator in Ontario 13.

Industrial releases of formaldehyde can occur at any stage during the production, use, storage, transport, or disposal of products with residual formaldehyde. Formaldehyde has been detected in emissions from chemical manufacturing plants 13, pulp and paper mills, forestry product plants 13, tire and rubber plants (Environment Canada, 1997a), petroleum refining and coal processing plants 20, textile mills, automotive manufacturing plants, and the metal products industry 13.

In Canada, about 1424 tons were released into the environment from industrial sites in 1997, from which about 20 tons per annum were releases to surface waters by 4 sites, with reported releases to different media as follows: 1339.3 tonnes to air, 60.5 tonnes to deep-well injection, 19.4 tonnes to surface water, and 0 tonnes to soil. From 1979 to 1989, about 77 tonnes were spilled in Canada as a result of 35 reported incidents. Releases of formaldehyde to groundwater from embalming fluids in bodies buried in cemeteries are expected to be very small based on groundwater samples and the estimated loading rates of six cemeteries in Ontario 21. The US TRI gives industrial releases of formaldehyde for 1999 with about 6,000 tons per annum to air and about 175 tons per annum to surface waters 22. From the direct use of the substance as e.g. biocide it can be assumed that a very high amount is released into the environment. With an amount of 75,000 to 90,000 t/a worldwide this is a significant pollution source. It can be estimated that formaldehyde contained in consumer products, like cleaning agents is released completely into the wastewater. In addition, reported use of formaldehyde in fish farming and in animal husbandry may lead to a significant environmental exposure.

Formaldehyde has been detected in the off-gassing of formaldehyde products such as wood panels, latex paints, new carpets, textile products, and resins. While emission rates have been estimated for some of these sources, there are insufficient data for estimating total releases 23. In some countries, there have been regulatory and voluntary initiatives to control emissions from building materials and furnishings, since these are recognized as the major sources of elevated concentrations of formaldehyde in indoor air.

Formaldehyde and cancer in humans

The expert working group at the International Agency for Research on Cancer has determined that there is now sufficient evidence that formaldehyde causes nasopharyngeal cancer in humans, a rare cancer in developed countries 2. “Their conclusion that there is adequate data available from humans for an increased risk of a relatively rare form of cancer (nasopharyngeal cancer), and a supporting mechanism, demonstrates the value and strengths of the Monographs Programme,” 24. The International Agency for Research on Cancer working group also found limited evidence for cancer of the nasal cavity and paranasal sinuses and “strong but not sufficient evidence” for leukemia 24, 2. The finding for leukemia reflects the epidemiologists’ finding of strong evidence in human studies coupled with an inability to identify a mechanism for induction of leukemia, based on the data available at this time. The International Agency for Research on Cancer Working Group further stated that “It is
possible that formaldehyde itself can reach the bone marrow following inhalation, although the evidence is inconsistent” 2. Since that time (2006), Zhang et al. 25, reviewed potential pathways by which formaldehyde could act as a leukemogen. Three mechanisms were suggested:

  1. By damaging stem cells in the bone marrow directly, as most other leukemogens do;
  2. By damaging hematopoietic stem/progenitor cells circulating in the peripheral blood and
  3. By damaging the primitive pluri-potent stem cells present within the nasal turbinates and/or olfactory mucosa.

formaldehyde

Endogenous formaldehyde turnover in humans

Formaldehyde is an important metabolic intermediate that is physiologically present in all cells at an intracellular concentration of around 12 mg/L (400 μM) 26. There are numerous sources of endogenous formaldehyde including the one carbon pool, amino acid metabolism (serine, glycine, methionine, and choline), methanol metabolism, lipid peroxidation, and P450 dependent demethylation (e.g. O-, N-, and S-methyl) 27. The metabolism of formaldehyde is rapid and catalyzed by glutathione-dependent formaldehyde dehydrogenase (which is also known as alcohol dehydrogenase 5, ADH5) and Sformyl-glutathione hydrolase to formic acid. Formic acid then enters the one-carbon pool where it can be incorporated as a methyl group into nucleic acids and proteins and is either excreted in the urine or oxidised to carbon dioxide and exhaled at a significantly slower rate than its formation from formaldehyde (formic acid halflife in plasma is between 1 and 6 hours) 27. ADH5 has been detected in all human tissues at all stages of development, from embryo through adult. The electrophilic nature of formaldehyde makes it reactive towards a variety of endogenous molecules, including glutathione, proteins, nucleic acids and folic acid 28. Ideally, an evaluation of the fate of formaldehyde in vivo requires a distinction between products which are normal cellular metabolites, those which are detoxification products and those which are formed chemically in localized tissues due to the reactivity of formaldehyde 27.

In order to estimate the synthesis and metabolism of formaldehyde in the human body, authors in the scientific literature have assumed that it is present in all aqueous body fluids because of its water solubility and have estimated its half life in humans as 1-1.5 min 29. Blood and intracellular steady state concentrations of formaldehyde have been estimated in humans to be around 2.6 mg/L (87 μM) and 12 mg/L (400 μM), respectively 29. Based on blood steady state concentrations and half life values in humans of 1-1.5 min, formaldehyde turnover was estimated to be approximately 0.61-0.91mg/kg body weight per minute corresponding to a daily turnover of 878-1310 mg/kg body weight per day 11.

Formaldehyde in food

Background levels in food products of formaldehyde are very variable and range from values around 0.1-0.3 mg/kg in milk to over 200 mg/kg in some fish species 11. Background levels of formaldehyde have been measured in milk, meat, plant material, mushrooms and fish.

  • Formaldehyde is present in the milligram range with the lowest level measured in fresh milk (0.013 – < 1 mg/kg) 30.
  • In pig tissues, background formaldehyde levels (n=3) has been measured with values of 11.8±0.17, 8.75±0.28, 6.24±0.12 mg/kg in liver, kidney and muscle, respectively 31.
  • In meat, background levels of formaldehyde ranged from 2.5 mg/kg in sandwich paste from poultry, 2.9-4.6 mg/kg in cold meat cuts, ham from poultry, turkey, up to 10-20.7 mg/kg in sausages and up to 224-267 mg/kg in the outer layer of smoked ham 30.
  • In fish, formaldehyde background levels show the highest values measured in food with extreme values 232-293 mg/kg in deep frozen hake, lowest values in haddock and mullet 1.47-4.87 mg/kg and average values in cod around 100 mg/kg 32. Formaldehyde develops postmortem in marine fish and crustaceans, from the enzymatic reduction of trimethylamine oxide to formaldehyde and dimethylamine 33. While formaldehyde may be formed during the ageing and deterioration of fish flesh, high levels do not accumulate in the fish tissues, due to subsequent conversion of the formaldehyde formed to other chemical compounds 34. However, formaldehyde accumulates during the frozen storage of some fish species, including cod, pollack, and haddock 33. Formaldehyde formed in fish reacts with protein and subsequently causes muscle toughness 35, which suggests that fish containing the highest levels of formaldehyde (e.g., 10–20 mg/kg) may not be considered palatable as a human food source.
  • In plant material such as fruit vegetables, background formaldehyde levels (mg/kg) range from 6.3 and 6.8 in apples and carrots, 9.0 in fresh water melon, 9.5 in apricot to 13.3 in tomatoes, 16.3 in bananas, 19.5 in potatoes to 26.9, 31 and 35 in cauliflower, kohlrabi and large beetroot respectively 30.

Higher concentrations of formaldehyde (i.e., up to 800 mg/kg) have been reported in fruit and vegetable juices in Bulgaria 36; however, it is not clear if these elevated levels arise during processing. Formaldehyde is used in the sugar industry to inhibit bacterial growth during juice production 37. In a study conducted by Agriculture Canada, concentrations of formaldehyde were higher in sap from maple trees that had been implanted with paraformaldehyde to deter bacterial growth in tap holes 38. The resulting maple syrup contained concentrations up to 14 mg/kg, compared with less than 1 mg/kg in syrup from untreated trees.

In other processed foods, the highest concentrations (i.e., 267 mg/kg) have been reported in the outer layer of smoked ham 39) and in some varieties of Italian cheese, where formaldehyde is permitted for use under regulation as a bacteriostatic agent 40. Hexamethylenetetramine, a complex of formaldehyde and ammonia that decomposes slowly to its constituents under acid conditions, has been used as a food additive in fish products such as herring and caviar in the Scandinavian countries 41.

Concentrations of formaldehyde in a variety of alcoholic beverages ranged from 0.04 to 1.7 mg/litre in Japan 42 and from 0.02 to 3.8 mg/liter in Brazil (de Andrade et al., 1996). In earlier work conducted in Canada, Lawrence & Iyengar (1983) compared levels of formaldehyde in bottled and canned cola soft drinks (7.4–8.7 mg/kg) and beer (0.1–1.5 mg/kg) and concluded that there was no significant increase in the formaldehyde content of canned beverages due to the plastic inner coating of the metal containers. Concentrations of 3.4 and 4.5 mg/kg in brewed coffee and 10 and 16 mg/kg in instant coffee were reported in the USA 43. These concentrations reflect the levels in the beverages as consumed.

In a more recent study, the concentrations of formaldehyde in commercial 2% milk and in fresh milk from cows fed on a typical North American dairy total mixed diet were determined. Concentrations in the fresh milk (i.e., from Holstein cows, morning milking) ranged from 0.013 to 0.057 mg/kg, with a mean concentration (n = 18) of 0.027 mg/kg, while concentrations in processed milk (i.e., 2% milk fat, partly skimmed, pasteurized) ranged from 0.075 to 0.255 mg/kg, with a mean concentration (n = 12) of 0.164 mg/kg. The somewhat higher concentrations in the commercial 2% milk were attributed to processing technique, packaging, and storage, but these factors were not assessed further 44.

The degree to which formaldehyde in various foods is bioavailable following ingestion is not known.

From these figures, background levels in food products of formaldehyde are very variable and range from values below 1 mg/kg in milk to over 200 mg/kg in some fish species 32. Assuming a person would be eating one kilogram of food per day (including milk, fish, meat, ham, vegetables, fruit) and giving of the variability of background formaldehyde concentration in raw commodities and food products, it was assumed that oral exposure to formaldehyde in humans from dietary sources would not exceed 100 mg formaldehyde per day corresponding to 1.7 and 1.4 mg/kg body weight per day for 60 kg and 70 kg respectively. It should be noted that these exposure estimates do not include endogenously produced formaldehyde from dietary and endogenous sources of methanol. Table 1 summarizes the background levels of formaldehyde in a range of food commodities as described in literature.

Table 1. Background levels of formaldehyde in food

Food ProductFormaldehyde content mg/kg
Meat and poultry5.7-20 mg/kg
Fish6.4-293 mg/kg
Milk and milk products0.01-0.80 mg/kg
Sugar and sweeteners0.75 mg/kg
Fruit and vegetables6-35 mg/kg
Coffee3.4-16 mg/kg
Alcohol beverages0.27-3.0 mg/kg
[Source 11]

Considering such wide variability in formaldehyde concentrations and assuming a person would be eating one kilogram of food per day, it was assumed that oral exposure to formaldehyde in humans would not exceed 100 mg formaldehyde per day, corresponding to 1.7 and 1.4 mg/kg body weight per day for 60 kg and 70 kg respectively. Carry over in animal tissues has been measured in a few limited tissue deposition studies, mostly in cows and the data showed a maximum increase in formaldehyde concentration between 0.1-0.2 mg/kg milk or meat. Such levels of formaldehyde resulting from the consumption of milk or meat from animals fed with formaldehyde-supplemented feed would represent 0.1-0.3 % of human oral exposure from background levels in food products and would be below 0.001 % considering the endogenous formaldehyde turnover. Such levels were considered negligible 11.

Based on the analysis of the European Food Safety Authority Scientific Panel on Food Additives and Nutrient Sources added to Food using actual usage data, methanol from aspartame was estimated to contribute to 0.5-9.7 % of the total daily exposure to endogenous and exogenous methanol. For formaldehyde, and assuming exposure to aspartame at the current Acceptable Daily Intake of 40 mg/kg body weight per day together with a 10 % conversion to methanol with further conversion to formaldehyde, a daily exposure of 4 mg/kg body weight per day is estimated. This exposure would only contribute to approximately 0.3-0.4 % of human oral exposure from background levels in food products and endogenous turnover.

Summary

  • Formaldehyde is an essential metabolic intermediate present in all cells at an intracellular concentration of around 400 μM (12 mg/L) which is synthesised endogenously. Sources of endogenous formaldehyde include the one carbon pool, amino acid metabolism, methanol metabolism, lipid peroxidation, and P450 dependent demethylation.
  • Formaldehyde metabolism is rapid and catalysed by glutathione-dependent formaldehyde dehydrogenase and S-formyl-glutathione hydrolase to formic acid. Formic acid then enters the one-carbon pool and is either excreted in the urine or oxidised to carbon dioxide and exhaled. The electrophilic nature of formaldehyde makes it reactive with a variety of endogenous molecules, including glutathione, proteins, nucleic acids, and folic acid.
  • Formaldehyde concentration in the blood of mammals resulting from endogenous production is similar in different species with 2.2, 2.4 and 2.6 mg/L in the rat, monkey and humans respectively. Formaldehyde half life in humans is very short and has been estimated to be within 1-1.5 min associated with a volume of distribution approximately corresponding to total body water (49 L). Total content of formaldehyde in the human body has been estimated assuming its presence in all aqueous body fluids and a range of half-lives of 1 and 1.5 min, daily endogenous turn over of formaldehyde has been estimated to be around 878-1310 mg/kg body weight per day.
  • Background levels in food products of formaldehyde are very variable and range from values below 1 mg/kg in milk to over 200 mg/kg in some fish species. Considering the wide variability of formaldehyde concentrations in food, daily exposure to formaldehyde from would not exceed 100 mg per kilogram of food and per person.
  • Carry over in animal tissue or products of formaldehyde has been measured in a few limited tissue deposition studies mostly available in cows and showed a maximum increase in concentration between 0.1-0.2 mg/kg milk or meat (muscle). The levels of formaldehyde resulting from the consumption of milk or meat from animals fed with formaldehydesupplemented feed would be around 0.1 % of the background levels of formaldehyde in food products and below 0.001 % of daily endogenous turnover of formaldehyde. Such levels are considered negligible.
  • Oral exposure to formaldehyde derived from aspartame-derived methanol at the current acceptable daily intake of aspartame would be 4 mg/kg body weight per day assuming a 10 % conversion. Such exposure only represents 0.3-0.4 % of the combined background level in food and the daily turnover of formaldehyde for an adult.

Formaldehyde exposure

The global production of formaldehyde in 1999 is estimated to be 5 – 6 million tons. Formaldehyde is mainly used as an intermediate in the chemical industry for the production of condensed resins for the wood, paper and textile processing industries and in the synthesis of methylene dianiline, diphenylmethane diisocyanate, hexamethylenetetraamine, trimethylol propane, neopentylglycol, pentaerythritol and acetylenic agents 7. Aqueous solutions of formaldehyde are employed as germicides, bactericides and fungicides 7. The use of formaldehyde as biocide and in other applications is estimated to be 1.5 % of the total production, i.e. 75,000 to 90,000 ton per annum related to the worldwide production amount.

Formaldehyde is also used as a preservative in a large number of consumer products, such cosmetics and household cleaning agents. Tobacco smoke as well as urea-formaldehyde foam insulation and formaldehyde-containing disinfectants are all important sources of formaldehyde exposure. Releases into the environment are likely to occur during production and processing as intermediate as well as from use of products containing the substance.

Since formaldehyde (also a product of intermediary metabolism) is water soluble, highly reactive with biological macromolecules, and rapidly metabolized, adverse effects resulting from exposure are observed primarily in those tissues or organs with which formaldehyde first comes into contact (i.e., the respiratory and aerodigestive tract, including oral and gastrointestinal mucosa, following inhalation or ingestion, respectively) 12.

Sensory irritation of the eyes and respiratory tract by formaldehyde has been observed consistently in clinical studies and epidemiological surveys in occupational and residential environments. 12 At concentrations higher than those generally associated with sensory irritation, formaldehyde may also contribute to the induction of generally small, reversible effects on lung function.

For the general population, dermal exposure to concentrations of formaldehyde, in solution, in the vicinity of 1–2% (10,000–20,000 mg/liter) is likely to cause skin irritation; however, in hypersensitive individuals, contact dermatitis can occur following exposure to formaldehyde at concentrations as low as 0.003% (30 mg/liter) 12. In North America, less than 10% of patients presenting with contact dermatitis may be immunologically hypersensitive to formaldehyde. Although it has been suggested in case reports for some individuals that formaldehyde-induced asthma was attributable to immunological mechanisms, no clear evidence has been identified. However, in studies with laboratory animals, formaldehyde has enhanced their sensitization to inhaled allergens 12.

Following inhalation in laboratory animals, formaldehyde causes degenerative non-neoplastic effects in mice and monkeys and nasal tumours in rats. In vitro, formaldehyde induced DNA–protein crosslinks, DNA single-strand breaks, chromosomal aberrations, sister chromatid exchange, and gene mutations in human and rodent cells. Formaldehyde administered by inhalation or gavage to rats in vivo induced chromosomal anomalies in lung cells and micronuclei in the gastrointestinal mucosa. The results of epidemiological studies in occupationally exposed populations are consistent with a pattern of weak positive responses for genotoxicity, with good evidence of an effect at site of contact (e.g., micronucleated buccal or nasal mucosal cells). Evidence for distal (i.e., systemic) effects is equivocal. Overall, based on studies in both animals and humans, formaldehyde is weakly genotoxic, with good evidence of an effect at site of contact, but less convincing evidence at distal sites. Epidemiological studies taken as a whole do not provide strong evidence for a causal association between formaldehyde exposure and human cancer, although the possibility of increased risk of respiratory cancers, particularly those of the upper respiratory tract, cannot be excluded on the basis of available data. Therefore, based primarily upon data derived from laboratory studies, the inhalation of formaldehyde under conditions that induce cytotoxicity and sustained regenerative proliferation is considered to present a carcinogenic hazard to humans.

Environmental toxicity data are available for a wide range of terrestrial and aquatic organisms. Based on the maximum concentrations measured in air, surface water, effluents, and groundwater in the sample exposure scenario from the source country and on the estimated no-effects values derived from experimental data for terrestrial and aquatic biota, formaldehyde is not likely to cause adverse effects on terrestrial or aquatic organisms.

Consumer products

Formaldehyde and formaldehyde derivatives are present in a wide variety of consumer products 45 to protect the products from spoilage by microbial contamination. Formaldehyde is used as a preservative in household cleaning agents, dishwashing liquids, fabric softeners, shoe care agents, car shampoos and waxes, carpet cleaning agents, etc. 46. Levels of formaldehyde in hand dishwashing liquids and liquid personal cleansing products available in Canada are less than 0.1% (w/w).

Formaldehyde has been used in the cosmetics industry in three principal areas: preservation of cosmetic products and raw materials against microbial contamination, certain cosmetic treatments such as hardening of fingernails, and plant and equipment sanitation 47. Formaldehyde is also used as an antimicrobial agent in hair preparations, lotions (e.g., suntan lotion and dry skin lotion), makeup, and mouthwashes and is also present in hand cream, bath products, mascara and eye makeup, cuticle softeners, nail creams, vaginal deodorants, and shaving cream 37.

Some preservatives are formaldehyde releasers. The release of formaldehyde upon their decomposition is dependent mainly on temperature and pH. Information on product categories and typical concentrations for chemical products containing formaldehyde and formaldehyde releasers was obtained from the Danish Product Register Data Base (PROBAS) by Flyvholm & Andersen (1993). Industrial and household cleaning agents, soaps, shampoos, paints/lacquers, and cutting fluids comprised the most frequent product categories for formaldehyde releasers. The three most frequently registered formaldehyde releasers were bromonitropropanediol, bromonitrodioxane, and chloroallylhexaminium chloride 48.

Formaldehyde is present in the smoke resulting from the combustion of tobacco products. Estimates of emission factors for formaldehyde (e.g., µg/cigarette) from mainstream and sidestream and environmental tobacco smoke have been determined by a number of different protocols for cigarettes in several countries.

A range of mainstream smoke emission factors from 73.8 to 283.8 µg/cigarette was reported for 26 US brands, which included non-filter, filter, and menthol cigarettes of various lengths 49. Differences in concentrations reflect differences in tobacco type and brand. More recent information is available from the British Columbia Ministry of Health from tests conducted on 11 brands of Canadian cigarettes. Mainstream smoke emission factors ranged from 8 to 50 µg/cigarette when tested under standard conditions.

Levels of formaldehyde are higher in sidestream smoke than in mainstream smoke. Guerin et al. 50 reported that popular commercial US cigarettes deliver approximately 1000–2000 µg formaldehyde/cigarette in their sidestream smoke. Schlitt & Knöppel 51 reported a mean (n = 5) formaldehyde content of 2360 µg/cigarette in the sidestream smoke from a single brand in Italy. Information from the British Columbia Ministry of Health from tests conducted on 11 brands of Canadian cigarettes indicates that emission factors from sidestream smoke ranged from 368 to 448 µg/cigarette.

Emission factors for toxic chemicals from environmental tobacco smoke, rather than from mainstream or sidestream smoke, have also been determined. This is in part due to concerns that emission factors for sidestream smoke may be too low for reactive chemicals such as formaldehyde, due to losses in the various apparati used to determine sidestream smoke emission factors. Daisey et al. 52 indicated that environmental tobacco smoke emission factors for formaldehyde from six US commercial cigarettes ranged from 958 to 1880 µg/cigarette, with a mean of 1310 ± 349 µg/cigarette. Data concerning emission factors for formaldehyde from environmental tobacco smoke produced by Canadian cigarettes were not identified.

Clothing and fabrics

Formaldehyde-releasing agents provide crease resistance, dimensional stability, and flame retardance for textiles and serve as binders in textile printing 53. Durable-press resins or permanent-press resins containing formaldehyde have been used on cotton and cotton/polyester blend fabrics since the mid-1920s to impart wrinkle resistance during wear and laundering. Hatch & Maibach (1995) identified nine major resins used. These differ in formaldehyde-releasing potential during wear and use.

Priha (1995) indicated that formaldehyde-based resins, such as UF resin, were once more commonly used for crease resistance treatment; more recently, however, better finishing agents with lower formaldehyde release have been developed. Totally formaldehyde-free crosslinking agents are now available, and some countries have legally limited the formaldehyde content of textile products. In 1990, the percentage of durable-press fabric manufactured in the USA finished with resins rated as having high formaldehyde release was 27%, about one-half the percentage in 1980, according to Hatch & Maibach 54. It has been reported that the average level contained by textiles made in the USA is approximately 100–200 µg free formaldehyde/g 55.

Piletta-Zanin et al. 56 studied the presence of formaldehyde in moist baby toilet tissues and tested 10 of the most frequently sold products in Switzerland. One product contained more than 100 µg/g, five products contained between 30 and 100 µg/g, and the remaining four products contained less than 30 µg formaldehyde/g.

Building materials

The emission of formaldehyde from building materials has long been recognized as a significant source of the elevated concentrations of formaldehyde frequently measured in indoor air. Historically, the most important indoor source among the many materials used in building and construction has been urea-formaldehyde foam insulation, which is produced by the aeration of a mixture of urea-formaldehyde resin and an aqueous surfactant solution containing a curing catalyst 57. Urea-formaldehyde foam insulation was banned from use in Canada in 1980 and in the USA in 1982, although the US ban was subsequently overturned.

Pressed wood products (i.e., particleboard, medium-density fibreboard, and hardwood plywood) are now considered the major sources of residential formaldehyde contamination 58. Pressed wood products are bonded with urea-formaldehyde resin; it is this adhesive portion that is responsible for the emission of formaldehyde into indoor air. The emission rate of formaldehyde is strongly influenced by the nature of the material. Generally, release of formaldehyde is highest from newly made wood products. Emissions then decrease over time, to very low rates, after a period of years 59.

Concentrations of formaldehyde in indoor air are primarily determined by such factors as source strength (i.e., mass of substance released per unit time or per unit area), loading factors (i.e., the ratio of the surface area of a source [e.g., a particleboard panel] to the volume of an enclosed area [e.g., a room] where the source is present), and the presence of source combinations 59. Emission rates for formaldehyde from pressed wood products determined by emission chamber testing in Canada 60 are now typically less than 0.3 mg/m2 per hour 61.

Formaldehyde release from pressed wood materials is greater in mobile homes than in conventional housing, as mobile homes typically have higher loading ratios (e.g., exceeding 1 m2/m³) of these materials. In addition, mobile homes can have minimal ventilation, are minimally insulated, and are often situated in exposed sites subject to temperature extremes 62.

The use of scavengers (e.g., urea) to chemically remove unreacted formaldehyde while the curing process is taking place has been investigated as a control measure. Other reactants could be used to chemically modify the formaldehyde to a non-toxic derivative or convert it to a non-volatile reaction product. There has also been work to effectively seal the resin and prevent the residual formaldehyde from escaping 63. Surface coatings and treatments (e.g., paper and vinyl decorative laminates) can significantly affect the potential for off-gassing and in some cases can result in an order of magnitude reduction in the emission rates for formaldehyde from pressed wood products 64. On the other hand, high emissions of formaldehyde during the curing of some commercially available conversion varnishes (also known as acid-catalyst varnishes) have been reported. An initial emission rate of 29 mg formaldehyde/m² per hour was determined for one product 65.

Emission rates for formaldehyde from carpets and carpet backings, vinyl floorings, and wall coverings in the source country (Canada) are now generally less than 0.1 mg/m² per hour 61.

Formaldehyde uses

Formaldehyde is used mostly to make resins used in building materials, coatings for paper and clothing fabrics, and synthetic fibers. Phenolic, urea, and melamine resins have wide uses as adhesives and binders in the wood-production, pulp-and-paper, and the synthetic vitreousfibre industries, in the production of plastics and coatings, and in textile finishing. Polyacetal resins are widely used in the production of plastics. Formaldehyde is also used extensively as an intermediate in the manufacture of industrial chemicals, such as 1,4-butanediol, 4,4′-methylenediphenyl diisocyanate, penta-erythritol, and hexamethylenetetramine. Formaldehyde is used directly in aqueous solution (known as formalin) as a disinfectant and preservative in many applications 66.

A second major use is as a starting chemical to make other chemicals. It is found in smoke from burning tobacco or fuels. Building materials with formaldehyde include certain insulation materials, glues, and pressed wood products like particle board, plywood, and fiberboard. Products containing urea and formaldehyde are used as slow-release nitrogen fertilizers in farming and gardening. Formaldehyde is also used as a preservative in mortuaries and medical laboratories, and as an antimicrobial agent and disinfectant for industrial processes and some household purposes.

Formaldehyde is used in the animal feed industry, where it is added to ruminant feeds to improve handling characteristics. The food mixture contains less than 1% formaldehyde, and animals may ingest as much as 0.25% formaldehyde in their diet 41. Formalin has been added as a preservative to skim milk fed to pigs in the United Kingdom 67 and to liquid whey (from the manufacture of cheddar and cottage cheeses) fed to calves and cows in Canada. Maximum concentrations in the milk of cows fed whey with the maximum level of formalin tested (i.e., 0.15%) were up to 10-fold greater (i.e., 0.22 mg/kg) than levels in milk from control cows fed whey without added formalin 68.

Formaldehyde toxicity

Extensive recent data are available for concentrations of formaldehyde in air at industrial, urban, suburban, rural, and remote locations in the source country (Canada). There are fewer but still considerable data on concentrations in indoor air, which are higher. Data on concentrations in water are more limited. Although formaldehyde is a natural component of a variety of foodstuffs, monitoring has generally been sporadic and source directed. Based on available data, the highest concentrations of formaldehyde occurring naturally in foods are in some fruits and marine fish. Formaldehyde may also be present in food due to its use as a bacteriostatic agent in production and its addition to animal feed to improve handling characteristics. Formaldehyde and formaldehyde derivatives are also present in a wide variety of consumer products to protect the products from spoilage by microbial contamination. The general population is also exposed during release from combustion (e.g., from cigarettes and cooking) and emission from some building materials, such as pressed wood products.

Formaldehyde is a highly reactive gas that is absorbed quickly at the point of contact and is also produced by endogenous metabolism 7. Formaldehyde is rapidly metabolized, such that exposure to high concentrations (up to 15 ppm in rats) does not result in increased blood concentrations. Repeated formaldehyde exposure caused toxic effects only in the tissues of direct contact after inhalation, oral or dermal exposure characterized by local cytotoxic destruction and subsequent repair of the damage 7. The typical locations of lesions in experimental animals were the nose after inhalation, the stomach after oral administration and the skin after dermal application. The nature of the lesions depended on the inherent abilities of the tissues involved to respond to the noxious event and on the local concentration of the substance. Atrophy and necrosis as well as hyper- and metaplasia of epithelia may occur. The most sensitive No Observed Adverse Effect Levels (NOAELs) for morphological lesions were between 1 and 2 ppm for inhalation exposure and about 260 mg/liter in drinking water 7.

Formaldehyde had acute effects in mammals: LD50 (lethal dose 50 is where 50% of the test subjects die) (rat, oral) 600 – 800 mg/kg body weight, LC50 (lethal concentration 50 is the lethal concentration required to kill 50% of the population) (rat, inhalation, 4 hour) 578 mg/m3 (480 ppm) 7. Inhalation of high concentrations ( > 120 mg/m³) of formaldehyde caused hypersalivation, acute dyspnea, vomiting, muscular spasms, convulsions and finally deaths. Histopathology examination showed respiratory tract irritation, bronchioalveolar constriction and lung oedema. Formaldehyde was irritating to the eyes, and aqueous solutions of formaldehyde (0.1% to 20%) were irritating to the skin of rabbits. Formaldehyde was sensitising in the guinea pig maximization test and the local lymph node assay with mice. On the other hand, specially designed studies (IgE tests, cytokine secretion profiles of lymph node cells) did not reveal evidence of respiratory sensitization in mice.

Formaldehyde is weakly genotoxic and was able to induce gene mutations and chromosomal aberrations in mammalian cells. DNA-protein crosslinks are a sensitive measure of DNA modification by formaldehyde. However, the genotoxic effects were limited to those cells, which are in direct contact with formaldehyde, and no effects could be observed in distant-site tissues. In conclusion, formaldehyde is a direct acting locally effective mutagen 7.

In humans, transient and reversible sensory irritation of the eyes and respiratory tract has been observed in clinical studies and epidemiological surveys 7. Odor threshold for most people ranges between 0.5 and 1 ppm (parts per million). PPM (parts per million) is a way of expressing very dilute concentrations of substances. Parts per million (ppm) means out of a million. Usually describes the concentration of something in water or soil. One ppm is equivalent to 1 milligram of something per liter of water (mg/l) or 1 milligram of something per kilogram soil (mg/kg). In general, eye irritation, the most sensitive endpoint, is associated with airborne concentrations beginning in the range of 0.3 to 0.5 ppm. Eye irritation does not become significant until about 1 ppm, and rapidly subsides. Moderate to severe eye, nose and throat irritation occurs at 2 to 3 ppm 7. Sensory irritation has also been reported at lower exposure levels, but is then difficult to distinguish from background. Most studies show no effect on lung function in either asthmatics or non-asthmatics. Formaldehyde causes skin irritation and has corrosive properties when ingested. In some individuals, contact dermatitis may occur at challenge concentrations as low as 30 ppm 7.

The majority of the general population is exposed to airborne concentrations of formaldehyde less than those associated with sensory irritation (i.e., 0.083 ppm [0.1 mg/m³]). However, in some indoor locations, concentrations may approach those associated with eye and respiratory tract sensory irritation in humans. Risks of cancer estimated on the basis of a biologically motivated case-specific model for calculated exposure of the general population to formaldehyde in air based on the sample exposure scenario for the source country (Canada) are exceedingly low. This model incorporates two-stage clonal growth modelling and is supported by dosimetry calculations from computational fluid dynamics modelling of formaldehyde flux in various regions of the nose and single-path modelling for the lower respiratory tract.

Chronic inhalation of concentrations of 10 ppm and higher led to clear increases in nasal tumor incidence in rats 7. Most of the nasal tumors were squamous cell carcinomas (SCCs). Marked non-neoplastic pathological lesions of the nasal epithelium accompanied them. No increased incidence of tumors was found in other organs after inhalation, and administration routes other than inhalation did not result in local or systemic tumor formation 7. The damage of nasal tissue played a crucial role in the tumor induction process, since nasal cancer was only found at concentrations inducing epithelial degeneration and increased cell proliferation. Thus the stimulation of cell proliferation seems to be an important prerequisite for tumor development. Although formaldehyde exhibits some genotoxic activity, the correlation between cytotoxicity, cell proliferation and the induction of nasal cancer in rats provides a convincing scientific basis for the cause of the carcinogenic response to be cytotoxicity driven. In contrast to that, no significant numbers of tumors were seen in mice and Syrian hamsters following chronic exposure to concentrations up to 14.3 or 30 ppm, respectively 7. These clear species differences appeared to be related, in part, to the local dosimetry and disposition of formaldehyde in nasal tissues. Species differences in nasal anatomy and respiratory physiology may have a profound effect on susceptibility to formaldehyde-induced nasal tumors.

In epidemiological studies in occupationally exposed human populations, there is limited evidence of a causal association between formaldehyde exposure and nasal tumors 7. Taking into account the extensive information on its mode of action, formaldehyde is not likely to be a potent carcinogen to humans under low exposure conditions 7.

There are no indications of a specific toxicity of formaldehyde to fetal development and no effects on reproductive organs were observed after chronic oral administration of formaldehyde to male and female rats. Amounts of formaldehyde which produce marked toxic effects at the portal of entry, do not lead to an appreciable systemic dose and thus do not produce systemic toxicity. This is consistent with formaldehyde’s high reactivity with many cellular nucleophiles and its rapid metabolic degradation.

Common sources of exposure include vehicle emissions, particle boards and similar building materials, carpets, paints and varnishes, foods and cooking, tobacco smoke, and the use of formaldehyde as a disinfectant. Levels of formaldehyde in outdoor air are generally low but higher levels can be found in the indoor air of homes.

Occupational exposure to formaldehyde occurs in a wide variety of occupations and industries: for example, it is estimated that more than one million workers are exposed to some degree across the European Union. Short-term exposures to high levels have been reported for embalmers, pathologists and paper workers. Lower levels have usually been encountered during the manufacture of man-made vitreous fibres, abrasives and rubber and in formaldehyde production industries. A very wide range of exposure levels has been observed in the production of resins and plastic products. The development of resins that release less formaldehyde and improved ventilation has resulted in decreased exposure levels in many industrial settings in recent decades.

References
  1. Formaldehyde http://www.inchem.org/documents/cicads/cicads/cicad40.htm
  2. FORMALDEHYDE. https://monographs.iarc.fr/wp-content/uploads/2018/06/mono100F-29.pdf
  3. IARC CLASSIFIES FORMALDEHYDE AS CARCINOGENIC TO HUMANS. PRESS RELEASE N° 153; 15 June 2004 https://www.iarc.fr/en/media-centre/pr/2004/pr153.html
  4. Report on Carcinogens Background Document for Formaldehyde. January 22, 2010. https://ntp.niehs.nih.gov/ntp/roc/twelfth/2009/november/formaldehyde_bd_final.pdf
  5. WHO (2000) Air quality guidelines for Europe, 2nd ed. Copenhagen, World Health Organization, Regional Office for Europe (WHO Regional Publications, European Series, No. 91).
  6. IPCS (1996) Guidelines for drinking-water quality. Vol. 2. Health criteria and other supporting information. Geneva, World Health Organization, International Programme on Chemical Safety, 973 pp.
  7. Formaldehyde. http://www.inchem.org/documents/sids/sids/FORMALDEHYDE.pdf
  8. Kieber RJ, Zhou X, Mopper K (1990) Formation of carbonyl compounds from UV-induced photodegradation of humic substances in natural waters: Fate of riverine carbon in the sea. Limnology and oceanography, 35(7):1503–1515.
  9. IARC (1995) Wood dust and formaldehyde. Lyon, International Agency for Research on Cancer, pp. 217–375 (IARC Monographs on the Evaluation of Carcinogenic Risks to Humans, Volume 62).
  10. Nuccio J, Seaton PJ, Kieber RJ (1995) Biological production of formaldehyde in the marine environment. Limnology and oceanography, 40(3):521–527.
  11. Endogenous formaldehyde turnover in humans compared with exogenous contribution from food sources. European Food Safety Authority. EFSA Journal 2014;12(2):3550 https://efsa.onlinelibrary.wiley.com/doi/epdf/10.2903/j.efsa.2014.3550
  12. Formaldehyde http://www.inchem.org/documents/cicads/cicads/cicad40.htm
  13. Environment Canada (1999a) Canadian Environmental Protection Act — Priority Substances List — Supporting document for the environmental assessment of formaldehyde. Hull, Quebec, Environment Canada, Commercial Chemicals Evaluation Branch.
  14. Environment Canada (1996) Summary report — 1994. National Pollutant Release Inventory (NPRI). Hull, Quebec, Environment Canada, Pollution Data Branch.
  15. Environment Canada (1997b) Results of the CEPA Section 16 Notice to Industry respecting the second Priority Substances List and di(2-ethylhexyl) phthalate. Hull, Quebec, Environment Canada, Commercial Chemicals Evaluation Branch, Use Patterns Section.
  16. Baker DC (1994) Projected emissions of hazardous air pollutants from a Shell coal gasification process-combined-cycle power plant. Fuel, 73(7):1082–1086.
  17. IPCS (1989) Formaldehyde. Geneva, World Health Organization, International Programme on Chemical Safety, 219 pp. Environmental Health Criteria 89.
  18. Health Canada (1997) Health Canada 1994 Survey on Smoking in Canada. Chronic diseases in Canada, 18(3):120–129.
  19. Sverdrup GM, Riggs KB, Kelly TJ, Barrett RE, Peltier RG, Cooper JA (1994) Toxic emissions from a cyclone burner boiler with an ESP and with the SNOX demonstration and from a pulverized coal burner boiler with an ESP/wet flue gas desulfurization system. Presented at the 87th Annual Meeting and Exhibition of the Air and Waste Management Association, Cincinnati, OH, 19–24 June 1994 (94-WA73.02).
  20. US EPA (1993) Motor vehicle-related air toxics study. Ann Arbor, MI, US Environmental Protection Agency, Office of Mobile Sources, Emission Planning and Strategies Division, April (EPA 420-R-93-005).
  21. Chan GS, Scafe M, Emami S (1992) Cemeteries and groundwater: An examination of the potential contamination of groundwater by preservatives containing formaldehyde. Toronto, Ontario, Ontario Ministry of the Environment, Water Resources Branch.
  22. TRI (1994) 1992 Toxics Release Inventory, public data release. Washington, DC, US Environmental Protection Agency, Office of Pollution Prevention and Toxics, p. 236.
  23. Environment Canada (1995) Technical briefing note on composite wood panels. Report prepared for Environmental Choice Program, Environment Canada, Ottawa, Ontario, 18 May 1995.
  24. IARC CLASSIFIES FORMALDEHYDE AS CARCINOGENIC TO HUMANS. PRESS RELEASE N° 153, 15 June 2004 https://www.iarc.fr/en/media-centre/pr/2004/pr153.html
  25. Zhang LSCED, Steinmaus C, Eastmond DA et al. (2009). Formaldehyde exposure and leukemia: a new meta-analysis and potential mechanisms. Mutat Res, 681: 150–168. doi:10.1016/j.mrrev.2008.07.002 https://www.ncbi.nlm.nih.gov/pubmed/18674636
  26. EFSA ANS Panel (EFSA Panel on Food Additives and Nutrient Sources added to Food), 2013. Scientific Opinion on the re-evaluation of aspartame (E 951) as a food additive. EFSA Journal 2013;11(12):3496, 263 pp. doi:10.293/j.efsa.2013.3496
  27. Dhareshwar SS and Stella VJ, 2008. Your Prodrug Releases Formaldehyde: Should you be Concerned? No! Journal of Pharmaceutical Sciences, 97, 4184-4193.
  28. NTP (National Toxicology Program), 2011. Formaldehyde. Report on Carcinogens, Twelfth Edition.
  29. Sullivan JB and Krieger GR, 2001. Formaldehyde. In: Clinical Environmental Health Toxic Exposures. 2nd ed. Philadelphia: Lippincott Williams and Wilkins, 1006-1014.
  30. Trezl L, Csiba A, Juhasz S, Szentgyorgyi M, Lombai G and Hullan L, 1997. Endogenous formaldehyde level of foods and its biological significance. Zeitschrift für Lebensmittel-Untersuchung und -Forschung, 205, 300-304.
  31. Rétfalvi T, Németh ZI, Sarudi I and Albert L. 1998 Alteration of endogenous formaldehyde level following mercury accumulation in different pig tissues. Acta Biologica Hungarica, 49, 375-379
  32. Weng X, Chon CH, Jiang H and Li D, 2009. Rapid detection of formaldehyde concentration in food on a polydimethylsiloxane (PDMS) microfluidic chip. Food Chemistry, 114, 1079-1089.
  33. Sotelo CG, Piñeiro C, Pérez-Martín RI (1995) Denaturation of fish protein during frozen storage: role of formaldehyde. Zeitschrift für Lebensmittel-Untersuchung und -Forschung, 200:14–23.
  34. Tsuda M, Frank N, Sato S, Sugimura T (1988) Marked increase in the urinary level of N-nitrosothioproline after ingestion of cod with vegetables. Cancer research, 48:4049–4052.
  35. Yasuhara A, Shibamoto T (1995) Quantitative analysis of volatile aldehydes formed from various kinds of fish flesh during heat treatment. Journal of agricultural and food chemistry, 43:94–97.
  36. Tashkov W (1996) Determination of formaldehyde in foods, biological media and technological materials by head space gas chromatography. Chromatographia, 43(11/12):625–627.
  37. ATSDR (1999) Toxicological profile for formaldehyde. Atlanta, GA, US Department of Health and Human Services, Agency for Toxic Substances and Disease Registry.
  38. Baraniak Z, Nagpal DS, Neidert E (1988) Gas chromatographic determination of formaldehyde in maple syrup as 2,4-dinitrophenylhydrazone derivative. Journal of the Association of Official Analytical Chemists, 71(4):740–741.
  39. Brunn W, Klostermeyer H (1984) [Detection and determination of formaldehyde in foods.] Lebensmittelchemie und Gerichtliche Chemie, 38:16–17 (in German
  40. Restani P, Restelli AR, Galli CL (1992) Formaldehyde and hexamethylenetetramine as food additives: chemical interactions and toxicology. Food additives and contaminants, 9(5):597–605.
  41. Scheuplein RJ (1985) Formaldehyde: The Food and Drug Administration’s perspective. In: Turoski V, ed. Formaldehyde — analytical chemistry and toxicology. Washington, DC, American Chemical Society, pp. 237–245. Advances in Chemistry Series 210.
  42. Tsuchiya H, Ohtani S, Yamada K, Akagiri M, Takagi N, Sato M (1994) Determination of formaldehyde in reagents and beverages using flow injection. Analyst, 119:1413–1416.
  43. Hayashi T, Reece CA, Shibamoto T (1986) Gas chromatographic determination of formaldehyde in coffee via thiazolidine derivative. Journal of the Association of Official Analytical Chemists, 69(1):101–105
  44. Kaminski J, Atwal AS, Mahadevan S (1993) Determination of formaldehyde in fresh and retail milk by liquid column chromatography. Journal of the Association of Official Analytical Chemists international, 76(5):1010–1013.
  45. Preuss PW, Dailey RL, Lehman ES (1985) Exposure to formaldehyde. In: Turoski V, ed. Formaldehyde — analytical chemistry and toxicology. Washington, DC, American Chemical Society, pp. 247–259. Advances in Chemistry Series 210.
  46. IPCS (1989) Formaldehyde. Geneva, World Health Organization, International Programme on Chemical Safety, 219 pp. (Environmental Health Criteria 89).
  47. Jass HE (1985) History and status of formaldehyde in the cosmetics industry. In: Turoski V, ed. Formaldehyde — analytical chemistry and toxicology. Washington, DC, American Chemical Society, pp. 229–236 (Advances in Chemistry Series 210).
  48. Flyvholm M-A, Andersen P (1993) Identification of formaldehyde releasers and occurrence of formaldehyde and formaldehyde releasers in registered chemical products. American journal of industrial medicine, 24:533–552.
  49. Miyake T, Shibamoto T (1995) Quantitative analysis by gas chromatography of volatile carbonyl compounds in cigarette smoke. Journal of chromatography, A 693:376–381.
  50. Guerin MR, Jenkins RA, Tomkins BA (1992) The chemistry of environmental tobacco smoke: composition and measurement. Boca Raton, FL, Lewis Publishers.
  51. Schlitt H, Knöppel H (1989) Carbonyl compounds in mainstream and sidestream cigarette smoke. In: Bieva C, Courtois Y, Govaerts M, eds. Present and future of indoor air quality. Amsterdam, Excerpta Medica, pp. 197–206.
  52. Daisey JM, Mahanama KRR, Hodgson AT (1994) Toxic volatile organic compounds in environmental tobacco smoke: Emission factors for modelling exposures of California populations. Prepared for Research Division, Air Resources Board, California Environmental Protection Agency, Sacramento, CA, 109 pp. (Contract No. A133-186).
  53. Priha E (1995) Are textile formaldehyde regulations reasonable? Experiences from the Finnish textile and clothing industries. Regulatory toxicology and pharmacology, 22:243–249.
  54. Hatch KL, Maibach HI (1995) Textile dermatitis: an update (I). Resins, additives and fibers. Contact dermatitis, 32:319–326.
  55. Scheman AJ, Carrol PA, Brown KH, Osburn AH (1998) Formaldehyde-related textile allergy: an update. Contact dermatitis, 38:332–336.
  56. Piletta-Zanin PA, Pasche-Koo F, Auderset PC, Huggenberger D, Saurat J-H, Hauser C (1996) Detection of formaldehyde in ten brands of moist baby toilet tissue by the acetylacetone methods and high-performance liquid chromatography. Dermatology, 193:170.
  57. Meek ME, Atkinson A, Sitwell J (1985) Background paper on formaldehyde prepared for WHO working group on indoor air quality: radon and formaldehyde. Ottawa, Ontario, Health and Welfare Canada, Health Protection Branch, Bureau of Chemical Hazards, pp. 1–124.
  58. Etkin DS (1996) Volatile organic compounds in indoor environments. Arlington, MA, Cutter Information Corp., 426 pp.
  59. Godish T (1988) Residential formaldehyde contamination: sources and levels. Comments on toxicology, 2(3):115–134.
  60. Piersol P (1995) Build Green and conventional materials off-gassing tests. Prepared by ORTECH Corporation for Canada Mortgage and Housing Corporation, 6 February 1995, 24 pp. (Report No. 94-G53-B0106).
  61. Health Canada (2000) Draft supporting documentation for PSL2 assessments. Human exposure assessment for formaldehyde. Ottawa, Ontario, Health Canada, Health Protection Branch, Priority Substances Section, January 2000.
  62. Meyer B, Hermanns K (1985) Formaldehyde release from pressed wood products. In: Turoski V, ed. Formaldehyde — analytical chemistry and toxicology. Washington, DC, American Chemical Society, pp. 101–116 (Advances in Chemistry Series 210).
  63. Tabor RG (1988) Control of formaldehyde release from wood products adhesives. Comments on toxicology, 2(3):191–200.
  64. Kelly TJ, Smith DL, Satola J (1999) Emission rates of formaldehyde from materials and consumer products found in California homes. Environmental science and technology, 33(1):81–88.
  65. McCrillis RC, Howard EM, Guo Z, Krebs KA, Fortmann R, Lao H-C (1999) Characterization of curing emissions from conversion varnishes. Journal of the Air and Waste Management Association, 49:70–75.
  66. IARC (2006). Formaldehyde, 2-butoxyethanol and 1-tertbutoxypropan-2-ol. IARC Monogr Eval Carcinog Risks Hum, 88: 1–478. https://www.ncbi.nlm.nih.gov/pubmed/9559107
  67. Florence E, Milner DF (1981) Determination of free and loosely protein-bound formaldehyde in the tissues of pigs fed formalin-treated skim milk as a protein supplement. Journal of the science of food and agriculture, 32:288–292.
  68. Buckley KE, Fisher LJ, Mackay VG (1988) Levels of formaldehyde in milk, blood, and tissues of dairy cows and calves consuming formalin-treated whey. Journal of agricultural and food chemistry, 36:1146–1150.
read more
Food Additives

Sodium hydroxide

sodium hydroxide

What is sodium hydroxide

Sodium hydroxide [Na(OH)] also known as caustic soda, is a highly caustic substance that is used to neutralize acids and make sodium salts. Sodium hydroxide is added to food (food additive E 524) as an acidity regulator and its function in food is essentially the same as that in food. Sodium hydroxide is approved as a food additive (E 524) 1 for use as an acidity regulator without limitation (quantum satis) in jams, jellies, marmalades, sweetened chestnut purée, other similar fruit and vegetable spreads, processed cereal-based foods and baby foods, other foods for young children, dietary foods for infants for special medical purposes and special formulas for infants. Sodium hydroxide is also approved for use in food additives, food enzymes, food flavourings and nutrients with no limitation (quantum satis) 2. Sodium hydroxide was assessed by the Joint FAO/WHO (Food and Agriculture Organization/World Health Organization) Committee on Food Additives 3 and by the Scientific Committee for Food 4, and both set an acceptable daily intake (ADI) of “not specified”.

Sodium hydroxide is a manufactured substance and sodium hydroxide [Na(OH)] is sold as a solid (cast, flakes, pearls, compounders) or as solutions with varying concentrations. The most important industrial concentration is 50 %. Sodium hydroxide is used for example for cleaning, disinfection, wood treatment and to make soap at home, but many other uses could exist. At room temperature, sodium hydroxide is a white crystalline odorless solid that absorbs moisture from the air. Sodium hydroxide [Na(OH)] solidifies at 20 °C if the concentration is higher than 52 % (by weight), which can be considered the maximum water solubility at 20 °C. When dissolved in water or neutralized with acid it liberates substantial heat, which may be sufficient to ignite combustible materials. Sodium hydroxide is very corrosive. It is generally used as a solid or a 50% solution. Other common names include caustic soda and lye. Sodium hydroxide is used to manufacture soaps, rayon, paper, explosives, dyestuffs, and petroleum products. It is also used in processing cotton fabric, laundering and bleaching, metal cleaning and processing, oxide coating, electroplating, and electrolytic extracting. It is commonly present in commercial drain and oven cleaners.

Sodium hydroxide uses

Sodium hydroxide [Na(OH)] is a strong alkaline substance that dissociates completely in water to sodium (Na+) and hydroxyl (OH) ions. The dissolution/dissociation in water is strongly exothermic, so a vigorous reaction occurs when sodium hydroxide is added to water.

Sodium hydroxide is used to neutralize acid solutions and make sodium salts. Sodium hydroxide is used in the manufacture of rayon, mercerised cotton, soap, paper, aluminium, petroleum products and in metal cleaning, electrolytic extraction of zinc, tin plating and oxide coating. Mercerisation is a treatment for cellulosic material, typically cotton threads, that strengthens them, gives them a lustrous appearance and increases cotton’s affinity to dye, and resistance to mildew.

Sodium hydroxide solutions hydrolyze fats to form soaps, they precipitate bases and most metals (as hydroxides) from aqueous solutions of their salts.

Sodium hydroxide is a common constituent of many household and industrial cleaners including oven cleaners and beerline cleaners. Sodium hydroxide is present as a stabilizing agent in bleach. It may also be found in dishwasher detergents. Some paint strippers and drain cleaners contain sodium hydroxide. It is used as a pipe line cleaner in dairies, bars and public houses.

Sodium hydroxide has mainly industrial uses. On a global level the main uses are 5:

  1. Organic chemicals (18 %)
  2. Pulp and paper (18 %)
  3. Inorganic chemicals (15 %)
  4. Soaps, detergents and textile (12 %)
  5. Alumina (8 %)
  6. Water treatment (5 %)
  7. Others (25 %)

Sodium hydroxide is also used by the drink and beer industry to clean non-disposable bottles. Although main quantities are used by the industry (large enterprises) it is also widely used by small and medium sized enterprises. Sodium hydroxideis used for example for disinfection and cleaning purposes. Sodium hydroxide (up to 100 %) is also used by consumers. Sodium hydroxide is used at home for drain and pipe cleaning, wood treatment and it also used to make soap at home 6. Sodium hydroxide is also used in batteries and in oven-cleaner pads. The previously mentioned uses are only examples of uses but probably many other uses do occur because sodium hydroxide is widely available. However, significant differences in uses between countries can be expected.

Small amounts of sodium hydroxide are produced as a by-product and released into the car interior when motor car air bag systems are activated. Air bag systems are triggered when a sensor in the bumper sends an electrical charge to a gas generator containing sodium azide (70 g). A chemical reaction is initiated that produces nitrogen gas from the sodium azide.

Sodium hydroxide is present in Clinitest(R) tablets which are used by diabetics as an in vitro semiquantitive test for glycosuria.

Sodium hydroxide safety

Solid sodium hydroxide [Na(OH)] is corrosive. Depending on the concentration, solutions of sodium hydroxide are non-irritating, irritating or corrosive and they cause direct local effects on the skin, eyes and gastrointestinal tracts. Based on human data concentrations of 0.5-4.0 % were irritating to the skin, while a concentration of 8.0 % was corrosive for the skin of animals 7. Eye irritation data are available for animals. The non-irritant level was 0.2-1.0 %, while the corrosive concentration was 1.2 % or higher 7. A study with human volunteers did not indicate a skin sensitization potential of sodium hydroxide. This is supported by the extensive human experience.

The acute toxicity of sodium hydroxide depends on the physical form (solid or solution), the concentration and dose. Lethality has been reported for animals at oral doses of 240 and 400 mg/kg body weight 7. Fatal ingestion and fatal
dermal exposure has been reported for humans.

No valid animal data are available on repeated dose toxicity studies by oral, dermal, inhalation or by other routes for sodium hydroxide. However, under normal handling and use conditions (non-irritating) neither the concentration of sodium in the blood nor the pH of the blood will be increased and therefore sodium hydroxide is not expected to be systemically available in the body. It can be stated that sodium hydroxide will neither reach the fetus nor reach male and female
reproductive organs, which shows that there is no risk for developmental toxicity and no risk for toxicity to reproduction. Both in vitro and in vivo genetic toxicity tests indicated no evidence for a mutagenic activity.

Based on the available literature, there is a risk for accidental and intentional exposure to solid sodium hydroxide or to irritating or corrosive solutions of sodium hydroxide. Most of the ingestion accidents seem to be related with children and seem to occur at home. Accidental skin and eye exposure seem to be less frequently reported than ingestion in the medical literature. Dust formation is unlikely because of hygroscopic properties. Furthermore sodium hydroxide has a negligible vapor pressure and is rapidly neutralized in air by carbon dioxide and therefore dust and vapor exposure are not expected.

Toxic dose

The severity of sodium hydroxide injury will depend on a number of factors including the concentration of the sodium hydroxide agent, the duration of contact and the volume ingested. It is greatest where the pH is above 12. However, pH is not the only factor which determines the extent to which a substance can cause corrosive injury. Alkaline reserve (which is the amount of a standard acid solution needed to titrate an alkali to a specified pH usually pH 8, the pH of normal esophageal mucosa) has been found to correlate better than pH with the production of caustic esophageal injury 8. Although this method is not currently used (except internally by some manufacturers to classify products as irritant or corrosive) it appears to be a better predictor of injury than pH. Alkaline reserve may also be referred to as the titratable alkaline reserve.

Sodium hydroxide solid preparations and viscous liquids are also more likely to produce severe injury due to prolonged contact. Following ingestion of a small amount the injury is usually limited to the oropharyngeal region and the esophagus. The greater the volume the greater the risk of duodenal and gastric damage.

Several studies have been carried out in an attempt to correlate clinical effects and injury. Gaudreault et al 9 found that signs and/or symptoms do not adequately predict the presence or severity of an esophageal lesion. Crain et al 10 found that the presence of two or more signs or symptoms (vomiting, drooling, stridor) may be a reliable predictor of esophageal injury. In the study by Nuutinen et al 11 prolonged drooling and dysphagia (12-24 hours) were observed to predict esophageal scar formation with 100% sensitivity. In the study of 224 children (aged 0-14 years) by Clausen et al 12 serious complications were due to ingestion of sodium hydroxide or a dishwasher product. Children without any signs or symptoms at the first examination did not develop stricture or epiglottal edema.

The study by Christesen 13 also found that complications only developed in children who had ingested strong alkalis (sodium hydroxide, ammonia and dishwasher products). The author found that children with respiratory symptoms were at greater risk of developing complications and that liquid sodium hydroxide tended to cause more complications than the granular form. It was also concluded that asymptomatic patients are not at risk of complications and probably do not require endoscopy.

Knopp 14 reported that in patients with oral burns approximately one third had significant esophageal injury, whereas 2-15% of patients with esophageal injury had no oral burns.

Clinitest(R) tablets

Ingestion of 1 tablet is sufficient to cause esophageal stricture. However, ingestion of 47 tablets over 1 month by an adult caused only gastritis and eschar formation in the lower two thirds of the stomach with full recovery 15.

Mechanism of toxicity action

Alkalis cause liquifactive necrosis with saponification of fats and solubilisation of proteins. There is a decrease in the collagen content of tissue and saponification of cell membrane lipids and cellular death. They are also hygroscopic and will absorb water from the tissues. These effects result in adherence and deep penetration into the tissues.

Ingestion

Alkalis cause the most severe corrosive effects on the esophagus, rather than the stomach as is the case with acids. However, following deliberate ingestion of a large quantity of an alkali (as with intentional ingestion in adults) both the stomach and small intestine may be involved. This is particularly the case with liquid sodium hydroxide.

Esophageal changes can be divided into 3 stages:

  1. Acute necrotic phase in which cell death occurs due to coagulation of intracellular protein,
  2. Intense inflammatory reaction in viable tissues surrounding the necrotic area, thrombosis of vessels occurs,
  3. Sloughing of superficial necrotic layer 2-4 days later 16.

Strictures form due to an intense fibroblastic reaction and superficial granulation tissue formation that terminates with extensive scar formation and luminal narrowing. The newly formed collagen contracts both cirumferentially and longitudinally resulting in esophageal shortening and stricture formation.

Clinitest(R) tablets

The sodium hydroxide in these tablets reacts with the saliva and liberates heat which can produce a full thickness burn of the oesophagus. Clinitest(R) tablets also adhere to the esophagus either because of thermal coagulation or because of the carbon dioxide bubbles produced from the reaction of the citric acid and sodium hydroxide present 17. Gastric injury may also occur.

Ocular burns

Alkali burns of the eye are very serious because they cause disruption of the protective permeability barriers and rapidly penetrate the cornea and anterior chamber. They combine with cell membrane lipids which causes disruption of the cells and stromal mucopolysaccharides with concomitant tissue softening. Sodium hydroxide can pass freely through the cornea and cause damage to all layers of the cornea and to the anterior segment structures in severe cases 18.

In the acute phase the following occurs: sloughing of the corneal epithelium, necrosis of the cells of the corneal stroma and endothelium, loss of corneal mucoid, edema of the corneal stroma and ciliary processes, ischemic necrosis and edema of the conjunctiva and limbal region of the sclera and infiltration of inflammatory cells into the cornea and iris. Corneal infiltration and degeneration occurs 1-3 weeks after injury 19.

Alkalis cause rapid loss of corneal mucoprotein. They also bind to corneal mucoprotein and collagen and the eye may remain alkaline despite prolonged irrigation due to slow dissociation of hydroxyl ions from corneal proteins. A large number of animal experiments, particularly on rabbits, have been conducted to study alkali injury to the eye and it is known from these experiments that in the rabbit eye the pH of the aqueous humor can rise to 10-11 within a few minutes or even higher in severe cases. The pH slowly falls over a period of hours, except in extreme cases 19.

Injury of the endothelium causes failure of the endothelial pump which normally keeps the cornea hydrated and clear. This failure causes the corneal stroma to become edematous and susceptible to vascularisation and scarring.

When the protective sheath around collagen is damaged, collagenases produced by polymorphonuclear leucocytes infiltrate the damaged area and degrade the corneal collagen causing melting or ulceration of the stroma, formation of descemoteceles (herniation of Descemet’s membrane) and perforation of the cornea. This phase is evident 3-7 days post-injury.

The role of injury to blood vessels remains unclear, as with other chemical burns to the eye the blood vessels of the conjunctiva and episclera are seen to be thrombosed immediately after exposure.

Both alkali and acid burns cause a transient rise in intraocular pressure due to shrinkage of the eye coats. A second phase of raised intraocular pressure may occur due to prostaglandin release and a still later phase with glaucoma due to obstruction of aqueous outflow caused by inflammation or synechiae.

In severely damaged untreated burns inflammatory destruction and ulceration continues to occur for weeks or months resulting in damage ranging from dense vascular invasion to opaque scarring and corneal perforation.

During the recovery process, surviving keratocytes begin to form new collagen but a decrease in available ascorbate (caused by injury to the main source in the ciliary body) is a limiting factor in this process. This lack of ascorbate may also render the cornea more susceptible to attack by oxygen free radicals.

sodium hydroxide dangers

Sodium hydroxide dangers

The major human health hazard (and the mode of action) of sodium hydroxide is local irritation and/or corrosion on skin and eye irritation/corrosion.

Human poisoning cases indicate that a dose of 10 grams orally is fatal 20. Sodium hydroxide is toxic by oral ingestion 20. Sodium hydroxide is corrosive to all tissues. Concentrated vapors lead to serious damage to the eyes and respiratory system. Oral ingestion of sodium hydroxide, which occurs frequently in children, causes severe tissue necrosis, with stricture formation of the esophagus, often resulting in death 20. Contact with the skin may result in contact dermatitis, hair loss, as well as necrosis due to severe irritation 20. Increased incidence of esophageal carcinoma after severe intoxication with sodium hydroxide has been reported in man 20. In animal studies, long-term dermal contact with substances leading to pH changes in the skin causes the development of tumors, as a result of severe tissue irritation and reparative cell growth 20. Mutagenic for mammalian somatic cells. May cause damage to the following organs: mucous membranes, upper respiratory tract, skin, eyes 20. Tumors are not to be expected if the effects of irritation are prevented. To date, there are no relevant studies of the prenatal toxic effects of sodium hydroxide 20.

Immediate first aid: Remove patient from contact with the material. Ensure that adequate decontamination has been carried out. If patient is not breathing, start artificial respiration, preferably with a demand valve resuscitator, bag-valve-mask device, or pocket mask, as trained. Perform CPR if necessary. Immediately flush contaminated eyes with gently flowing water. Do not induce vomiting. If vomiting occurs, lean patient forward or place on the left side (head-down position, if possible) to maintain an open airway and prevent aspiration. Keep patient quiet and maintain normal body temperature. Obtain medical attention.

  • If sodium hydroxide contacts the eyes, immediately wash (irrigate) the eyes with large amounts of water, occasionally lifting the lower and upper lids. Get medical attention immediately.
  • If sodium hydroxide contacts the skin, immediately flush the skin with large amounts of water. Get medical attention immediately. If this chemical (or liquids containing this chemical) contacts the skin, promptly wash the contaminated skin with soap and water. If this chemical or liquids containing this chemical penetrate the clothing, immediately remove the clothing and wash the skin with soap and water. If irritation persists after washing, get medical attention.
  • If a person breathes large amounts of this chemical, move the exposed person to fresh air at once. If breathing has stopped, perform artificial respiration. Keep the affected person warm and at rest. Get medical attention as soon as possible.
  • If this chemical has been swallowed, get medical attention immediately.

Sodium hydroxide ingestion

In studies using rabbits, instillation by oral intubation caused within 10 seconds: erosion into the stomach muscle with 12% solutions; perforation with 28% solutions; and no damage with 1% solutions. According to Schober et al. 21 between January 1976 and October 1988 a total number of 6 cases of ingestion of sodium hydroxide was reported by the Children Surgery Department (University of Graz, Austria). The University Hospital of Santiago de Compostela (Spain) reported about 67 cases of accidental ingestion of sodium hydroxide by children between 1981 and 1990 22. Most of the accidents occurred at home and the container was located within easy reach of the children. A nationwide survey of ingestion of corrosives has been performed for the period 1984-1988 in Denmark 23. It revealed 57 admissions to hospital of children (0-14 years) due to sodium hydroxide ingestion. The authors were confident that all children with serious complications after ingestion of corrosives were included in the study.

All previously mentioned publications reported accidental ingestion of sodium hydroxide by children. Wijburg et al. 24 reviewed the records of 170 patients admitted to the Department of Otolaryngology of the University Hospital of Amsterdam in the period January 1, 1971 to December 31, 1981 with suspected caustic ingestion. Of these 170 patients about 15 patients had ingested sodium hydroxide.

A 14 year old boy took a sodium hydroxide solution (30%) in to his mouth 25. He immediately spat it out. He drank some milk and water and vomited. On arrival about 30 minutes later he had retrosternal pain and had difficulty swallowing. He was given antibiotics and steroids. Esophagoscopy was performed two days later and revealed mucosal lesions in the upper esophagus. He began to improve and was able to take mashed food orally. He then began to develop difficulty in swallowing and a X-ray on day 23 revealed a stricture at the level of the carina of trachea. On the 38th day esophagoscopy with dilatation of the stricture was performed. About 2 hour later he suffered immediate retrosternal pain. An X-ray showed perforation of the stricture. This was sewn up via a left side thoracotomy. Serious inflammatory changes were observed with mediastinal emphysema and a purulent pleuritis. A nasogastric tube and three drains were left in place. On the 44th day after ingestion profuse bleeding was observed through the nasogastric tube and drains were noted. He became shocked and the decision was made to operate. He suffered a cardiac arrest while general anaesthetic was being given. A right side thoracotomy showed a 4-5 mm rupture of the descending part of the aorta with bleeding into the left pleura. After cardiac massage, blood transfusion and repair of the rupture he stabilized. Part of the esophagus was removed due to inflammation. On day 52 another hemorrhage occurred. He was operated on again and the hemorrhage was seen to arise from the aortic rupture. The aorta wall was fragile and could not be repaired. The patient died on the operating table. A purulent mediastinitis, bilateral purulent pleuritis, lung atalectasis and pericarditis were observed at postmortem 25.

A 16 month old female refused to drink and began drooling after ingesting the residue of a sodium hydroxide solution which the mother had been using for cleaning 25. She vomited several times with the vomitus containing a small amount of blood. The pharynx was red and there was slight bleeding of the upper gums. The chest was initially clear but 90 minutes after admission inspiratory and expiratory wheezes were present and a chest X-ray suggested aspiration pneumonia. At 15 hours post-ingestion laryngoscopy and esophagoscopy were performed. The false cords and epiglottis were found to be red and edematous. The cricopharyngeus was ulcerated and bleeding. The esophageal mucosa was bleeding and circumferential second and third degree burns were present. The child required intubation and ventilation and was started on methylprednisolone and ampicillin. Ventilatory support was necessary for three weeks. Subsequent laryngoscopy revealed laryngeal edema and burns which resulted in laryngeal stenosis. An esophagoscopy at five weeks post-ingestion revealed esophageal narrowing. A barium swallow showed multiple esophageal strictures and hypoperistalsis of the proximal segment of the esophagus. The child required nine esophageal dilatations, and was eventually able to take oral feedings. She was discharged one year after the ingestion 25.

9 cases of liquid sodium hydroxide ingestion which resulted in esophageal and gastric injury 26. One person who ingested 10 g sodium hydroxide in water suffered transmural necrosis of the esophagus and stomach and died 3 days after admission to the hospital.

200 patients with suspected caustic ingestation were examined 27. No steroids were administered to the patients involved. Lesions in the esophagus were found in 93 patients. Thirty-two patients with deep circular burns had nasogastric tubes inserted immediately. Of these patients, 2 developed esophageal strictures, but subsequent dilatation was successful. No stricture formation was observed in the group of patients with noncircular lesions. This low percentage of stricture formation is due to the use of nasogastric tubes. Since neither the presence nor the severity of esophageal burns is predictable, an endoscopy should be performed in all suspected cases. In the absence of severe pharyngeal lesions, the use of a flexible fiberoptic endoscope is preferable because it also allows examination of the stomach and proximal part of the duodenum 27.

An experimental study was conducted to investigate the effects of erythropoietin (EOP) on the acute phase of esophageal burn damage induced by sodium hydroxide. A standard esophageal alkaline burn was produced by the application of 10% sodium hydroxide to the distal esophagus in an in vivo rat model 28. Fifty-six female rats were allocated into three groups: Group uninjured and untreated (baseline control, n = 8) rats were uninjured and untreated, Group sodium hydroxide (positive control, n = 24) rats were injured but untreated and Group EPO (erythropoietin-treated, n = 24) rats were injured and given subcutaneous erythropoietin (1,000 IU/kg per day), 15 min, 24, and 48 hr after administration of the sodium hydroxide solution. Six animals from Group sodium hydroxide and six from Group erythropoietin-treated were killed at 4, 24, 48, and 72 hours after application of sodium hydroxide to the esophagus. All of animals in Group uninjured and untreated were killed 4 hour after exposure to 0.9% NaCl (sodium chloride or saline). Oxidative damage was assessed by measuring levels of malondialdehyde and nitric oxide (NO), and activities of superoxide dismutase and catalase in homogenized samples of esophageal tissue. Histologic damage to esophageal tissue was scored by a single pathologist blind to groups. Malondialdehyde levels in the uninjured and untreated and erythropoietin-treated groups were significantly lower than those in the sodium hydroxide but untreated group. Superoxide dismutase and catalase activities, and nitric oxide (NO) levels in the uninjured and untreated and erythropoietin-treated groups were significantly higher than in the sodium hydroxide but untreated group. Esophageal tissue damage measured at 4, 24, 48, and 72 hours after NaOH application was significantly less in the erythropoietin-treated group than in the sodium hydroxide but untreated group. When administered early after an esophageal burn induced by 10% sodium hydroxide in this rat model, erythropoietin significantly attenuated oxidative damage, as measured by biochemical markers and histologic scoring 28.

Skin

When sodium hydroxide (caustic soda) comes into contact with the skin it does not usually cause immediate pain, but it does start to cause immediate damage. It fails to coagulate protein which would serve to prevent further penetration. Thus, upon contact with eyes, washing with water must be started within 10 seconds and continued for at least 15 minutes to prevent permanent injury. Following contact with skin, washing with water must be started immediately to prevent corrosive chemical burns.

A human skin irritation test with 0.5 % sodium hydroxide was performed using exposure periods of 15, 30 and 60 min. The treatment sites were assessed 24, 48 and 72 hours after patch removal. The results showed that after a maximum exposure of 60 min, 61 % of the volunteers (20 of 33) showed a positive skin irritation reaction 29. Sodium hydroxide skin exposure causes redness, pain, serious skin burns and blisters. Sodium hydroxide liquid causes second or third degree burns after short contact. In studies using rabbits, application to the skin of a 5% solution caused severe necrosis after 4 hours. Solutions > 30% are highly corrosive to skin.

A 20 year old patient presented 2 hours after accidentally spraying herself in the face with an oven cleaner containing 4% sodium hydroxide 25. She had removed the excess liquid but did not irrigate the area. She did not experience any pain until nearly 2 hours later. On examination she was in moderate distress with no ocular involvement. The right side of her face was erythematous and blistering in a serpiginous pattern extending from the infraorbital rim to the body and angle of her mandible. The area of the right cheek had a bronze discoloration. The body surface area involved was about 2%. The area was irrigated for 60 minutes. Despite this the burn continued to show signs of third degree burn involvement. She was transferred to a burns unit and underwent surgical debridement and skin graft. Follow up six weeks later revealed good healing and no complications.

Eyes

A 31 year man had sodium hydroxide blown into his amblyopic left eye after an explosion caused by placing solid sodium hydroxide into a plugged drain 25. He washed the eye immediately in a shower and arrived at hospital within 5 minutes. On examination the cornea was opaque and the lower two thirds of the conjunctiva were ischemic. Topical irrigation was repeated and he was transferred to the operating room where intraocular irrigation was commenced. About 100-120 mL of Ringer’s solution was used in this procedure over 90 minutes. At this time the cornea was slightly clearer. Methylprednisolone was given by retrobulbar and subconjunctival injection. Continuous slow topical irrigation was continued for a further 24 hours. On the first post-operative day visual acuity was present to light, intraocular pressure was high and a cataract was present. Topical antibiotics, systemic and topical corticosteroids and carbonic anhydrase inhibitors were given. Two weeks after the injury aspiration-irrigation of the cataract was undertaken with an improvement in visual acuity. Acetylcysteine drops were used and a soft contact lens was put in place. He was discharged three weeks after the injury but returned three days later with severe pain, hypopyon and hyphema. The cornea ulcerated and perforated 27 days after the injury. The perforation was repaired with a corneoscleral free hand graft. Despite the presence of light perception the eye was enucleated at the patient’s request 70 days after the injury 25.

A 28-year old member of an oil-well drilling crew sustained extensive splash burns of the left eye from sodium hydroxide and received emergency care from a general physician prior to being hospitalized 30. At the hospital, initial examination showed vision limited to light perception, corneal clouding to such an extent that iris markings were not discernable, necrosis of most of the bulbar conjunctiva, some sloughing in the nasal area of the cornea, blanched and necrotic cul-de-sac, and some involvement of the lids and adjacent skin. The treatment of the patient at the hospital consisted of daily debridement of necrotic areas, local atropine, antibiotics, steroids, systematic ACTH, vitamins, antacids, and proteolytic enzymes. The treatment produced some improvement with time so that usual, late sequelae such as vascular invasion and symblepharon did not occur, and the cornea cleared sufficiently within 7 weeks that vision returned to near normal 30.

A total of 23 burns of the eye due to sodium hydroxide or potassium hydroxide were admitted to the eye clinic of the RWTH Aachen in Germany from 1985 to 1992 31. In 17 cases the accident happened during work, while 6 cases occurred at home using sodium hydroxide/potassium hydroxide as drain cleaner. The alkali burns were of special interest because of the rapid and deep penetration of alkali into the ocular tissues.

From January 1984 to June 1991 a total number of 24 patients were treated for sodium hydroxide related eye injury in the Department of Ophthalmology, Postgraduate Institute of Medical Education and Research, Chandigarh, India. Over half of the patients which had ocular chemical burns were young people working in laboratories and factories.

Inhalation

For production and major uses of sodium hydroxide aerosols do normally not occur. However, for certain specific uses, e.g. cleaning ovens and disinfection of sheds, the formation of aerosols can not be excluded completely. For example the cleaning of ovens could result in an irritation of the throat due to the presence of sodium hydroxide in the air. However, it should be realized that aerosols of sodium hydroxide are not stable. They are rapidly transformed due to an uptake of carbon dioxide from the atmosphere resulting in the formation of sodium bicarbonate and sodium carbonate. The transformation of respirable sodium hydroxide aerosols into sodium carbonate aerosols can occur in seconds 32. Analytical measurements, to determine the inhalation exposure of workers during production and use, seem to be unavailable. However, in animal studies, inhalation of the aerosol can cause pulmonary edema.

The inhalation of aerosols of 5 % sodium hydroxide by a 25-year-old women resulted in irreversible obstructive lung injury after working for one day in a poorly ventilated room 26.

Sodium hydroxide toxicokinetics, metabolism and distribution

Sodium is a normal constituent of your blood and an excess is excreted in your urine. A significant amount of sodium is taken up via the food because the normal uptake of sodium via food is 3.1-6.0g per day. Exposure to sodium hydroxide could potentially increase the pH of the blood. However, the pH of the blood is regulated between narrow ranges to maintain homeostasis. Via urinary excretion of bicarbonate and via exhalation of carbon dioxide the pH is maintained at the normal pH of 7.4-7.5.

When humans are dermally (skin) exposed to low (non-irritating) concentrations, the uptake of sodium hydroxide should be relatively low due to the low absorption of ions. For this reason the uptake of sodium hydroxide is expected to be limited under normal handling and use conditions. Under these conditions the uptake of hydroxyl (OH) ion, via exposure to sodium hydroxide, is not expected to change the pH in the blood. Furthermore the uptake of sodium, via exposure to sodium hydroxide, is much less than the uptake of sodium via food under these conditions. For this reason sodium hydroxide is not expected to be systemically available in the body under normal handling and use conditions.

An example will be given for an inhalation exposure scenario. Assume an exposure to an sodium hydroxide concentration of 2 mg/m³, which is the threshold limit value (TLV) in the USA, and a respiratory volume of 10 m3 per day. In this case the daily exposure is 20 mg sodium hydroxide. The threshold limit value (TLV) of a chemical substance is believed to be a level to which a worker can be exposed day after day for a working lifetime without adverse effects.

The amount of 20 mg sodium hydroxide is equivalent with 11.5 mg sodium which is a negligible amount compared to the daily dietary exposure of 3.1-6.0 g. The amount of 20 mg sodium hydroxide is equivalent with 0.5 mmole and if this amount would be taken up in the blood stream it would result in a concentration of 0.1 mM hydroxyl (OH) ion (assuming 5 liter blood per human). This is a negligible amount when it is compared with the bicarbonate concentration of 24 mM of blood. This example confirms that sodium hydroxide is not expected to be systemically available in the body under normal handling and use conditions.

References
  1. Commission Regulation (EU) No 1129/2011 of 11 November 2011 amending Annex II to Regulation (EC) No 1333/2008 of the European Parliament and of the Council by establishing a Union list of food additives. OJ L 295, 12.11.2011, p. 178.
  2. Commission Regulation (EU) No 1130/2011 amending Annex III to Regulation (EC) No 1333/2008 of the European Parliament and of the Council on food additives by establishing a Union list of food additives approved for use in food additives, food enzymes, food flavourings and nutrients.
  3. Joint FAO/WHO Expert Committee On Food Additives (JECFA), 1966. Specifications for the identity and purity of food additives and their toxicological evaluation: some antimicrobials, antioxidants, emulsifiers, stabilisers, flour-treatment agents, acids, and bases. Ninth Report of the Joint FAO/WHO Expert Committee On Food Additives. Rome, 13–20 December 1966.
  4. EC (European Commission), 1991, online. Opinion of the Scientific Committee for Food: First Series of Food Additives of Various Technological Functions. https://ec.europa.eu/info/departments/health-and-food-safety_en
  5. CMAI (2000), Fifteenth Annual World Petrochemical Conference, March 29 & 30, 2000, Houston, Texas, USA
  6. Keskin E et al. (1991), Eur J Pediatr Surg, 1, 335-338
  7. Sodium hydroxide. http://www.inchem.org/documents/sids/sids/NAHYDROX.pdf
  8. Hoffman RS, Howland MA, Kamerow HN and Goldfrank LR. 1989. Comparison of titratable acid/alkaline reserve and pH in potentially caustic household products. Clin Toxicol 27 (4&5):24261
  9. Gaudreault P, Parent M, McGuigan MA, Chicoine L and Lovejoy FH. 1983. Predicability of eosophageal injury from signs and symptoms: a study of caustic ingestions in 378 children. Pediatrics 71 (5):767-770
  10. Crain EE, Gershel JC and Mezey AP. 1984. Caustic ingestions. Symptoms as predictors of esophageal injury. Am J Dis Child 138:863-865
  11. Nuutinen M, Uhari M, Karvali T and Kouvalainen K. 1994. Consequences of caustic ingestions in children. Acta Paediatr 83:1200-1205
  12. Clausen JO, Nielsen TLF and Fogh A. 1994. Admission to Danish hospitals after suspected ingestion of corrosives. A nationwide survey (1984-1988) comprising children aged 0-14 years. Dan Med Bull 41:234-237
  13. Christesen HBT. 1995. Prediction of complications following unintentional caustic ingestion in children. Is endoscopy always necessary? Acta Paediatr 84:1177-1182
  14. Knopp R. 1979. Caustic ingestions. JACEP 8:329-336
  15. Mallory A and Schaefer JW. 1977. Clinitest ingestion. Br Med J 2:105-107
  16. Adam JS and Birck HG. 1982. Pediatric caustic ingestion. Ann Otol Rhinol Laryngol 91:656-658
  17. Burrington JD. 1975. Clinitest burns of the esophagus. Ann Thorac Surg 20 (4):400-404
  18. Wright P. 1982. The chemically injured eye. Trans Ophthal Soc UK 102:85-87
  19. Grant WM and Schuman JS. 1993. Toxicology of the eye 4th ed. Charles C Thomas, Springfield Illinois
  20. Sodium hydroxide. https://pubchem.ncbi.nlm.nih.gov/compound/14798
  21. Schober PH et al. (1989), Wiener Klin Wschr, 101, 318-322
  22. Casasnovas et al. (1997), Eur J Pediatr, 156, 410-414
  23. Clausen JO et al. (1994), Danish Medicinal Bulletin 41, 234-237
  24. Wijburg FA et al. (1985), Ann Otol Rhinol Laryngol, 94, 337-341
  25. IPCS; UK Poisons Information Document: Sodium Hydroxide (1310-73-2). Available from, as of October 5, 2011: http://www.inchem.org/documents/ukpids/ukpids/ukpid26.htm
  26. Organization for Economic Cooperation and Development; Screening Information Data Set for Sodium Hydroxide, (1310-73-2) p.13 (March 2002). Available from, as of October 4, 2011: http://www.inchem.org/pages/sids.html
  27. Wijburg FA et al; Ann Otol Rhinol Laryngol 94 (4 Part 1): 337-41; 1985. https://www.ncbi.nlm.nih.gov/pubmed/4026118
  28. The protective effect of erythropoietin on the acute phase of corrosive esophageal burns in a rat model. Pediatr Surg Int. 2010 Feb;26(2):195-201. doi: 10.1007/s00383-009-2480-1. Epub 2009 Sep 16. https://www.ncbi.nlm.nih.gov/pubmed/19760200
  29. Organization for Economic Cooperation and Development; Screening Information Data Set for Sodium Hydroxide, (1310-73-2) p.14, March 2002
  30. Horowitz ID; Am J Ophthalmol 61: 340-341 (1966) as cited in NIOSH; Criteria Document: Sodium Hydroxide p.29 (1975) DHEW Pub. NIOSH 76-105
  31. Kuckelkorn et al. (1993), Klin Monatsbl Augenheilkd, 203, 397-402
  32. Cooper et al. (1979), American Industrial Hygiene Association Journal, 40, 365-371
read more
Food Additives

Trisodium phosphate

trisodium phosphate

What is trisodium phosphate

Trisodium phosphate Na3PO4 (trisodium orthophosphate or trisodium monophosphate or food additive E 339ii) is presently used in the USA to kill or reduce the number of bacteria, such as salmonella or campylobacter on poultry 1. Trisodium phosphate is a permitted food additive in Europe identified as E 339ii and authorized in several processed foods, including meat products 2. In the USA, sodium phosphates (mono-, di-, and tri-) are considered GRAS (generally recognized as safe) by the US Food and Drug Administration (FDA) as multipurpose ingredients in food (21 CFR 182.1778). This GRAS status recognition was issued through experience based on common use in food and considering that the substance was used in food prior to January 1, 1958 and has been approved by the US Department of Agriculture-Food Safety and Inspection Service at levels of 8–12% with a high pH value (pH 12) as an antimicrobial agent on raw chilled poultry carcasses that have been passed for wholesomeness. Poultry carcasses are either sprayed with or dipped in the trisodium phosphate solution for up to 15 seconds at a solution temperature of 13–17°C 3. Trisodium phosphate exerts a destructive effect on pathogens and a “detergent effect” that allows the removal of bacteria by the washing process 4. The mechanism of action of trisodium phosphate is based on its high alkalinity in solution (pH 12.1) that can disrupt cell membranes and remove fat films causing the cell to leak intracellular fluid. It can also act as a surfactant contributing to elimination of bacteria not yet strongly adhered to the surface of poultry skin 5. The lowest effective trisodium phosphate concentration for microbial control is 8%.

The mechanisms of the trisodium phosphate mode of action include:

  1. Surfactant properties,
  2. Destruction due to high pH (pH 12.1),
  3. Removal of loosely associated bacteria from the skin,
  4. Removal of carcass surface fat, invariably resulting in removal of bacteria attached to the fat, and
  5. Destruction of the bacterial cell wall 6.
  6. It is hypothesized that the increased wetting ability of hot water and trisodium phosphate physically remove bacteria in addition to killing them.

Trisodium phosphate is ionized in water generating Na+ and PO43- ions. These ions can be absorbed into the carcass but no further reactions are likely. The poultry carcass can be affected when exposed to the high alkalinity of the solutions. For instance, the action of endogenous poultry muscle enzymes or the water retention capacity could be altered during the post-treatment period of time. However, a study on broiler products reported no detectable effects of treatment on taste, texture or appearance 7. There would be no possibility of the formation of semicarbazide after treatment with trisodium phosphate.

Figure 1. Trisodium phosphate

trisodium phosphate

The rapid dissociation of trisodium phosphate into its constituent ions and the relatively low chemical reactivity of Na+ and PO43- ions makes it very unlikely that significant levels of by-products would be produced after treatment of poultry carcasses 8.

At this moment, there is no indication that the use of a trisodium phosphate could support the spread of resistance to therapeutic antimicrobials by direct selection, although it may be possible by indirect selection. Despite a long history of use, there are currently no published data to conclude that the application of trisodium phosphate to remove microbial contamination of poultry carcasses at the proposed conditions of use will lead to the occurrence of acquired reduced susceptibility to these substances 9. Similarly, there are currently no published data to conclude that the application of trisodium phosphate to remove microbial contamination of poultry carcasses at the proposed conditions of use will lead to resistance to therapeutic antimicrobials 9.

What is trisodium phosphate used for?

Trisodium phosphate is typically used in poultry processing in the United States either as sprays or washes for on-line reprocessing, or added to the chiller water (chiller bath applications) to limit the potential for microbial cross-contamination. Treatment of poultry carcasses with trisodium phosphate was effective in reducing populations of food-borne pathogens including Salmonella, Campylobacter, Escherichia coli O157:H7, Listeria, Staphylococcus aureus as well as spoilage bacteria including Pseudomonas and Lactobacillus 10.

Trisodium phosphate, has been approved by regulatory agencies in the United States for use in poultry process water within a concentration range of 8 to 12%. The trisodium phosphate solution must be maintained at a temperature of 7.2 to 12.8 °C and applied by spraying or dipping carcasses for up to 15 seconds (9 CFR 424.21(c) and FDA regulation 21 CFR 182.1778). Since 1994, interim approval has been granted to use trisodium phosphate as a processing aid for the purpose of
reducing microorganisms when: (1) applied as a spray or dip to raw, unchilled carcasses for up to 15 seconds in an 8 to 12 % solution of trisodium phosphate maintained within a temperature range of 18.3 to 29.4 °C; and (2) applied as a spray or dip to raw, unchilled poultry giblets for up to 30 seconds with an 8 to 12% solution of trisodium phosphate, until rule making approving its use can be finalized. Carcass exposure time is controlled by line speed and length of the application cabinet. A typical application is approximately 15 seconds at full line speed. If the line is stopped for more than 5 minutes, carcasses in the application cabinet are segregated and condemned.

According to previous estimations by the Scientific Committee on Veterinary Measures relating to Public Health 11, the treatment of poultry carcasses with trisodium phosphate would incorporate 480 mg trisodium phosphate per kg carcass. Based on meat consumption data in European adults, potential daily exposure to trisodium phosphate for a 60 kg individual would be up to 1.21 mg/kg body weight at the mean and up to 2.08 and 2.80 mg/kg body weight at the 95th and 99th percentile of meat consumption, respectively.

A maximum tolerable daily intake of 70 mg/kg body weight for phosphates was established by the Joint Food and Agriculture Organization of the United Nations (FAO)/World Health Organization (WHO) Expert Committee on Food Additives (JECFA) 12. The Scientific Committee on Food 13 confirmed the maximum tolerable daily intake value of 70 mg/kg body weight estimated by the Joint Food and Agriculture Organization of the United Nations (FAO)/World Health Organization (WHO) Expert Committee on Food Additives (JECFA) for phosphates used as food additives. Both evaluations concluded that the main risk related to the ingestion of these additives was their potential effect on the calcium-phosphorus-magnesium balance of the body 8.

Based on meat consumption data in European adults, as an estimate of poultry consumption, potential dietary exposure to trisodium phosphate for a 60 kg individual would be up to 1.2 mg/kg body weight per day at the mean, reaching up to 2.1 and 2.8 mg/kg body weight at the 95th and 99th percentiles of meat consumption, respectively 8.

Treated poultry carcasses are only consumed after processing (cooking, frying, etc) and final concentrations of phosphate residues to which the consumer would actually be exposed are likely less than what has been estimated above. Dietary exposures would thus only be a fraction of maximum tolerable daily intake value (up to 4 %, 99th percentiles) and the European Food Safety Authority Panel considers that this exposure is of no safety concern 8.

On the basis of the available data, the European Food Safety Authority Panel considers that treatment of poultry carcasses with trisodium phosphate as described is of no safety concern 8. The European Food Safety Authority Panel considers that the rapid dissociation of trisodium phosphate into its constituent ions (Na+ and PO43- ions) and their relatively low chemical reactivity make it very unlikely that by-products of toxicological relevance are formed after this treatment. There is no possibility of formation of semicarbazide from the use of trisodium phosphate 8.

The European Food Safety Authority Panel notes that the initial health concerns about semicarbazide are no longer relevant 8. As set out in the European Food Safety Authority opinion on semicarbazide 14, new data showed that semicarbazide is not genotoxic in vivo.

Phosphorus

Phosphorus is most commonly found in nature in its pentavalent form in combination with oxygen, as phosphate (PO43-). Phosphorus (as phosphate) is an essential constituent of all known protoplasm and its content is quite uniform across most plant and animal tissues. Except for specialized cells with high ribonucleic acid content, and for nervous tissue with high myelin content, tissue phosphorus occurs at concentrations ranging approximately from 0.25 to 0.65 mmol (7.8 to 20.1 mg)/g protein 15. A practical consequence is that, as organisms consume other organisms lower in the food chain (whether animal or plant), they automatically obtain their phosphorus.

Phosphorus is a mineral that makes up 1% of a person’s total body weight. Phosphorus is the second most abundant mineral in your body. Phosphorus is present in every cell of your body. Most of the phosphorus in the body is found in the bones and teeth. Eighty-five percent of adult body phosphorus is in bone. The remaining 15 percent is distributed through the soft tissues 16.

Phosphorus makes up about 0.5 percent of the newborn infant body 17 and from 0.65 to 1.1 percent of the adult body 18. Total phosphorus concentration in whole blood is 13 mmol/liter (40 mg/dl), most of which is in the phospholipids of red blood cells and plasma lipoproteins. Approximately 1 mmol/liter (3.1 mg/dl) is present as inorganic phosphate (Pi). This inorganic phosphate component, while a tiny fraction of body phosphorus (< 0.1 percent), is of critical importance. In adults this component makes up about 15 mmol (465 mg) and is located mainly in the blood and extracellular fluid. It is into this inorganic phosphate compartment that phosphate is inserted upon absorption from the diet and resorption from bone and from this compartment that most urinary phosphorus and hydroxyapatite mineral phosphorus are derived. This compartment is also the primary source from which the cells of all tissues derive both structural and high-energy phosphate.

  • The main function of phosphorus is in the formation of bones and teeth.
  • Phosphorus plays an important role in how your body uses carbohydrates and fats. Phosphorus is also needed for the body to make protein for the growth, maintenance, and repair of cells and tissues. Phosphorus also helps the body make ATP, a molecule the body uses to store energy.

Structurally, phosphorus occurs as phospholipids, which are a major component of most biological membranes, and as nucleotides and nucleic acids. The functional roles include: (1) the buffering of acid or alkali excesses, hence helping to maintain normal pH; (2) the temporary storage and transfer of the energy derived from metabolic fuels; and (3) by phosphorylation, the activation of many catalytic proteins. Since phosphate is not irreversibly consumed in these processes and can be recycled indefinitely, the actual function of dietary phosphorus is first to support tissue growth (either during individual development or through pregnancy and lactation) and, second, to replace excretory and dermal losses. In both processes it is necessary to maintain a normal level of Pi in the extracellular fluid (ECF), which would otherwise be depleted of its phosphorus by growth and excretion.

Phosphorus works with the B vitamins. It also helps with the following:

  • Kidney function
  • Muscle contractions
  • Normal heartbeat
  • Nerve signaling

According to Institute of Medicine recommendations, the recommended dietary intakes of phosphorus are as follows:

  • 0 to 6 months: 100 milligrams per day (mg/day)*
  • 7 to 12 months: 275 mg/day*
  • 1 to 3 years: 460 mg/day
  • 4 to 8 years: 500 mg/day
  • 9 to 18 years: 1,250 mg
  • Adults: 700 mg/day

Pregnant or lactating women:

  • Younger than 18: 1,250 mg/day
  • Older than 18: 700 mg/day

*AI or Adequate Intake

Table 1. Usual mean daily phosphorus intake and dietary recommended intake for phosphorus by gender and age

Dietary recommended intake


AgeUsual phosphorus intakeEARULRDA
yearsmg/daymg/day
Men
 1–31030 ± 26.33803000460
 4–81145 ± 27.44053000500
 9–131321 ± 35.4105540001250
 14–181681 ± 61.5105540001250
 19–301656 ± 53.45804000700
 31–501727 ± 25.05804000700
 51–701492 ± 30.05804000700
 ≥711270 ± 27.65803000700
Women
 1–31030 ± 26.33803000460
 4–81145 ± 27.44053000500
 9–131176 ± 57.5105540001250
 14–181067 ± 29.8105540001250
 19–301120 ± 40.85804000700
 31–501197 ± 25.05804000700
 51–701106 ± 34.05804000700
 ≥71985 ± 28.85803000700

Footnotes: Usual daily phosphorus intake data from What We Eat in America, NHANES 2005–2006 (unpublished data from Alanna Moshfegh, U.S. Department of Agriculture) are expressed as means. The dietary recommended intake levels for phosphorus were established by the Institute of Medicine, Food, and Nutrition Board in 1997 19.

  • Recommended Dietary Allowance (RDA): Average daily level of intake sufficient to meet the nutrient requirements of nearly all (97%–98%) healthy individuals; often used to plan nutritionally adequate diets for individuals.
  • Adequate Intake (AI): Intake at this level is assumed to ensure nutritional adequacy; established when evidence is insufficient to develop an RDA.
  • Estimated Average Requirement (EAR): Average daily level of intake estimated to meet the requirements of 50% of healthy individuals; usually used to assess the nutrient intakes of groups of people and to plan nutritionally adequate diets for them; can also be used to assess the nutrient intakes of individuals.
  • Tolerable Upper Intake Level (UL): Maximum daily intake unlikely to cause adverse health effects.
[Source 20]

Regulation of the Serum Inorganic Phosphate Concentration

Inorganic phosphate (Pi) levels are only loosely regulated. Normal inorganic phosphate (Pi) levels decline with age from infancy to maturity (Table 2). The most likely reason for the higher inorganic phosphate (Pi) in newborn infants than in older children and adults is the lower glomerular filtration rate (GFR) of infants. GFR is about 32 ml/min/1.73 m2 at about 1 week of age, and rises to 87 at 4 to 6 months 21. In the first months of life, plasma inorganic phosphate (Pi) concentration appears to be a reflection both of renal glomerular maturity and of the amount of dietary intake. Mean serum inorganic phosphate (Pi) appears to decline by about 0.3 mmol/liter (0.9 mg/ dl) across the second half of the first year of life 22. Human milk-fed, compared with formula-fed, infants have a slightly lower plasma inorganic phosphate (Pi) (2.07 versus 2.25 mmol/liter or 6.4 versus 7.0 mg/dl) which is simply a function of differences in intake 22; Caucasian compared with African American infants have a slightly higher plasma Pi irrespective of type of milk feeding 22.

Table 2. Normative Values for Serum Inorganic Phosphorus (mmol/liter) for Age

Age (y)Mean2.5 Percentile97.5 Percentile
0–0.52.151.882.42
21.811.432.20
41.771.382.15
61.721.332.11
81.671.292.06
101.631.242.01
121.581.191.97
141.531.151.92
161.491.101.88
201.391.011.78
Adult1.150.871.41
[Source 15]

The general relationship between absorbed phosphorus intake and plasma inorganic phosphate (Pi) in adults is shown in Figure 2. The relationship shown in Figure 4 holds only in adult individuals with adequate renal function; that is, the slow rise of plasma inorganic phosphate (Pi) with rising phosphorus intake over most of the intake range applies only so long as excess absorbed phosphate can be spilled into the urine. However, in individuals with reduced renal function, phosphorus clearance remains essentially normal so long as GFR is at least 20 percent of mean adult normal values, largely because tubular reabsorption is reduced to match the reduction in filtered load. Below that level, excretion of absorbed phosphate requires higher and higher levels of plasma inorganic phosphate (Pi) to maintain a filtered load at least equal to the absorbed load. This is the reason for the hyperphosphatemia typically found in patients with end-stage renal disease.

Figure 2. Relation of serum inorganic phosphate (Pi) to absorbed intake in adults with normal renal function

Relation of serum inorganic phosphate to absorbed intake in adults with normal renal function

Phosphorus Food Sources

Phosphates are found in foods as naturally occurring components of biological molecules and as food additives in the form of various phosphate salts. These salts are used in processed foods for nonnutrient functions, such as moisture retention, smoothness, and binding.

Phosphates occur naturally in the form of organic esters in many kinds of food, the main food sources are the protein food groups of meat and milk. A diet that includes the right amounts of calcium and protein will also provide enough phosphorus. Whole-grain breads and cereals contain more phosphorus than cereals and breads made from refined flour. However, the phosphorus is stored in a form that is not absorbed by humans. These phosphate esters are organically bound and only partially absorbed in the gastrointestinal tract. Fruits and vegetables contain only small amounts of phosphorus. Phosphates are important for human health since they are responsible for growth, maintenance and repair of tissues and cells of living organisms.

In infants, dietary intake of phosphorus spans a wide range, depending on whether the food is human milk, cow milk, adapted cow milk formula, or soy formula (see Table 4). Moreover, the phosphorus concentration of human milk declines with progressing lactation, especially between 4 and 25 weeks of lactation 23. By contrast, more of the variation in dietary intake of phosphorus in adults is due to differences in total food intake and less to differences in food composition. Phosphorus contents of adult diets average about 62 mg (2 mmol)/100 kcal in both sexes 24, and phosphorus:energy ratios exhibit a coefficient of variation of only about one-third that of total phosphorus intake. Nevertheless, individuals with high dairy product intakes will have diets with higher phosphorus density values, since the phosphorus density of cow milk is higher than that of most other foods in a typical diet. The same is true for diets high in colas and a few other soft drinks that use phosphoric acid as the acidulant. A 12-ounce serving of such beverages contains about 50 mg (< 2 mmol), which is only 5 percent of the typical intake of an adult woman. However, when consumed in a quantity of five or more servings per day, such beverages may contribute substantially to total phosphorus intake.

Table 3. Contribution of food categories to phosphorus intake and examples of phosphorus containing generally recognized as safe ingredients frequently used in processing foods in each category

Food Category% Contribution to Phosphorus IntakeExamples of Phosphorus Ingredients Used in Processing Foods in Each Category2
Milk and dairy20.9Phosphoric acid, sodium phosphate, calcium phosphate, potassium tripolyphosphate
Mixed dishes: grain-based10.1Modified food starch, sodium acid pyrophosphate, disodium phosphate
Breads, rolls, and tortillas5.8Sodium aluminum phosphate, mono-calcium phosphate, sodium acid pyrophosphate
Quick breads, bread products, sweet bakery products5.2Sodium acid pyrophosphate, sodium aluminum phosphate, mono-calcium phosphate, dicalcium phosphate, calcium acid pyrophosphate
Poultry5.1Sodium tripolyphosphate, sodium tripoly/sodium hexa-meta-phosphate blends, sodium acid pyrophosphate, tetrasodium pyrophosphate
Pizza4.8Disodium phosphate, tricalcium phosphate, tetrasodium pyrophosphate, sodium acid pyrophosphate
Vegetables4.8Mono-calcium phosphate, sodium phosphate, disodium phosphate, sodium acid pyrophosphate, disodium hydrogen pyrophosphate
Mixed dishes: meat, poultry, seafood4.5Sodium tripolyphosphate, sodium acid pyrophosphate, tricalcium phosphate, trisodium phosphate
Cured meats and poultry4.4Sodium tripolyphosphate, tetrasodium pyrophosphate, sodium acid pyrophosphate
Meats4.2Potassium tripolyphosphate, tetrapotassium pyrophosphate, sodium hexa-meta-phosphate
Plant-based protein foods3.7Sodium hexa-meta-phosphate, sodium tripolyphosphate
Cereals3.2Disodium phosphate, tricalcium phosphate, trisodium phosphate
Eggs2.8Sodium hexa-meta-phosphate, tetrasodium pyrophosphate, mono-sodium phosphate
Seafood2.5Sodium acid pyrophosphate, potassium tripolyphosphate, tetrapotassium pyrophosphate, sodium tripolyphosphate
All other food categories18
 Savory snacks, crackers, snack/meal bars<2.5Calcium phosphate, sodium hexa-meta-phosphate, tricalcium phosphate
 Other desserts<2.5Calcium phosphate, modified corn starch, disodium phosphate, tetrasodium pyrophosphate
 Candy (chocolate)<2.5Lecithin
 Sugar sweetened/diet beverages/alcoholic beverages<2.5Phosphoric acid
 100% juice<2.5Calcium phosphate
 Fruits<2.5Mono-calcium phosphate
 Soups<2.5Mono-potassium phosphate
 Cooked grains<2.5Disodium phosphate, tricalcium phosphate
 Condiments/sauces<2.5Phosphoric acid, disodium phosphate, modified food starch, sodium hexa-mono-phosphate
 Fats and oils<2.5None found

Footnotes:

Unpublished data source: Alanna Moshfegh, U.S. Department of Agriculture, What We Eat in America, NHANES 2009–2010. The U.S. Food and Drug Administration considers the phosphate-containing ingredients shown in this table to be generally recognized as safe under conditions of their intended use in foods.

All of these phosphorus-containing ingredients were granted generally recognized as safe status between 1975 and 1980. Data source: Ingredients labels on products of processed foods currently in the marketplace.

[Source 20]

Table 4. Average Phosphorus Content and Calcium:Phosphorus Molar Ratio of Various Infant Feedings

Feeding TypeP (mmol/liter)Ca:P Molar Ratio
Human milka
 1 week5.1 ± 0.91.3:1
 4 weeks4.8 ± 0.81.4:1
 16 weeks3.9 ± 0.51.5:1
Cows’ milk formula121.0:1
Soy formulab151.2:1
Whole cows’ milk301.0:1

Footnotes:

a: Milk phosphorus at three different weeks of lactation 25.
b: Phosphorus content of soy formula includes about 3 mmol/L, present as phytate phosphorus which is likely not to be bioavailable 26.
[Source 15]

Food phosphorus is a mixture of inorganic and organic forms (see Figure 3). Intestinal phosphatases hydrolyze the organic forms contained in ingested protoplasm, and thus most phosphorus absorption occurs as inorganic phosphate. On a mixed diet, net absorption of total phosphorus in various reports ranges from 55 to 70 percent in adults 27 and from 65 to 90 percent in infants and children 28. There is no evidence that this absorption efficiency varies with dietary intake. In the data from both Stanbury 29 and Lemann 30, the intercept of the regression of adult fecal phosphorus on dietary phosphorus is not significantly different from zero, and the relationship is linear out to intakes of at least 3.1 g (100 mmol)/day. This means that there is no apparent adaptive mechanism that improves phosphorus absorption at low intakes. This is in sharp contrast to calcium, for which absorption efficiency increases as dietary intake decreases 31 and for which adaptive mechanisms exist that improve absorption still further at habitual low intakes 32.

A portion of phosphorus absorption is by way of a saturable, active transport facilitated by 1,25-dihydroxyvitamin D (1,25(OH)2D) 33. However, the fact that fractional phosphorus absorption is virtually constant across a broad range of intakes suggests that the bulk of phosphorus absorption occurs by passive, concentration-dependent processes. Also, even in the face of dangerous hyperphosphatemia (high blood phosphate), phosphorus continues to be absorbed from the diet at an efficiency only slightly lower than normal 34.

Phosphorus absorption is reduced by ingestion of aluminum-containing antacids and by pharmacologic doses of calcium carbonate. There is, however, no significant interference with phosphorus absorption by calcium at intakes within the typical adult range.

Excretion of endogenous phosphorus is mainly through the kidneys. Inorganic serum phosphate is filtered at the glomerulus and reabsorbed in the proximal tubule. The transport capacity of the proximal tubule for phosphorus is limited; it cannot exceed a certain number of mmol per unit time. This limit is called the tubular maximum for phosphate (TmP). Tubular maximum for phosphate (TmP) varies inversely with parathyroid hormone (PTH) concentration; parathyroid hormone (PTH) thereby adjusts renal clearance of inorganic phosphate (Pi). At filtered loads less than the tubular maximum for phosphate (TmP) (for example, at low plasma inorganic phosphate (Pi) values), most or all of the filtered load is reabsorbed, and thus plasma phosphate levels can be at least partially maintained. By contrast, at filtered loads above the tubular maximum for phosphate (TmP), urinary phosphorus is a linear function of plasma phosphate 30. In a healthy adult, urine phosphorus is essentially equal to absorbed diet phosphorus, less small amounts of phosphorus lost in shed cells of skin and intestinal mucosa.

This regulation of phosphorus excretion is apparent from early infancy. In infants, as in adults, the major site of regulation of phosphorus retention is at the kidney. In studies of infants receiving different calcium intakes 35, phosphorus retention did not differ even with high amounts of dietary calcium (calcium:phosphorus [Ca:P] molar ratios of 0:6, 1:1, or 1.4:1). Any reduction in absorption of phosphorus due to high amounts of dietary calcium were compensated for by parallel reductions in renal phosphorus excretion 35. The least renal excretory work to maintain normal phosphorus homeostasis would be achieved with human milk as the major source of minerals during the first year of life.

Figure 3. Two types of phosphorus in food supply, natural (organic forms) and added (inorganic forms)

phosphorus types in foods

[Source 20]

What happens with too much phosphorus / phosphate intake?

As shown in Figure 2, serum inorganic phosphate (Pi) rises as total phosphorus intake increases. Excess phosphorus intake from any source is expressed as hyperphosphatemia, and essentially all the adverse effects of phosphorus excess are due to the elevated in inorganic phosphate (Pi) the ECF (extracellular fluid).

The principal effects that have been attributed to hyperphosphatemia are:

  1. Adjustments in the hormonal control system regulating the calcium economy,
  2. Ectopic (metastatic) calcification, particularly of the kidney,
  3. In some animal models, increased porosity of the skeleton, and
  4. A suggestion that high phosphorus intakes could reduce calcium absorption by complexing calcium in the chyme.

Concern about high phosphorus intake has been raised in recent years because of a probable population-level increase in phosphorus intake through such sources as cola beverages and food phosphate additives 15.

The phosphorus content of the U.S. food supply continues to increase as food manufacturers find new and effective ways to improve taste, speed of preparation, shelf life, or convenience of products through the addition of phosphate ingredients. This growing use of phosphate additives is captured in the nutrient database as foods are reanalyzed for their nutrient composition. An example of such a product can be seen in Figure 4, where the ingredients list shows 3 phosphate additives used to process fast food fries (modified food starch, sodium acid pyrophosphate, and disodium dihydrogen pyrophosphate). The growth in availability and intake of convenience and fast foods is contributing to the changing phosphorus content of the U.S. food supply and to increased intake of phosphorus by those individuals consuming more of these foods, essentially without their knowledge or understanding. For example, few consumers would consider french fries to be a source of phosphorus additives.

Figure 4. Food ingredients list showing 3 phosphate additives

Food ingredients list showing 3 phosphate additives

Footnotes: The phosphorus content of the U.S. food supply continues to increase as food manufacturers find new and effective ways to improve taste, speed of preparation, shelf life, or convenience of products through the addition of phosphate ingredients. This growing use of phosphate additives is captured in the nutrient database as foods are reanalyzed for their nutrient composition. An example of such a product can be seen in Figure 1, where the ingredients list shows 3 phosphate additives used to process fast food fries (modified food starch, sodium acid pyrophosphate, and disodium dihydrogen pyrophosphate). The growth in availability and intake of convenience and fast foods is contributing to the changing phosphorus content of the U.S. food supply and to increased intake of phosphorus by those individuals consuming more of these foods, essentially without their knowledge or understanding. For example, few consumers would consider french fries to be a source of phosphorus additives.

[Source 20]

It has been reported that high intakes of polyphosphates, such as are found in food additives, can interfere with absorption of iron, copper, and zinc36; however, described effects are small, and have not been consistent across studies 37. For this reason, as well as because trace mineral status may be low for many reasons, it was not considered feasible to use trace mineral status as an indicator of excess phosphorus intake. Nevertheless, given the trend toward increased use of phosphate additives in a variety of food products 38, it would be well to be alert to the possibility of some interference in individuals with marginal trace mineral status.

Unbalanced Phosphorus Intake Relative to Calcium Intake Affects Health

The typical dietary pattern of many Americans is high in phosphorus relative to calcium intake, and it is well established that the physiologic reaction to excess phosphorus intake is significantly influenced by its balance with calcium. Animal studies have shown that high dietary phosphorus relative to calcium can induce secondary hyperparathyroidism, bone resorption, lower peak bone mass, and fragile bones in young and old animals 39. Dietary guidelines recommend relative intakes of these minerals at 1:1 molar intake ratios or 1.5:1 mass intake ratios [calcium-to-phosphorus (Ca:P) ratio, both in milligrams] 39. In reality, the calcium-to-phosphorus (Ca:P) ratio in the typical U.S. diet is well below the recommended guidelines. For 25% of the U.S. population, these ratios are <0.6. In animal studies, mass intake ratios ≤0.5 have been shown to be detrimental to bone, even when calcium intake was considered adequate 39.

Pettifor et al. 40 noted the importance of balancing intake between these minerals in a chronic feeding study in young vitamin D–replete baboons. Baboons were fed 1 of 3 experimental diets, each with adequate phosphorus, but high, normal, or low calcium levels, containing 1:0.78, 1:2.2, and 1:7.7 calcium-to-phosphorus (Ca:P) mass ratios, respectively, and a fourth diet low in both minerals with a mass ratio of 1:2.3. By 16 months, baboons fed the low-calcium, normal-phosphorus diet (1:7.7) showed histologic evidence of hyperparathyroidism and bone loss, whereas baboons fed the low-calcium, low-phosphorus diet (1:2.3) showed only histologic features of osteomalacia (poorly calcified bone). These findings suggest that the balance in intake between these 2 minerals may have greater influence than the absolute level of phosphorus. This appears to be true for human populations as well, as shown in a cross-sectional study of young Finnish women 41. The calcium intake of the women was greater than the Recommended Dietary Allowance (RDA) in all but 1 quartile, whereas phosphorus intake was greater than twice the Recommended Dietary Allowance (RDA) in all quartiles. In the quartile with the lowest intake of calcium, the Ca:P intake ratio was 0.56 and the mean serum PTH concentration was significantly higher compared with the other quartiles, whose mass intake ratios were >0.7. Similar to animal models, high dietary phosphorus–induced, persistently elevated PTH has been shown to adversely affect peak bone mass and bone fragility with aging 39.

Recent clinical evidence from the Gambia stresses the importance of balance in the Ca:P intake ratio in children 42. Braithwaite et al. 42 showed that such an imbalance was present in Gambian children with active rickets who consumed natural food diets containing adequate dietary phosphorus but deficient in calcium (Ca:P molar ratio of 0.26–0.27). These children had higher fibroblast growth factor-23 [FGF-23] (65 vs. 54 RU/mL) than did local children without rickets consuming diets with higher molar intake ratios (0.32–0.49). In children, the skeletal effects of calcium deficiency may be exacerbated with greater imbalance in calcium and phosphorus intakes, even when phosphorus intake is low or moderate. In the Finnish study 41, adequate intake of calcium did not correct this imbalance when phosphorus intake was in great excess relative to calcium. Both natural and added sources of phosphorus appear to influence the Ca:P intake ratio. If either source of phosphorus is in excess relative to calcium, disordered homeostasis through an elevation in PTH and/or fibroblast growth factor-23 [FGF-23] can occur. These data suggest that the Ca:P intake ratio should be factored into analyses of the effect of high-phosphorus intake on chronic disease development.

Metastatic Calcification

The most serious, clearly harmful effect of hyperphosphatemia is calcification of nonskeletal tissues. This occurs when the calcium and phosphorus concentrations of ECF exceed the limits of solubility for secondary calcium phosphate (CaHPO4). This critical concentration is strongly dependent on amounts of other ions in the ECF, especially HCO3 citrate, H+, and K+, and so cannot be unambiguously defined. However, tissue calcification virtually never occurs at ECF calcium × phosphorus ion products less than ∼4 (mmol/ liter)2 [∼1(mg/dl)2]. Although ECF in adults is normally less than half-saturated with respect to CaHPO4, elevation of plasma Pi, if extreme, can bring the ECF to the point of saturation. Although both calcium and phosphate are involved in such ectopic mineralization, ECF calcium levels are tightly regulated and are usually affected little by even large variations in calcium intake. By contrast, the sensitivity of ECF Pi to joint effects of diet and renal clearance means that an elevation in ECF Pi will usually be the cause of supersaturation. When calcification involves the kidney, renal function can deteriorate rapidly, renal phosphorus clearance drops, and ECF Pi rises yet further, leading to a rapid downhill spiral.

Under saturated conditions, susceptible tissue matrices will begin to accumulate CaHPO4 crystals, particularly if local pH rises above 7.4. Saturation of ECF with respect to calcium and phosphorus almost never occurs in individuals with normal renal function, mainly because urine phosphate excretion rises in direct proportion to dietary intake. As Figure 2 shows, the upper limit of the normal adult range for serum Pi typically occurs at absorbed intakes above 2.2 g (71 mmol)/day. At 62.5 percent absorption, that means ingested intakes above 3.4 g (110 mmol)/day. The 1994 CSFII data indicate that the reported intake at the ninety-fifth percentile was 2.5 g (81.7 mmol)/day in boys aged 14 through 18 years. Hyperphosphatemia from dietary causes becomes a problem mainly in patients with end-stage renal disease or in such conditions as vitamin D intoxication. When functioning kidney tissue mass is reduced to less than ∼20 percent of normal, the GFR becomes too low to clear typical absorbed loads of dietary phosphorus, and then even sharply reduced phosphorus diets may still be excessive as they lead to hyperphosphatemia.

Although metastatic calcification can occur in patients with endstage renal disease in whom ECF Pi levels are not adequately controlled, it is not known to occur from dietary sources alone in persons with adequate renal function. For that reason, calcification in previously normal kidneys produced by high phosphorus intakes has been studied mainly in rats and mice 43. Production of calcification has required very high phosphate loads over and above the animals’ already high basal phosphate intakes and in several reports has required partial reduction of renal tissue mass, as well.

Skeletal Porosity

Skeletal lesions associated with high phosphorus intakes have been described in rabbits 44 and bulls 45. As with kidney toxicity, the bony lesions required extremely large phosphate intakes (in rabbits, about 40-fold typical human intakes on a body weight basis, and in bulls, feeding of a ration designed to support milk production in cows). None of these situations has any evident direct relevance to human nutrition or to human dietary intake of phosphate. Krook et al. 45 also noted that bone loss develops in household pets and zoo animals fed human table scraps and meat. Despite acknowledging that such foods are poor in calcium, they attribute the bone loss to the high phosphorus content of such diets. Lacking evidence that phosphorus would produce this effect with diets adequate in calcium, this conclusion seems unwarranted. Finally, given the evidence cited above that high phosphorus intakes in humans do not lead to negative calcium balance or to increased bone resorption, it seems likely that the bone disease in other animals is more a consequence of low effective calcium intake than of high phosphorus intake per se.

Interference with Calcium Absorption

As noted, some concerns have been expressed that a high phosphorus intake could interfere with calcium nutrition by complexing calcium in the chyme and reducing its absorption 38. Given the relative absorption efficiencies of calcium and phosphorus, there would not be a stoichiometric excess of phosphorus relative to calcium in the chyme until the Ca:P intake ratio fell below 0.375:1. However, even this is a purely theoretical concern. In the studies of Spencer et al. 46, in which inorganic neutral phosphate was added to the diet, and of Heaney and Recker 47, who studied women on their habitual intakes of food phosphorus, even Ca:P ratios as low as 0.08:1 did not lower calcium absorption. Nevertheless, it must be noted that it is more difficult for the body to compensate for impaired calcium absorption at low dietary calcium intakes compared with higher intakes 48. As prior expert panels have noted 49, even the theoretical potential for interference with the calcium economy by high phosphorus intakes is effectively negated if calcium intake is adequate.

Conclusions

The evidence of increasing phosphorus intake is clear, with more compounds being added to the food supply and more foods consumed as processed or pre-prepared, and the risk of exceeding the current upper intake level is feasible for large segments of the population. Beyond that, there is accumulating evidence that both the high intakes and the poor balance of intake with other nutrients may place individuals at risk of kidney disease, bone loss, cardiovascular disease 50, 51 and other chronic health conditions 52. However, evidence linking these in the general population remains weak at this time 52.

References
  1. USDA (2002c) The use of trisodium phosphate as an antimicrobial agent in poultry processing in the United States. USDA-FSIS, Office of International Affairs. November 2002.
  2. EC (1995) Directive 95/2/EC of 20 february 1995 amended.
  3. Federal Register. Use of trisodium phosphate on raw, chilled poultry carcasses. Fed Regist. 1994;59:551–554.
  4. SCVPH (1998) Report on benefits and limitations of antimicrobial treatments for poultry carcasses, adopted on 30 October 1998.
  5. Capita R, Alonso-Calleja C, García-Fernández MC, Moreno B. (2002) Review: Trisodium phosphate (TSP) treatment for decontamination of poultry. Food Sci. Tech. Int. 8: 11-24.
  6. Keener, K. M., Bashor, M. P., Curtis, P. A., Sheldon, B. W. and Kathariou, S. 2004. Comprehensive review of Campylobacter and poultry processing. Comp. Rev. Food Sci. Food Saf. 3: 105-116.
  7. Hollender R, Bender FG, Jenkins RK, Black CL (1993) Consumer evaluation of chicken treated with a trisodium phosphate application during processing. Poultry Sci. 72: 755-759.
  8. Opinion of the Scientific Panel on food additives, flavourings, processing aids and materials in contact with food (AFC) related to Treatment of poultry carcasses with chlorine dioxide, acidified sodium chlorite, trisodium phosphate and peroxyacids. The EFSA Journal (2005) 297, p.16 of 27. https://efsa.onlinelibrary.wiley.com/doi/epdf/10.2903/j.efsa.2006.297
  9. Assessment of the possible effect of the four antimicrobial treatment substances on the emergence of antimicrobial resistance – Scientific Opinion of the Panel on Biological Hazards. The EFSA Journal (2008) 659, 17-26. https://efsa.onlinelibrary.wiley.com/doi/epdf/10.2903/j.efsa.2008.659
  10. Capita R, Alonso-Calleja C, Garcia-Fernandez MC, Moreno B. Review: Trisodium phosphate (TSP) treatment for decontamination of poultry. Food Sci Technol Int. 2002;8:11–24.
  11. SCVPH (2003) Opinion on the evaluation of antimicrobial treatments for poultry carcasses, adopted on 14-15 April 2003.
  12. WHO (1982) Food additives series 17. Geneva.
  13. SCF (1991) Reports of the SCF, 25th series.
  14. EFSA (2005) Opinion of the Scientific Panel on Food Additives, Flavourings, Processing Aids and Materials in Contact with Food on a request from the Commission related to Semicarbazide in food. The EFSA Journal 219:1-36.
  15. Institute of Medicine (US) Standing Committee on the Scientific Evaluation of Dietary Reference Intakes. Dietary Reference Intakes for Calcium, Phosphorus, Magnesium, Vitamin D, and Fluoride. Washington (DC): National Academies Press (US); 1997. 5, Phosphorus. Available from: https://www.ncbi.nlm.nih.gov/books/NBK109813
  16. Diem K. Documenta Geigy. Ardsley, NY: Geigy Pharmaceuticals; 1970.
  17. Fomon SJ, Nelson SE. Calcium, phosphorus, magnesium, and sulfur. In: Fomon SJ, editor. Nutrition of Normal Infants. St. Louis: Mosby-Year Book, Inc.; 1993. pp. 192–216.
  18. Aloia JF, Vaswani AN, Yeh JK, Ellis K, Cohn SH. Total body phosphorus in postmenospausal women. Miner Electrolyte Metab. 1984;10:73–76
  19. Institute of Medicine Dietary reference intakes for calcium, phosphorus, magnesium, vitamin D and fluoride. Washington, DC: National Academies Press; 1997
  20. Calvo MS, Moshfegh AJ, Tucker KL. Assessing the Health Impact of Phosphorus in the Food Supply: Issues and Considerations. Advances in Nutrition. 2014;5(1):104-113. doi:10.3945/an.113.004861.
  21. Brodehl J, Gellissen K, Weber HP. Postnatal development of tubular phosphate reabsorption. Clin Nephrol. 1982;17:163–171
  22. Specker BL, Lichtenstein P, Mimouni F, Gormley C, Tsang RC. Calcium-regulating hormones and minerals from birth to 18 months of age: A cross-sectional study. II. Effects of sex, race, age, season, and diet on serum minerals, parathyroid hormone, and calcitonin. Pediatrics. 1986;77:891–896.
  23. Atkinson SA, Alston-Mills BP, Lonnerdal B, Neville MC, Thompson MP. Major minerals and ionic constituents of human and bovine milk. In: Jensen RJ, editor. Handbook of Milk Composition. California: Academic Press; 1995. pp. 593–619.
  24. Carroll MD, Abraham S, Dresser CM. Dietary intake source data: United States, 1976–1980. Data from the National Health Survey, Vital and Health Statistics series 11. no. 231. Hyattsville, MD: National Center for Health Statistics, Public Health Service, U.S. Department of Health and Human Services; 1983. DHHS Publ. No. (PHS) 83–1681.
  25. Atkinson SA, Alston-Mills BP, Lonnerdal B, Neville MC, Thompson MP. Major minerals and ionic constituents of human and bovine milk. In: Jensen RJ, editor. Handbook of Milk Composition. California: Academic Press; 1995. pp. 593–619
  26. DeVizia B, Mansi A. Calcium and phosphorus metabolism in full-term infants. Monatsschr Kinderheilkd. 1992;140:S8–S12.
  27. Lemann J Jr. Calcium and phosphate metabolism: An overview in health and in calcium stone formers. In: Coe FL, Favus MJ, Pak CY, Parks JH, Preminger GM, editors. Kidney Stones: Medical and Surgical Management. Philadelphia, PA: Lippincott-Raven; 1996. pp. 259–288
  28. Ziegler EE, Fomon SJ. Lactose enhances mineral absorption in infancy. J Pediatr Gastroenterol Nutr. 1983;2:228–294.
  29. Stanbury SW. The phosphate ion in chronic renal failure. In: Hioco DJ, editor. Phosphate et Metabolisme Phosphocalcique. Paris: Sandoz Laboratories; 1971.
  30. Lemann J Jr. Calcium and phosphate metabolism: An overview in health and in calcium stone formers. In: Coe FL, Favus MJ, Pak CY, Parks JH, Preminger GM, editors. Kidney Stones: Medical and Surgical Management. Philadelphia, PA: Lippincott-Raven; 1996. pp. 259–288.
  31. Heaney RP, Weaver CM, Fitzsimmons ML. Influence of calcium load on absorption fraction. J Bone Miner Res. 1990;5:1135–1138.
  32. Heaney RP, Recker RR, Stegman MR, Moy AJ. Calcium absorption in women: Relationships to calcium intake, estrogen status, and age. J Bone Miner Res. 1989;4:469–475.
  33. Chen TC, Castillo L, Korycka-Dahl M, DeLuca HF. Role of vitamin D metabolites in phosphate transport of rat intestine. J Nutr. 1974;104:1056–1060.
  34. Brickman AS, Coburn JW, Massry SG. 1,25 dihydroxy-vitamin D3 in normal man and patients with renal failure. Ann Intern Med. 1974;80:161–168.
  35. Moya M, Cortes E, Ballester MI, Vento M, Juste M. Short-term polycose substitution for lactose reduces calcium absorption in healthy term babies. J Pediatr Gastroenterol Nutr. 1992;14:57–61.
  36. Bour NJS, Soullier BA, Zemel MB. Effect of level and form of phosphorus and level of calcium intake on zinc, iron and copper bioavailability in man. Nutr Res. 1984;4:371–379.
  37. Snedeker SM, Smith SA, Greger JL. Effect of dietary calcium and phosphorus levels on the utilization of iron, copper, and zinc by adult males. J Nutr. 1982;112:136–143.
  38. Calvo MS, Park YK. Changing phosphorus content of the U.S. diet: Potential for adverse effects on bone. J Nutr. 1996;126:1168S–1180S.
  39. Calvo MS, Park YK. Changing phosphorus content of the US diet: potential for adverse effects on bone. J Nutr. 1996;126(suppl):1168S–80S
  40. Pettifor JM, Marie PJ, Sly MR, du Bruyn DB, Ross F, Isdale JM, Dekerk W, Van der Walt WH. The effects of differing dietary calcium and phosphorus contents on mineral metabolism and bone histomorphometry in young vitamin D-replete baboons. Calcif Tissue Int. 1984;36:668–76
  41. Kemi VE, Kärkkäinen MUA, Rita HJ, Laaksonen MM, Outila TA, Lamberg-Allardt CJ. Low calcium:phosphorus ratio in habitual diets affects serum parathyroid hormone concentration and calcium metabolism in healthy women with adequate calcium intake. Br J Nutr. 2010;103:561–8
  42. Braithwaite V, Jarjou LMA, Goldberg GR, Jones H, Pettifor JM, Prentice A. A follow-up study of Gambian children with rickets-like bone deformities and elevated plasma FGF-23: possible aetiological factors. Bone. 2012;50:218–25
  43. NRC (National Research Council); Committee on Animal Nutrition; Board on Agriculture. Nutrient Requirements of Laboratory Animals. Washington, DC: National Academy Press; 1995.
  44. Jowsey J, Balasubramaniam P. Effect of phosphate supplements on soft tissue calcification and bone turnover. Clin Sci. 1972;42:289–299
  45. Krook L, Whalen JP, Lesser GV, Berens DL. Experimental studies on osteoporosis. Methods Achiev Exp Pathol. 1975;7:72–108.
  46. Spencer H, Kramer L, Osis D, Norris C. Effect of phosphorus on the absorption of calcium and on the calcium balance in man. J Nutr. 1978;108:447–457.
  47. Heaney RP, Recker RR. Effects of nitrogen, phosphorus, and caffeine on calcium balance in women. J Lab Clin Med. 1982;99:46–55
  48. Heaney RP. Vitamin D: Role in the calcium economy. In: Feldman D, Glorieux FH, Pike JW, editors. Vitamin D. San Diego, CA: Academic Press; 1997. pp. 485–497
  49. Chinn HI. Effects of dietary factors on skeletal integrity in adults: Calcium, phosphorus, vitamin D, and protein. 1981. Prepared for Bureau of Foods, Food and Drug Administration, U.S. Department of Health and Human Services, Washington, D.C.
  50. Association of serum phosphorus and calcium x phosphate product with mortality risk in chronic hemodialysis patients: a national study. Block GA, Hulbert-Shearon TE, Levin NW, Port FK. Am J Kidney Dis. 1998 Apr; 31(4):607-17. https://www.ncbi.nlm.nih.gov/pubmed/9531176/
  51. Serum phosphorus levels associate with coronary atherosclerosis in young adults. Foley RN, Collins AJ, Herzog CA, Ishani A, Kalra PA. J Am Soc Nephrol. 2009 Feb; 20(2):397-404. https://www.ncbi.nlm.nih.gov/pmc/articles/PMC2637043/
  52. Calvo MS, Moshfegh AJ, Tucker KL. Assessing the Health Impact of Phosphorus in the Food Supply: Issues and Considerations. Advances in Nutrition. 2014;5(1):104-113. doi:10.3945/an.113.004861. https://www.ncbi.nlm.nih.gov/pmc/articles/PMC3884091/
read more
Food Additives

Lactic acid

Lactic acid

What is lactic acid

Lactic acid (C3H6O3) is a normal intermediate in the fermentation (oxidation, metabolism) of sugar. The concentrated form is used internally to prevent gastrointestinal fermentation. Lactic acid is a yellow to colorless crystal or liquid. Pure lactic acid is odorless. Other forms have a weak, unpleasant odor. Lactic acid has an acrid taste. Lactic acid mixes easily with water. Lactic acid is produced in most living organisms, its concentration increases in serum and muscle following exercise and is a component in blood and transfers into the body. Lactic acid is also found naturally in foods such as apples and other fruits, molasses, sour milk, wines, beer and plants. Lactic acid is also used as a food additive E 270, especially fermented foods like buttermilk, sourdoughs, beer and wine. Ultimately any absorbed lactic acid will be oxidized to give carbon dioxide and water.

Lactic acid (E 270) is a permitted food additive used in a variety of foods (e.g. nectars, jam, jellies, marmalades, mozzarella and whey cheese, fats of animal or vegetable origin for cooking and/or frying, canned and bottled fruits and vegetables, fresh pasta, beer) according to European Union Regulation (EC) No 1333/2008 on food additives 1. The Joint Food and Agriculture Organization of the United Nations (FAO)/World Health Organization (WHO) Expert Committee on Food Additives (JECFA) issued an opinion on lactic acid 2 allocating an acceptable daily intake (ADI) of ‘not limited’. In 1991, this acceptable daily intake (ADI) was supported by the Scientific Committee of Food 3.

Lactic acid is also a breakdown product of some chemicals present in the air reacting with light. Lactic acid is an important commercial chemical used to make some plasticizers, adhesives, pharmaceuticals and salts. Lactic acid is used in the leather tanning industry and as a solvent. Lactic acid is an ingredient in many household cleaning products and personal care products.

2% to 5% lactic acid solutions at temperatures of up to 55 °C applied either by spraying or misting is used for decontamination of beef carcasses, cuts and
trimmings.

Hyperlactatemia and lactic acidosis are among the most dangerous and life-threatening side effect that occurs during therapy with some nucleoside reverse transcriptase inhibitors, mainly didanosine and stavudine (d4T), also known as d-drugs. A prospective, follow-up study 4 aimed to examine the incidence rates and rate ratios of hyperlactatemia and lactic acidosis for each nucleoside reverse transcriptase inhibitor. Three hundred and ninety-six HIV-patients were included in final analysis comprising 783.8 person-years of follow-up. Between 1st January 2000 and 1st January 2008, 19 cases of hyperlactatemia and 15 cases of lactic acidosis were recorded 4. Between regimens with the significant impact for developing hyperlactatemia and lactic acidosis the lowest incidence rate was for didanosine (incidence rate=2.87 per 100 person-years and incidence rate=4.31 per 100 person-years, respectively), and the highest for didanosine+stavudine (incidence rate=10.17 per 100 person-years, and incidence rate=7.39 per 100 person-years, respectively). Compared to didanosine alone the rate ratio of hyperlactatemia was 2.67 for stavudine, and 4.06 for didanosine+stavudine. The rate ratio of lactic acidosis was 3.12 for stavudine, and 5.13 for didanosine+stavudine in comparison with didanosine alone. Other risk factors for hyperlactatemia were CD4 cell count less than 200 cells/cu mm and female sex. These results suggest that the use of stavudine alone or in combination with didanosine should not be used as first-line therapy, especially in patients with CD4 cell count less than 200 cells/cu mm and females if other treatment options are available.

What is normal lactic acid level in a human body?

The blood lactate concentration reflects a balance between production and uptake of lactate in tissues, and is normally between 0.5-1.8 mmol/L or 90 mg/L in a resting condition.

Elevated lactate is not clearly and universally defined but most studies use cut-offs between 2.0 and 2.5 mmol/L 5 whereas “high” lactate has been defined as a lactate level > 4 mmol/L in a number of studies 6.

“Lactic acidosis” is often used clinically to describe elevated lactate but should be reserved for cases where there is a corresponding acidosis (pH < 7.35) 7.

Lactic acid build up in body and in muscles

Lactate is produced by most tissues in the human body in carbohydrate and amino acid metabolism, with the highest level of production found in muscle 8. Lactate is also a natural component of very many foods, in particular fruits and fermented milk products. Under normal conditions, lactate is rapidly cleared by the liver with a small amount of additional clearance by the kidneys 9. In aerobic conditions, pyruvate is produced via glycolysis and then enters the Krebs cycle, largely bypassing the production of lactate. Under anaerobic conditions, lactate is an end product of glycolysis and feeds into the Cori cycle as a substrate for gluconeogenesis (see Figure 1). Lactate exists in two isomers: L-lactate and D-lactate. Current lactate measurements only include L-lactate (the primary isomer produced in humans). D-lactate is produced by bacteria in the human colon when they are exposed to large amounts of unabsorbed carbohydrates. In the setting of alteration in the intestinal flora and a high carbohydrate load (such as in short bowel syndrome) there will be an excess production of D-lactate, which can cross into the bloodstream and potentially cause neurologic symptoms.

Key points

  • Elevated lactate can be caused by a number of conditions including shock, sepsis, cardiac arrest, trauma, seizure, ischemia, diabetic ketoacidosis, thiamine deficiency, malignancy, liver dysfunction, genetic disorders, toxins, and medications
  • Elevated lactate has been associated with increased mortality in a number of diseases such as sepsis, trauma and cardiac arrest
  • Decreased lactate clearance has been found to be associated with increased mortality in sepsis, post-cardiac arrest, trauma, burns and other conditions
  • When approaching the patient with elevated lactate, the possibility of a multifactorial causes must be considered
  • In spite of its imperfect sensitivity and specificity, the lactate blood test remains a clinically useful test that can alert a clinician to underlying hypoperfusion in need of immediate treatment or an etiology not readily apparent on initial evaluation

Figure 1. Lactic acid production and aerobic and anaerobic metabolism

Lactic acid production and metabolism

Abbreviatons: ATP = Adenosine triphosphate; CoA = Coenzyme A; PDH = Pyruvate dehydrogenase

[Source 10]

Lactate is one of the substances produced by cells as your body turns food into energy (cell metabolism). Lactate is formed by reduction of pyruvate, and is metabolized by oxidation to pyruvate in the reaction catalyzed by the cytosolic NAD-dependent lactate dehydrogenase (Figure 2). Depending on pH, lactate is sometimes present in the form of lactic acid. However, with the neutral pH maintained by the body, most of it will be present in the blood in the form of lactate.

Normally, the level of lactate in blood and cerebrospinal fluid (CSF) is low. Lactate is produced in excess by muscle cells, red blood cells, brain, and other tissues when there is insufficient oxygen at the cellular level or when the primary way of producing energy in the body’s cells is disrupted. Excess lactate can lead to lactic acidosis.

Lactic acid is mainly produced in muscle cells and red blood cells. Under conditions of heavy energy demand (and thus high oxygen need) skeletal muscles convert glucose into lactic acid to use for energy when oxygen levels are low (anaerobic), which is excreted from the muscle cells into the blood. In the liver this lactic acid is reduced to glucose.

The principal means of producing energy within cells occurs in the mitochondria, tiny power stations inside most cells of the body. The mitochondria use glucose and oxygen to produce ATP (adenosine triphosphate), the body’s primary source of energy. This is called aerobic energy production.

Whenever cellular oxygen levels decrease and/or the mitochondria are not functioning properly, the body must turn to less efficient energy production to metabolize glucose and produce ATP (adenosine triphosphate). This is called anaerobic energy production and the primary byproduct is lactic acid, which is processed (metabolized) by the liver.

Lactic acid can accumulate in the body and blood when it is produced faster than the liver can break it down.

Figure 2. Lactate metabolism

lactate metabolism

Footnote: Outline of lactate metabolism. With insufficient oxygen supply, pyruvate will be diverted to lactate, thereby assuring regeneration of NAD+ from NADH. This will enable glycolysis, and the accompanying ATP production to proceed.

The metabolic fate of pyruvate is mainly mitochondrial oxidation to carbon dioxide and water with accompanying energy production in the respiratory chain. The latter sequence of reactions are oxygen requiring, and with insufficient oxygen supply, or if pyruvate production for other reasons exceeds the capacity of oxidative metabolism, pyruvate will be diverted to lactate. This assures regeneration of NAD+ from NADH, which will enable glycolysis, and the accompanying ATP production to proceed. Due to the central role of the NAD-redox state for lactate production and metabolism, any metabolic condition giving rise to a steady-state increase in the cytosolic NADH/NAD+ ratio, will cause an increased net lactate production. This applies not only to conditions of hypoxia/anoxia in all tissues, but is also observed e.g. during extensive muscular work, and during alcohol metabolism by the liver. Lactate is released from tissues accompanied by a proton, and because lactic acid is fully dissociated at pH above approximately 6, excessive lactate production may thus give rise to lactic acidosis. The uptake of lactate from plasma takes place predominantly in liver and heart, where lactate will be used as an energy producing substrate or, in case of the liver, as a precursor for glucose formation.

[Source 11]

Figure 3. Lactic acid and lactate chemical structure

actic acid and lactate chemical structure

There are a number of conditions that can cause high levels of lactate.

Excess lactate may indicate one or a combination of the following:

  • Lack of oxygen (hypoxia)
  • The presence of a condition that causes increased lactate production
  • The presence of a condition that causes decreased clearance of lactate from the body

Times when your body’s oxygen level might drop include:

  • During intense exercise
  • When you have an infection or disease

Increased lactate levels may also be seen with thiamine (vitamin B1) deficiency. Thiamine serves as a co-factor for multiple cellular enzymes including pyruvate dehydrogenase and α-ketoglutarate dehydrogenase, components essential to the tricarboxylic acid cycle and aerobic carbohydrate metabolism (see Figure 1). In the absence of thiamine, anaerobic metabolism predominates and lactate production increases 12. The development of elevated lactate in both serum and cerebrospinal fluid secondary to thiamine deficiency has been well described 13.

Table 1. Causes of elevated lactate

ShockPharmacological agents*
 Distributive Linezolid
 Cardiogenic Nucleoside reverse transcriptase inhibitors
 Hypovolemic Metformin
 Obstructive Epinephrine
Post-cardiac arrest Propofol
Regional tissue ischemia Acetaminophen
 Mesenteric ischemia Beta2 agonists
 Limb ischemia Theophylline
 Burns
 TraumaAnaerobic muscle activity
 Compartment syndrome Seizures
 Necrotizing soft tissue infections Heavy exercise
Diabetic ketoacidosis Excessive work of breathing
Drugs/toxinsThiamine deficiency
 AlcoholsMalignancy
 CocaineLiver failure
 Carbon monoxideMitochondrial disease
 Cyanide
[Source 14]

Table 2. Common drugs and toxins associated with elevated lactate

Drug/toxinRisk factorsProposed mechanismSuggested treatment in addition to cessation of the offending agent
MetforminbCongestive heart failure, kidney failure, liver failure or overdoseInhibition of gluconeogenesis and mitochondrial impairment, inhibition of lactate eliminationConsider hemodialysis
AcetaminophenOverdoseImpairment of the mitochondrial electron transport chain. Later hepatotoxicity and systemic effects.Enteral activated charcoal and N-acetylcysteine.
NRTIFemale genderDirect mitochondrial toxicityNo specific treatment
LinezolidPossibly prolonged use in elderly patientsDirect mitochondrial toxicityNo specific treatment
Beta2-agonistsNot applicableBeta2-adrenergic stimulation causing increased glycogenolysis, glycolysis and lipolysis. Free fatty acids released by lipolysis may inhibit PDH.Depending on the clinical situation the beta2-agonist may/should be continued
PropofolProlonged high-dose use (Propofol Infusion Syndromed)Impairment of the mitochondrial electron transport chain and fatty acid oxidationSupportive treatment and potentially hemodialysis should be considered
EpinephrineNot applicableLikely due to beta2-adrenergic stimulation (see beta2-agonists)Depending on the clinical situation epinephrine may be continued.
TheophyllineOverdose, though reported in standard dosesIncreased levels of catecholamines (see beta2-agonists)Enteral activated charcoal. Hemodialysis in severe cases.
Alcohols (ethanol, methanol, propylene glycol)b,cClinical relevance controversial and may be confounded by comorbidities (thiamine deficiency, seizures, sepsis, and other toxins)Increased NADH levels due to ethanol metabolism may inhibit PDH and the utilization of lactate. Contributions from underlying comorbidities or possibly ketoacidosis may play a roleIdentification and treatment of underlying disorders including administration of thiamine.
CocaineNot applicableBeta2-adrenergic stimulation (see beta2-agonists). Vasoconstriction causing ischemia.Supportive care and benzodiazepine
Carbon monoxideNot applicableDecreased oxygen-carrying capacity of the blood.High-flow/hyperbaric oxygen. Consider co-exposure to cyanide
CyanideNot applicableNoncompetitive inhibition of cytochrome c oxidase causing mitochondrial dysfunction and inability to utilize oxygenHydroxocobalamin or other cyanide antidote kit (Sodium nitrite, amyl nitrite, sodium thiosulfate). Consider co-exposure to carbon monoxide.

Footnotes:

a: NRTI = Nucleoside reverse transcriptase inhibitor, PDH = Pyruvate dehydrogenase, NADH = Reduced nicotinamide adenine dinucleotide
b: See text for more details
c: Ethylene glycol may cause falsely elevated lactate levels
d: The Propofol Infusion Syndrome is characterized by cardiac failure, rhabdomyolysis, metabolic acidosis and renal failure.

[Source 14]

When lactic acid production increases significantly, the affected person is said to have hyperlactatemia, which can then progress to lactic acidosis as more lactic acid accumulates. The body can often compensate for the effects of hyperlactatemia, but lactic acidosis can be severe enough to disrupt a person’s acid/base (pH) balance and cause symptoms such as muscular weakness, rapid breathing, nausea, vomiting, sweating, and even coma.

A test can be done to measure the amount of lactic acid in your blood. The lactate test measures the level of lactate in the blood at a given point in time or less commonly, in the cerebrospinal fluid (CSF). A normal lactate level indicates that a person does not have lactic acidosis, that there is sufficient oxygen at the cellular level, and/or that their signs and symptoms are not caused by lactic acidosis.

Excessive Muscle Activity

Lactate levels increase with heavy exercise, mainly due to anaerobic metabolism 15. Siegel and coworkers 16 found that lactate levels were elevated in 95% of collapsed marathon runners, with levels from 1.1 to 11.2 mmol/L.

Elevated lactate in the setting of acute severe asthma may be caused, at least in part, by excessive muscle work 17. Rabbat et al. 18 found that elevated lactate is common in acute severe asthma and that lactate increases in the first 6 hours after admission. They found no association with mortality or progression to respiratory failure. Beta agonists used in asthma treatment may also play a role due to excessive adrenergic stimulation (see Table 2) but the exact pathophysiology of elevated lactate in asthma warrants further research 19. Furthermore, excessive muscle work and respiratory muscle fatigue independent of the underlying etiology have been suggested to cause elevated lactate but further research is necessary to clarify this relationship 20.

Elevated lactate due to excessive muscle activity has also been associated with the use of restraints. A delirious or intoxicated patient may struggle against restraints and produce lactate due to muscle activity and tissue hypoxia. Sudden death has been reported in this population although whether that is a result of acidosis remains unknown. Proper sedation or alternative methods for restraint may be required for patient safety in this scenario 21.

Lactic acid test

The lactate test is primarily ordered to help determine if someone has lactic acidosis, a level of lactate that is high enough to disrupt a person’s acid-base (ph) balance.

Depending on pH, it is sometimes present in the form of lactic acid. However, with the neutral pH maintained by the body, most lactic acid will be present in the blood as lactate.

  • Lactic acidosis is most commonly caused by an inadequate amount of oxygen in cells and tissues (hypoxia). If someone has a condition that may lead to a decreased amount of oxygen delivered to cells and tissues, such as shock or congestive heart failure, this test can be used to help detect and evaluate the severity of hypoxia and lactic acidosis. It may be ordered along with blood gases to evaluate a person’s acid/base balance and oxygenation.
  • As lactic acidosis may also be caused by conditions unrelated to oxygen levels, this test may be used to evaluate someone who has a disease that can lead to increased lactate levels and who has signs and symptoms of acidosis. It may be ordered along with groups of tests, such as the comprehensive metabolic panel, basic metabolic panel or complete blood count (CBC), to determine if an underlying condition, such as liver or kidney disease, is causing lactic acidosis.
  • The lactate test may also be used as part of an initial evaluation of someone who is suspected of having sepsis. Typically, if the person’s lactate level is above normal limits, treatment will be initiated without delay. If a person with sepsis can be diagnosed and treated promptly, their chances of recovery are significantly improved.
  • Lactate levels may be ordered at intervals to help monitor hypoxia and response to treatment in a person being treated for an acute condition, such as sepsis, shock or heart attack, or a chronic condition, such as severe congestive heart failure.

A cerebrospinal fluid (CSF) lactate test may be ordered, along with a blood lactate test, to help distinguish between viral and bacterial meningitis.

When is lactate test ordered?

A lactate test may be ordered when someone has signs and symptoms of inadequate oxygen (hypoxia) such as:

  • Shortness of breath
  • Rapid breathing
  • Paleness
  • Sweating
  • Nausea
  • Muscle weakness
  • Abdominal pain
  • Coma

The test may be ordered when a person has signs and symptoms that a health practitioner suspects are related to sepsis, shock, heart attack, severe congestive heart failure, kidney failure, or uncontrolled diabetes.

The lactate test may be initially ordered with other tests to help evaluate a person’s condition. If lactate is significantly elevated, it may be ordered at intervals to monitor the condition.

CSF and blood lactate levels may be ordered when a person has signs and symptoms of meningitis, such as severe headaches, fever, delirium, and loss of consciousness.

What does abnormal lactate test result mean?

A high lactate level in the blood means that the disease or condition a person has is causing lactate to accumulate. In general, a greater increase in lactate means a greater severity of the condition. When associated with lack of oxygen, an increase in lactate can indicate that organs are not functioning properly.

However, the presence of excess lactate is not diagnostic. A health practitioner must consider a person’s medical history, physical examination, and the results of other diagnostic tests in order to determine the cause and to diagnose the underlying condition or disease.

A number of conditions can cause elevated lactate levels. They are separated into two groups according to the mechanism by which they cause lactic acidosis.

1) Type A lactic acidosis, the most common type, may be due to conditions that cause a person to be unable to breathe in enough oxygen (inadequate oxygen uptake in the lungs) and/or cause reduced blood flow, resulting in decreased transport of oxygen to the tissues (decreased tissue perfusion). Examples of type A conditions include:

  • Shock from trauma or extreme blood loss (hypovolemia)
  • Sepsis
  • Heart attack
  • Congestive heart failure
  • Severe lung disease or respiratory failure
  • Fluid accumulation in the lungs (Pulmonary edema)
  • Very low level of red blood cells and/or low hemoglobin (severe anemia)

2) Type B lactic acidosis is not related to delivery of oxygen but reflects excess demand for oxygen or metabolic problems. Examples of type B causes include:

  • Excessive lactate production
    • Alcohols
    • Ethanol
    • Methanol
    • Ethylene glycol
    • Propylene glycol
  • Impaired lactate use
    • Liver disease
    • Kidney disease
  • Fructose metabolic defects
  • Diabetes mellitus/Inadequately treated (uncontrolled) diabetes
  • Leukemia
  • AIDS
  • Rare glycogen storage diseases (such as glucose-6-phosphatase deficiency)
  • Use of certain drugs such as salicylates and metformin
  • Exposure to toxins such as cyanide and methanol
  • A variety of rare inherited metabolic and mitochondrial diseases that are forms of muscular dystrophy and affect normal ATP production (see the Related
  • Content below for links to more information on these)
  • Strenuous exercise, as with marathon runners
  • Impaired oxygen use
  • Disruption of mitochondrial oxidative phosphorylation
    • Cyanide intoxication
    • Carbon monoxide intoxication
    • Linezolid
    • Biguanides
    • Nucleoside analog reverse transcription inhibitors
    • Acetaminophen intoxication
  • Acquired defects of the citric acid cycle or tricarboxylic acid cycle
    • Thiamine deficiency
    • Nutritional
    • Cancer
    • Alcoholism
    • Gastrectomy
  • Congenital defects of:
    • Pyruvate transport
    • Citric acid cycle or tricarboxylic acid cycle enzymes
    • Pyruvate dehydrogenase complex

When someone is being treated for lactic acidosis or hypoxia, decreasing concentrations of lactate over time reflect a response to treatment.

When someone has signs and symptoms of meningitis, significantly increased cerebrospinal fluid lactate levels suggest bacterial meningitis while normal or slightly elevated levels are more likely to be due to viral meningitis.

Lactic acidosis is also associated with both inherited and acquired metabolic diseases. Lactic acid metabolism in the presence of altered gluconeogenesis, anaerobic glycolysis, and acid-base balance is a major factor in many disorders. Lactic acid can be formed only from pyruvic acid; therefore, disorders that increase pyruvate concentration, enhance lactic acid formation, or reduce lactic acid degradation cause lactic acidosis. Inborn metabolic errors that are accompanied by derangement of metabolic pathways of glucose, pyruvate, amino acids, and organic acids as well as toxic and systemic conditions that promote tissue hypoxia or mitochondrial injury result in lactic acidosis.

Is there anything I can do to decrease my lactate level?

Generally, no. However, if your elevated lactate level is due to an underlying condition that can be addressed, such as uncontrolled diabetes or a substance that can be avoided, such as ethanol, then you may be able to lower it. If you have been diagnosed with a condition, such as a metabolic disorder, following your prescribed treatment regimen should control your lactate level. If the increase is due to a temporary condition, such as shock or infection, then it will usually return to normal after the condition has been resolved.

Why would a health practitioner choose to measure lactate in a blood sample from an artery rather than blood from a vein?

Lactate measurements from arterial blood are thought to be more accurate and, because a tourniquet is not used, they are not generally affected by the collection process. A health practitioner may order an arterial lactate for these reasons or because a group of other tests called arterial blood gases (ABGs) are also being collected and the same sample can be used. When other arterial blood tests are not being ordered, a health practitioner may order a venous lactate because it provides an adequate evaluation of a person’s lactate level and because the collection process is not as uncomfortable.

Are there other ways to measure lactate than by sending a blood sample to the lab for testing?

Yes. Lactate may be measured using a small hand-held device much like a glucose meter at the point of care at a patient’s bedside, instead of in a laboratory. This type of monitoring is useful, for example, in emergency departments and intensive care units where rapid results are vital to the care of critically ill people. However, since the methods of measurement are different, the results from lactate point of care tests may not be comparable with those from tests performed in a laboratory.

What is the lactate/pyruvate ratio and how is it used?

A lactate/pyruvate ratio is a calculated result that may be used to differentiate between causes of lactic acidosis.

Pyruvate is a substance produced by and used by cells in the production of energy. The mitochondria within cells metabolize glucose in a series of steps to produce ATP, the body’s energy source. One of the steps involves pyruvate and the following step requires oxygen. When the oxygen level is low, pyruvate accumulates and is converted to lactate, resulting in an accumulation of lactate and lactic acidosis. An alternative cause is when there is impaired mitochondrial function and the pathway is interrupted, resulting in increased pyruvate and hence more lactate. The lactate/pyruvate ratio will be high in these cases.

However, there are certain congenital disorders (inborn errors of metabolism) in which pyruvate is not converted to lactate. One example is pyruvate dehydrogenase deficiency. In these cases, pyruvate will accumulate, the blood level will be high, and the lactate to pyruvate ratio will be low.

Lactic acid uses

Lactic acid has multiple uses in dyeing baths, as mordant in printing woolen goods, solvent for water-insoluble dyes. Lactic acid is also used for reducing chromates in mordanting wool, in manufacture of cheese, confectionery. Lactic acid is a component of babies’ milk formulas; acidulant in beverages; also used for acidulating worts in brewing. It is used in preparation of sodium lactate injections, and as ingredient of cosmetics, component of spermicidal jellies. Other uses of lactic acid: for removing Clostridium butyricum in manufacture of yeast; dehairing, plumping, and decalcifying hides, solvent for cellulose formate, flux for soft solder. Lactic acid is used to manufacture lactates which are used in food products, in medicine, and as solvents. Lactic acid is also a plasticizer, catalyst in the casting of phenolaldehyde resins.

Lactic acid risks

Eye, skin, nose, throat, and lung irritation may occur following exposure to lactic acid. Stomach ulcers have been observed from ingestion of high amounts of lactic acid. Death was reported from ingestion of a very high dose of lactic acid. In man, accidental intraduodenal administration of 100 mL 33% lactic acid was fatal within 12 hours 22. Diarrhea and weight loss were observed in healthy infants administered lactic acid as a dietary supplement. When 0.35% DL-lactic acid was administered to healthy babies from the tenth to the twentieth day of life, a threefold increase in the urinary excretion of the physiological L(+)-lactic acid and a twelve fold increase in the D(-)-lactic acid was observed 22. On withdrawing lactic acid from the diet the level of lactic acid excreted in the urine returned to normal. Since the racemic mixture used consisted of 80% of the L(+) and 20% of the D(-) forms it seems that the metabolism of the D(-) form by the young full-term baby is more difficult than the L(+) form. The increase in the urinary excretion of either form of lactic acid indicated that the young infant cannot utilize lactic acid at a rate which can keep up with 0.35% in the diet. A number of babies could not tolerate lactic acid 22. In such cases there was rapid loss of weight, frequent diarrhea, reduction of plasma bicarbonate and increased excretion of organic acids in the urine. All these effects were reversed on withdrawing lactic acid from the diet 22.

A skin test was performed using 49 a topic and 56 nonatopic patients to determine whether application of 2.5% lactic acid in water produces an urticarial reaction. Finn chambers containing 20 uL of test solution were fixed on the skin using porous tape for 20 min. Lactic acid produced no immediate reactions 23.

The ability of lactic acid to induce hyperkeratosis was evaluated 23. Lactic acid, 3 and 8%, pH 3, was applied to the outer aspect of the calf to induce scaling. When visible scaling and irritation occurred, the skin desquamation profile was altered. Control values were 5.7% for cell renewal and 1 for irritation, clinical scaling, desquamation amount, and desquame size. After 3 weeks of application of 3% lactic acid, the values increased to 27.8% for cell renewal, 1.9 for irritation, 1.5 for scaling and the desquamation amount, and 1.6 for desquame size. With 8% lactic acid, these values increased to 44.2% for cell renewal, 4.2 for irritation, 3.5 for scaling, 1.8 for desquamation amount, and 3.8 for desquame size.

Tumors were not induced following long-term exposure to lactic acid in laboratory animals. The potential for lactic acid to cause cancer in humans has not been assessed by the U.S. EPA IRIS program, the International Agency for Research on Cancer, or the U.S. National Toxicology Program 13th Report on Carcinogens.

Lactic acid effect on eye is similar to that of other acid of moderate strength, causing initial epithelial coagulation on cornea and conjunctiva, but having good prognosis if promptly washed off with water.

References
  1. Safety of lactic acid and calcium lactate when used as technological additives for all animal species. EFSA Journal 5 July 2017. https://doi.org/10.2903/j.efsa.2017.4938
  2. JECFA Joint FAO/WHO Expert Committee on Food Additives, 1974. Toxicological evaluation of some anticaking agents, antimicrobials, antioxidants, emulsifiers and thickening agents. Toxicological monographs: WHO Food Additives Series, no. 5.
  3. SCF (Scientific Committee for Food), 1991. Reports of the Scientific Committee for Food 25th series: First series of food additives of various technological functions (Opinion expressed on 18 May 1990). Directorate-General, Internal Market and Industrial Affairs https://ec.europa.eu/commission/index_en
  4. Dragovic G, Jevtovic D; Biomed Pharmacother 66 (4): 308-11, 2012 https://www.ncbi.nlm.nih.gov/pubmed/22658063
  5. Kruse O, Grunnet N, Barfod C. Blood lactate as a predictor for in-hospital mortality in patients admitted acutely to hospital: a systematic review. Scandinavian journal of trauma, resuscitation and emergency medicine. 2011;19:74 https://www.ncbi.nlm.nih.gov/pmc/articles/PMC3292838/
  6. Callaway DW, Shapiro NI, Donnino MW, Baker C, Rosen CL. Serum lactate and base deficit as predictors of mortality in normotensive elderly blunt trauma patients. The Journal of trauma. 2009 Apr;66(4):1040–1044
  7. Definition of clinically relevant lactic acidosis in patients with internal diseases. Luft D, Deichsel G, Schmülling RM, Stein W, Eggstein M. Am J Clin Pathol. 1983 Oct; 80(4):484-9. https://www.ncbi.nlm.nih.gov/pubmed/6624712/
  8. Lactate kinetics in human tissues at rest and during exercise. van Hall G. Acta Physiol (Oxf). 2010 Aug; 199(4):499-508. https://www.ncbi.nlm.nih.gov/pubmed/20345411
  9. Contribution of liver and skeletal muscle to alanine and lactate metabolism in humans. Consoli A, Nurjhan N, Reilly JJ Jr, Bier DM, Gerich JE. Am J Physiol. 1990 Nov; 259(5 Pt 1):E677-84. https://www.ncbi.nlm.nih.gov/pubmed/2240206/
  10. Andersen LW, Mackenhauer J, Roberts JC, Berg KM, Cocchi MN, Donnino MW. Etiology and therapeutic approach to elevated lactate. Mayo Clinic proceedings. 2013;88(10):1127-1140. doi:10.1016/j.mayocp.2013.06.012. https://www.ncbi.nlm.nih.gov/pmc/articles/PMC3975915/
  11. Kruse O, Grunnet N, Barfod C. Blood lactate as a predictor for in-hospital mortality in patients admitted acutely to hospital: a systematic review. Scandinavian Journal of Trauma, Resuscitation and Emergency Medicine. 2011;19:74. doi:10.1186/1757-7241-19-74. https://www.ncbi.nlm.nih.gov/pmc/articles/PMC3292838/
  12. Butterworth RF. Thiamine deficiency-related brain dysfunction in chronic liver failure. Metab Brain Dis. 2009 Mar;24(1):189–196.
  13. Kountchev J, Bijuklic K, Bellmann R, Joannidis M. A patient with severe lactic acidosis and rapidly evolving multiple organ failure: a case of shoshin beri-beri. Intensive Care Med. 2005 Jul;31(7):1004.
  14. Andersen LW, Mackenhauer J, Roberts JC, Berg KM, Cocchi MN, Donnino MW. Etiology and therapeutic approach to elevated lactate. Mayo Clinic proceedings. 2013;88(10):1127-1140. doi:10.1016/j.mayocp.2013.06.012 https://www.ncbi.nlm.nih.gov/pmc/articles/PMC3975915/
  15. Cerretelli P, Samaja M. Acid-base balance at exercise in normoxia and in chronic hypoxia. Revisiting the “lactate paradox” European journal of applied physiology. 2003 Nov;90(5–6):431–448.
  16. Siegel AJ, Januzzi J, Sluss P, et al. Cardiac biomarkers, electrolytes, and other analytes in collapsed marathon runners: implications for the evaluation of runners following competition. American journal of clinical pathology. 2008 Jun;129(6):948–951.
  17. Appel D, Rubenstein R, Schrager K, Williams MH., Jr. Lactic acidosis in severe asthma. The American journal of medicine. 1983 Oct;75(4):580–584.
  18. Rabbat A, Laaban JP, Boussairi A, Rochemaure J. Hyperlactatemia during acute severe asthma. Intensive Care Med. 1998 Apr;24(4):304–312.
  19. Prakash S, Mehta S. Lactic acidosis in asthma: report of two cases and review of the literature. Canadian respiratory journal : journal of the Canadian Thoracic Society. 2002 May-Jun;9(3):203–208.
  20. Roussos C. Respiratory muscle fatigue and ventilatory failure. Chest. 1990 Mar;97(3 Suppl):89S–96S.
  21. Alshayeb H, Showkat A, Wall BM. Lactic acidosis in restrained cocaine intoxicated patients. Tennessee medicine : journal of the Tennessee Medical Association. 2010 Nov-Dec;103(10):37–39.
  22. Joint FAO/WHO Expert Committee on Food Additives; WHO Food Additives Ser 40 a,b,c: Lactic acid 1966 http://www.inchem.org/documents/jecfa/jecmono/40abcj44.htm
  23. Cosmetic Ingredient Review Expert Panel; International Journal of Toxicology, 17 (Suppl.1): 1-203, 1998
read more
Food Additives

Calcium sulfate

calcium sulfate

What is calcium sulfate in food

Calcium sulfate (CaSO4) or calcium sulphate (E 516) is a calcium salt that is used for a variety of purposes including as food additive as acidity regulator, firming agent, flour treatment agent, sequestrant and stabilizer 1. The calcium sulfate hydrates are used as a coagulant in products such as tofu. Calcium sulfate (CaSO4) is also used as building materials, as a desiccant (drying agent), in dentistry as an impression material, cast, or die, and in medicine for immobilizing casts and as a tablet excipient (an inactive substance that serves as the vehicle or medium for a drug or other active substance). Calcium sulfate exists in various forms and states of hydration. Furthermore, the main use of calcium sulfate is to produce plaster of Paris and stucco. Plaster of Paris is a mixture of powdered and heat-treated gypsum. These applications exploit the fact that calcium sulfate which has been powdered and calcined forms a moldable paste upon hydration and hardens as crystalline calcium sulfate dihydrate. It is also convenient that calcium sulfate is poorly soluble in water and does not readily dissolve in contact with water after its solidification.

Calcium sulfate, the calcium salt of sulphuric acid appears in two forms: as anhydrite with a chemical formula CaSO4, molecular mass of 136.14 or as a dihydrate with the chemical formula CaSO4·2H2O, a molecular mass of 172.18. Calcium sulfate exists either as odorless white crystals or crystalline powder. When dissolved both salts dissociate to calcium and sulfate ions. Calcium sulfate is of limited solubility in water. The following summary covers both calcium sulfate and calcium sulfate dihydrate.

calcium sulfate

Calcium sulfate in food key facts

  • Calcium sulfate added directly to human food is generally recognized as safe (GRAS) by the U.S. Food and Drug Administration (FDA) 2.
  • Calcium sulphate is an approved food additive (E 516) in the European Union 3. Calcium sulfate was evaluated by the Scientific Committee on Food in 1990 and an Acceptable Daily Intake (ADI) not specified was allocated.
  • The European Food Safety Authority Panel concluded that calcium sulfate as a source of calcium for use in foods for particular nutritional uses is not of concern from the safety point of view 3. Calcium sulfate is permitted as a food additive in most foods with no other restriction other than good manufacturing practice 4.
  • The European Food Safety Authority Panel Panel concluded that use of calcium sulfate as a mineral substance in foods intended for the general population is not of safety concern 5.
  • If calcium sulfate was to be used as a mineral substance in foods other than water and water based beverages a “worst case” scenario would be that the intake of calcium from calcium sulfate could approach corresponding to an intake of about 8000 mg calcium sulfate per person per day, which would mean a daily intake of about 6000 mg sulfate ion per person. High bolus intakes of sulfate ion may lead to gastrointestinal discomfort in some individuals 5.
  • In human studies the bioavailability of calcium from calcium sulfate in mineral waters is comparable to that from milk and the sulfate anion does not affect the urinary excretion of calcium. Although no studies were available in humans, based on animal studies the bioavailability in humans of calcium from calcium sulfate in other foods is not expected to differ from that of already permitted calcium sources in foods for particular nutritional uses 5.
  • The use of calcium sulfate as a source of calcium in food supplements is of no safety concern assuming the total dietary exposure to calcium remains within the defined tolerable upper intake level and that the commercially available calcium sulfate will comply to the existing specifications as laid down in Directive 2000/63/EC 6. The tolerable upper intake level of 2500 mg/person/day for calcium was established for adults by the European Union Scientific Committee on Food in 2003 7.

Calcium sulfate in food

  • Aromatized alcoholic beverages (e.g. beer, wine and spirituous cooler-type beverages, low alcoholic refreshers)
  • Bakery wares
  • Batters (e.g. for breading or batters for fish or poultry)
  • Beer and malt beverages
  • Breakfast cereals, including rolled oats
  • Canned or bottled (pasteurized) or retort pouch vegetables (including mushrooms and fungi, roots and tubers, pulses and legumes, and aloe vera), and seaweeds
  • Cereal and starch based desserts (e.g. rice pudding, tapioca pudding)
  • Cheese analogues
  • Cider and perry
  • Clotted cream (plain)
  • Condensed milk and analogues (plain)
  • Confectionery
  • Cooked or fried vegetables (including mushrooms and fungi, roots and tubers, pulses and legumes, and aloe vera), and seaweeds
  • Cream analogues
  • Dairy-based desserts (e.g. pudding, fruit or flavored yogurt)
  • Dietetic foods (e.g. supplementary foods for dietary use)
  • Dietetic foods intended for special medical purposes
  • Dietetic formulae for slimming purposes and weight reduction
  • Distilled spirituous beverages containing more than 15% alcohol
  • Dried and/or heat coagulated egg products
  • Dried vegetables (including mushrooms and fungi, roots and tubers, pulses and legumes, and aloe vera), seaweeds, and nuts and seeds
  • Edible casings (e.g. sausage casings)
  • Edible ices, including sherbet and sorbet
  • Egg-based desserts (e.g. custard)
  • Fat emulsions mainly of type oil-in-water, including mixed and/or flavored products based on fat emulsions
  • Fat spreads, dairy fat spreads and blended spreads
  • Fat-based desserts excluding dairy-based dessert products
  • Flavoured fluid milk drinks
  • Food supplements
  • Fully preserved, including canned or fermented fish and fish products, including mollusks, crustaceans, and echinoderms
  • Heat-treated butter milk food category
  • Liquid whey and whey products, excluding whey cheeses
  • Mead
  • Milk powder and cream powder and powder analogues (plain)
  • Mustards
  • Pre-cooked or processed rice products, including rice cakes (Oriental type only)
  • Pre-cooked pastas and noodles and like products
  • Prepared foods
  • Preserved eggs, including alkaline, salted, and canned eggs
  • Processed cheese
  • Processed comminuted meat, poultry, and game products
  • Processed fruit
  • Processed meat, poultry, and game products in whole pieces or cuts
  • Protein products other than from soybeans
  • Ready-to-eat savories
  • Ripened cheese
  • Salads (e.g. macaroni salad, potato salad) and sandwich spreads excluding cocoa- and nut-based spreads
  • Sauces and like products
  • Seasonings and condiments
  • Semi-preserved fish and fish products, including mollusks, crustaceans, and echinoderms
  • Soups and broths
  • Soybean products
  • Soybean-based seasonings and condiments
  • Spices of food category
  • Table-top sweeteners, including those containing high-intensity sweeteners
  • Unripened cheese
  • Vegetable (including mushrooms and fungi, roots and tubers, pulses and legumes, and aloe vera), seaweed, and nut and seed pulps and preparations (e.g.vegetable desserts and sauces, candied vegetables)
  • Vegetable (including mushrooms and fungi, roots and tubers, pulses and legumes, and aloe vera), seaweed, and nut and seed purees and spreads (e.g., peanut butter)
  • Vegetables (including mushrooms and fungi, roots and tubers, pulses and legumes, and aloe vera), and seaweeds in vinegar, oil, brine, or soybean sauce
  • Vinegars
  • Water-based flavored drinks, including “sport,” “energy,” or “electrolyte” drinks and particulated drinks
  • Wines (other than grape)
  • Yeast and like products

Is calcium sulfate safe to eat?

Calcium sulfate added directly to human food is generally recognized as safe (GRAS) by the U.S. Food and Drug Administration (FDA) 2. Calcium sulphate is an approved food additive (E 516) in the European Union 3. Calcium sulfate was evaluated by the Scientific Committee on Food in 1990 and an Acceptable Daily Intake (ADI) not specified was allocated.

The intake of calcium sulfate (calcium sulphate) as used in waters and water based beverages can be estimated to be from 531 mg (375 mg of sulphate and 156 mg of calcium) to 1062 mg (750 mg of sulfate and 312 mg of calcium) per person per day 3. This intake is well below the tolerable upper intake level of 2500 mg/person/day for calcium established for adults by the European Union Scientific Committee on Food in 2003. The European Food Safety Authority Panel does not anticipate that the additional intake of sulfate from the use of calcium sulfate in waters would result in any adverse effects. In human studies the bioavailability of calcium from calcium sulfate in waters is comparable to that from milk and the sulfate anion does not affect the urinary excretion of calcium. The European Food Safety Authority Panel concluded that calcium sulfate as a source of calcium for use in foods for particular nutritional uses is not of concern from the safety point of view 3.

If calcium sulfate was to be used as a mineral substance in foods other than water and water based beverages a “worst case” scenario would be that the intake of calcium from calcium sulfate could approach corresponding to an intake of about 8000 mg calcium sulfate per person per day, which would mean a daily intake of about 6000 mg sulfate ion per person. High bolus intakes of sulfate ion may lead to gastrointestinal discomfort in some individuals 5.

In human studies the bioavailability of calcium from calcium sulfate in mineral waters is comparable to that from milk and the sulfate anion does not affect the urinary excretion of calcium. Although no studies were available in humans, based on animal studies the bioavailability in humans of calcium from calcium sulfate in other foods is not expected to differ from that of already permitted calcium sources in foods for particular nutritional uses 5.

The European Food Safety Authority Panel Panel concluded that use of calcium sulfate as a mineral substance in foods intended for the general population is not of safety concern 5.

Human data on absorption of calcium from calcium-rich mineral waters

The bioavailability of calcium from mineral water containing calcium sulfate was studied in 15 lactose intolerant male individuals and compared to that from milk. In eight of 15 subjects, there was a higher level of calcium absorption from mineral water than from milk. Bioavailability was similar in five of 15 subjects. The bioavailabilty of calcium absorption from milk was greater than that from mineral water in two of 15 subjects 8.

Calcium bioavailability from natural calcium and sulfate rich mineral water was compared with that from milk in nine healthy young women. Calcium absorption was measured in the fasting state with a dual-label stable isotope technique. Fractional absorption rates were 25.0 ± 6.7% from milk and 23.8 ± 4.8% from natural mineral water. No significant difference was found in the excretion of calcium, or in the excretion of the two stable calcium isotopes. It was concluded that calcium from the calcium- and sulfate-rich mineral water was as well absorbed and retained as that from milk, and no calciuric effect of sulfate was found 9.

The studies indicate that the bioavailability of calcium from calcium sulfate in mineral waters is comparable to that from milk and that the sulfate anion does not affect the urinary excretion of calcium 3.

The European Food Safety Authority Panel noted that the bioavailability of calcium from calcium sulfate in waters is comparable to that from milk 3.

No data were available on the bioavailability of calcium sulfate as a mineral substance in foods other than water and water based beverages. However, because absorption of calcium in the intestine requires that it is in a soluble form or bound to soluble organic molecules the bioavailability of calcium sulfate and calcium sulfate dihydrate is not expected to be significantly different from that of calcium chloride and calcium carbonate, respectively. Calcium chloride and calcium carbonate are already permitted as source of calcium in foods for particular nutritional uses and in food supplements.

The European Food Safety Authority Panel concluded that calcium sulfate as a source of calcium for use in foods for particular nutritional uses is not of concern from the safety point of view 3.

Calcium sulfate toxicological studies

In its evaluation of the sulfate ion, the Joint Food and Agriculture Organization of the United Nations (FAO)/World Health Organization (WHO) Expert Committee on Food Additives (JECFA) states, that the few available studies in experimental animals do not raise concern about the toxicity of sodium sulfate. Sodium sulfate is also used clinically as a laxative. In clinical trials using 2-4 single doses of up to 4500 mg sodium sulfate decahydrate per person (9000 – 18000 mg per person) only occasional loose stools were reported. These doses correspond to 2700 – 5400 mg sulfate ion. The sulfate absorbed remains in the extracellular fluid and is rapidly excreted via the kidneys 10.

In one study where sodium sulfate (18000 mg as the decahydrate) was administered orally to five human volunteers as either single doses corresponding to 8 g anhydrous salt (5400 mg sulfate ion) or as four equally divided hourly doses, the 72-hour urinary recovery of free sulfate was 53.4% and 61.8%, respectively. The single bolus doses produced diarrhea while the divided doses caused only mild or no diarrhea 11.

Calcium sulfate as dietary supplement

On the basis of available studies the Scientific Panel on Food Additives and Nutrient Sources added to Food (ANS) considers that the bioavailability of calcium from calcium sulfate is comparable to other inorganic calcium salts and that the use of calcium sulfate as a source of calcium in food supplements is of no safety concern assuming the total dietary exposure to calcium remains within the defined tolerable upper intake level and that the commercially available calcium sulfate will comply to the existing specifications as laid down in Directive 2000/63/EC 6, 12.

Calcium sulfate uses

Calcium sulfate (CaSO4) is used as food additives as acidity regulator, firming agent, flour treatment agent, sequestrant and stabilizer 1. However, the main use of calcium sulfate is to produce plaster of Paris and stucco. Plaster of Paris is a mixture of powdered and heat-treated gypsum. These applications exploit the fact that calcium sulfate which has been powdered and calcined forms a moldable paste upon hydration and hardens as crystalline calcium sulfate dihydrate. It is also convenient that calcium sulfate is poorly soluble in water and does not readily dissolve in contact with water after its solidification. Calcium sulfate (CaSO4) is also used as building materials, as a desiccant, in dentistry as an impression material, cast, or die, and in medicine for immobilizing casts and as a tablet excipient (an inactive substance that serves as the vehicle or medium for a drug or other active substance). Calcium sulfate exists in various forms and states of hydration.

Calcium sulfate in food side effects

High calcium intake can cause constipation. It might also interfere with the absorption of iron and zinc, though this effect is not well established 13. High intake of calcium from supplements, but not foods, has been associated with increased risk of kidney stones 14. Some evidence links higher calcium intake with increased risk of prostate cancer, but this effect is not well understood, in part because it is challenging to separate the potential effect of dairy products from that of calcium 13. Some studies also link high calcium intake, particularly from supplements, with increased risk of cardiovascular disease 15.

The Tolerable Upper Intake Levels for calcium established by the Food and Nutrition Board is between 2000 to 3000 milligrams (mg) per day. Getting too much calcium from foods is rare; excess intakes are more likely to be caused by the use of calcium supplements. NHANES data from 2003–2006 indicate that approximately 5% of women older than 50 years have estimated total calcium intakes (from foods and supplements) that exceed the Tolerable Upper Intake Level by about 300–365 mg 16.

Excessively high levels of calcium in the blood known as hypercalcemia can cause renal insufficiency, vascular and soft tissue calcification, hypercalciuria (high levels of calcium in the urine) and kidney stones 13. Although very high calcium intakes have the potential to cause hypercalcemia 15, it is most commonly associated with primary hyperparathyroidism or malignancy 13.

References
  1. Calcium sulfate (516). http://www.fao.org/gsfaonline/additives/details.html?id=274
  2. The use of calcium sulfate is affirmed as GRAS under 21 CFR 184.1230. https://www.accessdata.fda.gov/scripts/fdcc/?set=GRASNotices
  3. Calcium sulphate for use in foods for particular nutritional uses. The EFSA Journal (2003)20, 1-6. https://efsa.onlinelibrary.wiley.com/doi/epdf/10.2903/j.efsa.2004.20
  4. Calcium sulphate for use as a source of calcium in food supplements. Scientific Panel on Food Additives and Nutrient Sources added to food Question No EFSA-Q-2005-075. https://efsa.onlinelibrary.wiley.com/doi/epdf/10.2903/j.efsa.2008.814
  5. Calcium Sulphate as a mineral substance in foods intended for the general population. The EFSA Journal (2004) 112, 1-10 https://efsa.onlinelibrary.wiley.com/doi/epdf/10.2903/j.efsa.2004.112
  6. Calcium sulfate for use as a source of calcium in food supplements. Scientific Panel on Food Additives and Nutrient Sources added to food Question No EFSA-Q-2005-075. https://efsa.onlinelibrary.wiley.com/doi/epdf/10.2903/j.efsa.2008.814
  7. SCF, 2003. Opinion of the Scientific Committee on Food on the tolerable upper level of calcium. Opinion expressed on 4 April 2003.
  8. Harpern, G.M., Van de Valter, J. and Delabroise, A.-M. 1991. Comparative intake of calcium from milk and a calcium-rich mineral water in lactose intolerant adults: Implications for treatment of osteoporosis. Am. J. Prev. Med. 7, 379-383.
  9. Couzy, F., Kastenmayer, P., Vigo, M., Clough, J., Munoz-Box, R., Barclay, D.V. (1995). Calcium bioavailability from calcium- and sulphate-rich mineral water, compared with milk, in young adult women. Am. J. Clin. Nutr. 62, 1239-1244.
  10. JECFA, 2002. Evaluation of certain food additives and contaminants. Fifty-seventh report of the Joint FAO/WHO Expert Committee on Food Additives. WHO Technical Report Series, No. 909.
  11. Cocchetto, D.M., and Levy, G. (1981). Absorption of orally administered sodium sulphate in humans. J. Pharm. Sci. 70, 331-333.
  12. EC, 2000. Commission Directive 2000/63/EC of 5 October 2000 amending for the second time Commission Directive 96/77/EC of 2 December 1996 laying down specific purity criteria on food additives other than colours and sweeteners. OJ L277, 30.10.2000 p. 1.
  13. Committee to Review Dietary Reference Intakes for Vitamin D and Calcium, Food and Nutrition Board, Institute of Medicine. Dietary Reference Intakes for Calcium and Vitamin D. Washington, DC: National Academy Press, 2010.
  14. Lowe SA, Bowyer L, Lust K, McMahon LP, Morton M, North RA, et al. SOMANZ guidelines for the management of hypertensive disorders of pregnancy 2014. Aust N Z J Obstet Gynaecol. 2015;55:e1-29.
  15. Michaelsson K, Melhus H, Warensjo Lemming E, Wold A, Byberg L. Long term calcium intake and rates of all cause and cardiovascular mortality: community based prospective longitudinal cohort study. BMJ 2013;12;346:f228
  16. Bailey RL, Dodd KW, Goldman JA, Gahche JJ, Dwyer JT, Moshfegh AJ, Sempos CT, Picciano MF. Estimation of total usual calcium and vitamin D intakes in the United States. J Nutr. 2010 Apr;140(4):817-22
read more
Food Additives

Maltodextrin

maltodextrin

What is maltodextrin

Maltodextrin is a polysaccharide that is used as a food additive and as a carbohydrate supplement. As a supplement, maltodextrin is used to provide and sustain energy levels during endurance-oriented workouts or sports, to help build muscle mass and support weight gain. Maltodextrin is produced from starch and is usually found as a creamy-white hygroscopic powder. Polysaccharides are polymeric carbohydrate molecules composed of long chains of monosaccharide units bound together by glycosidic linkages, and on hydrolysis give the constituent monosaccharides or oligosaccharides. Maltodextrin is easily digestible, being absorbed as rapidly as glucose. Maltodextrin can be derived from any starch. They are industrially produced by enzymatic or acid hydrolysis of the starch, followed by purification and spray drying 1. In the US, this starch is usually rice, corn or potato; elsewhere, such as in Europe, it is commonly wheat. This is important for people with celiac disease, since the wheat-derived maltodextrin can contain traces of gluten. There have been recent reports of people with celiac disease reacting to maltodextrin in the United States. This might be a consequence of the shift of corn to ethanol production and its replacement with wheat in the formulation. The fast food chain, Wendy’s, footnotes maltodextrin in its list of gluten-free foods, which may be a sign of them receiving reports of this. Foods containing maltodextrin may contain traces of amino acids, including glutamic acid as a manufacturing by-product. The amino acid traces would be too small to have any dietary significance.

Maltodextrins the commercially available mostly white powders are of high purity and microbiological safety and are used in a wide range of food and beverage products, including baked goods and sports drinks 2. Although confusing to the average consumer, both digestible and resistant-to-digestion type of maltodextrins are commercially exploited as food ingredients under the same denominator 3. Maltodextrins can also be rendered indigestible to be used as a dietary fiber or prebiotic 4. Resistant maltodextrins are typically produced by purposeful rearrangement of starch or hydrolyzed starch to convert a portion of the normal alpha‐1,4‐glucose linkages to random 1,2‐,1,3‐, and 1,4‐alpha or ‐beta linkages. The human digestive system effectively digests only alpha‐1,4‐linkages, therefore the other linkages render the molecules resistant to digestion. The Glycemic Index (GI) of resistant maltodextrins is reported as less than 5, so indeed they are indigestible, as well as being tasteless.

Maltodextrins has an energy value of approximately 16 kJ/g (4 kcal/g), as underlined by international food law standards 5, digestible maltodextrins used in foods and beverages have long been considered to be a good source of energy 6. Most maltodextrins are fully soluble in water and exert other important functionalities, such as gelling or freeze control 7. As such, maltodextrins have found numerous applications in the food, beverage, dietetic, and medical food products, as well as in the pharmaceutical industry in tablet and powder applications 2.

Maltodextrins are classified by dextrose equivalent (glucose equivalent) and have a dextrose equivalent (glucose equivalent) between 3 and 20. The dextrose equivalent (glucose equivalent) corresponds to the amount of reducing sugars (in g) expressed as dextrose on 100 g dry matter in the product. Free D-glucose (dextrose) has a dextrose equivalent (glucose equivalent) of 100. The dextrose equivalent (glucose equivalent) of a maltodextrin correlates to the ratio of amylose and amylopectin content in the starch used to produce it; a higher amylopectin content correlates to a higher dextrose equivalent of a maltodextrin 8. Dried glucose syrups are, by definition, dried starch hydrolysis products with a dextrose equivalent greater than 20, whereas maltodextrins are defined as dried starch hydrolysis products with a dextrose equivalent equal to or lower than 20, but higher than 3 9. The higher the dextrose equivalent (glucose equivalent) value, the shorter the glucose chains, the higher the sweetness, the higher the solubility, and the lower heat resistance. Above dextrose equivalent (glucose equivalent) 20, the European Union’s CN code calls it glucose syrup; at dextrose equivalent (glucose equivalent) 10 or lower the customs CN code nomenclature classifies maltodextrins as dextrins. This crude yet relatively simple measurement is often used to express the degree of hydrolysis of starch; the higher the degree of hydrolysis, the higher the dextrose equivalent (glucose equivalent) 10.

Figure 1. Maltodextrin (maltodextrin consists of D-glucose units connected in chains of variable length. The glucose units are primarily linked with α(1→4) glycosidic bonds. Maltodextrin is typically composed of a mixture of chains that vary from three to 17 glucose units long)

Maltodextrin-chemical-structureThe applicability of maltodextrins in food products is highly influenced by specific physicochemical and technological properties. Among these properties are viscosity, fermentability, solubility, hygroscopicity, freezing point depression, and osmolality. In turn, these properties of maltodextrins strongly depend on their botanical source, production process, and therefore dextrose equivalence. An overview of the relationships between several important physicochemical properties and different dextrose equivalents is depicted in Figure 2.

Figure 2. Maltodextrin properties related to the level of dextrose equivalence (DE)

Maltodextrin properties related to the level of dextrose equivalence

Maltodextrin production

Maltodextrins are produced by hydrolysis of starch from different botanical sources. During the production process, native starch is heated in the presence of water, causing the crystalline structure of starch granules to swell and be broken irreversibly. This gelatinization process makes starch available for enzymatic or acidic degradation, or a combination of both 2. After degradation, chains of D-glucose units are left with varying length and appearance. Digestible maltodextrins (C6H10O5)nH2O) have a relatively short chain length and can be defined as saccharide polymers obtained from edible starch having a so-called dextrose equivalency (glucose equivalent) of less than 20 11.

What is maltodextrin glycemic index?

  • Maltodextrin has Glycemic Index of 90-110 12
  • Maltodextrin-Sucrose (mixture of 75% maltodextrin and 25% sucrose, adapted for sweetness) commonly found in sugar-sweetened beverages has Glycemic Index of 90
  • Soy milk 250 gram, full-fat (3%), Original, 0 mg calcium, 17 gram of carbohydrate with maltodextrin has Glycemic Index of 44 and Glycemic Load of 8
  • Soy milk 250 gram, full-fat (3%), Calciforte, 120 mg calcium, 18 gram of carbohydrate with maltodextrin has Glycemic Index of 36 and Glycemic Load of 6
  • Soy milk 250 gram, reduced-fat (1.5%), Light, 120 mg calcium, 17 gram of carbohydrate with maltodextrin has Glycemic Index of 44 and Glycemic Load of 8

The Glycemic Index (GI) is the measure of the glycemic response (the extent to which blood glucose levels rise) obtained after the ingestion of a carbohydrate-containing food. The reference source is frequently 50 g of glucose; it (equals 100) is often used as a standard, whereas white bread is used less frequently 13. The Glycemic Load (GL) is the product of the amount of available carbohydrate in a specific serving size and the Glycemic Index value (using glucose as the reference food), divided by 100 14. It takes into account both quality and quantity of available carbohydrate 15.

Is maltodextrin gluten free?

According to the Celiac Disease Foundation 16, maltodextrin is considered gluten free. That is maltodextrin is generally considered gluten-free even when derived from corn, due to the processing. However, as we pointed earlier, wheat-derived maltodextrin can contain traces of gluten. There have been recent reports of people with celiac disease reacting to maltodextrin in the United States. This might be a consequence of the shift of corn to ethanol production and its replacement with wheat in the formulation.

The ‘wheat’ origin does not need to be labeled in the European Union. In Europe, maltodextrins are seen as gluten-free carbohydrate sources and are used in gluten-free products 5. Wheat-based maltodextrins are published on Annex II as products causing non-allergies or intolerances.

What does the term gluten-free mean?

  • It means the product is less than 20-parts per million of gluten.

About how much gluten does it take to damage the villi of most people with celiac disease?

  • About an eighth of a teaspoon of wheat flour contains enough gluten to damage the villi of most people with celiac disease. There are a portion of people with celiac who cannot even tolerate this much, but the vast majority that can tolerate this amount is how the 20-parts per million was determined.

Can you absorb gluten through your skin?

  • No, you cannot absorb it through your skin.

Gluten-Containing Grains and Their Derivatives

  • Wheat
  • Varieties and derivatives of wheat such as:
    • wheatberries
    • durum
    • emmer
    • semolina
    • spelt
    • farina
    • farro
    • graham
    • KAMUT® khorasan wheat
    • einkorn wheat
  • Rye
  • Barley
  • Triticale
  • Malt in various forms including: malted barley flour, malted milk or milkshakes, malt extract, malt syrup, malt flavoring, malt vinegar
  • Brewer’s Yeast
  • Wheat Starch that has not been processed to remove the presence of gluten to below 20ppm and adhere to the U.S. Food and Drug Administration (FDA) Labeling Law*

*According to the FDA, if a food contains wheat starch, it may only be labeled gluten-free if that product has been processed to remove gluten, and tests to below 20 parts per million of gluten. With the enactment of this law on August 5th, 2014, individuals with celiac disease or gluten intolerance can be assured that a food containing wheat starch and labeled gluten-free contains no more than 20ppm of gluten. If a product labeled gluten-free contains wheat starch in the ingredient list, it must be followed by an asterisk explaining that the wheat has been processed sufficiently to adhere to the FDA requirements for gluten-free labeling.

When the U.S. Food and Drug Administration surveyed food products labeled “gluten free,” what percentage met that definition?

  • Almost 99% of the products on the market indeed fell below 20-parts per million of gluten.

The Following Ingredients ARE SAFE On The Gluten-Free Diet 16:

  • Caramel colors
  • Dextrin
  • Distilled vinegar
  • Maltodextrin
  • Maltose
  • Natural flavors
  • Yeast extract

The Following Ingredients Are NOT Safe On The Gluten-Free Diet 16:

  • Malt
  • Malt extract
  • Malt flavor
  • Malt syrup

Maltodextrin in food products

Through advances in science and technology, the knowledge on the (functional) application possibilities of maltodextrins in food and beverage products has improved significantly during the last 20 years. Due to their specific technological/functional properties and easy applicability, maltodextrins can substitute sucrose 17 or fat 18 and are being used in ice cream, dried instant food formulations, confectionary, cereals, snacks, and beverages 1.

Maltodextrin is sometimes used in beer brewing to increase the specific gravity of the final product. This improves the mouthfeel of the beer, increases head retention and reduces the dryness of the drink. Maltodextrin is not fermented by yeast, so it does not increase the alcohol content of the brew. It is also used in some snacks such as potato chips and jerky. It is used in “light” peanut butter to reduce the fat content, but keep the texture. Maltodextrin is also sometimes taken as a supplement by bodybuilders and other athletes in powder form or in gel packets.

Maltodextrin is used as an inexpensive additive to thicken food products such as infant formula. It is also used as a filler in sugar substitutes and other products.

Infant Nutrition

There is a strong nutritional reliance on lactose as a source of energy in early human development 19, preferably as part of the mother’s breast milk. However, lactase deficiency resulting in the inability to digest may lead to malabsorption-induced osmotic diarrhea in which approximately 40% of the energy provided may be lost 20. In such cases, maltodextrins can be used as a substitute for lactose to provide energy 21. In this respect, it is suggested also that the use of maltodextrins, instead of glucose is favorable since this helps reduce osmotic load and related intestinal distress 22. Maltodextrins are also used as a carbohydrate source in nonallergic infant formulae containing nondairy proteins (soy) or hydrolyzed proteins (hypoallergenic formulas).

Clinical Nutrition

In clinical nutrition, maltodextrins are applied in enteral and parenteral nutrition in which they can be combined with proteins for use of preoperative feeding and drinks 23. Administering preoperative drinks containing maltodextrins and protein, instead of using the conventional method of preoperative fasting, to patients undergoing major surgery for gastrointestinal malignancies seems to be a practical approach. For example, in one study, patients undergoing gastrointestinal surgery either received preoperative drinks containing 11% proteins, 70% maltodextrins, and 19% sucrose (intervention group) or fasted prior to their surgery (control group). Results showed that the average postoperative hospital stay of patients in the intervention group was 50% lower compared to the controls. In addition, the patients in the intervention group had a lower postoperative inflammatory reaction than the patients who did not receive the preoperative drinks 24. A different study investigated the effects of the administration of a preoperative drink containing maltodextrin and glutamine (maltodextrin and glutamine group) or only maltodextrin group prior to laparoscopic cholecystectomy. Patients included in the control group fasted prior to their surgery. Results showed a reduced biological response to surgical trauma by improving insulin sensitivity in patients in the maltodextrin and glutamine group, but not the maltodextrin group, compared to the control group 25.

Oral Rehydration Drinks

Early studies have indicated benefits of using maltodextrins in oral rehydration solutions (ORS) for individuals suffering from diarrhea over the use of glucose. In this respect, an early paper of Sandhu et al. 26 concluded that solutions with lower sodium and glucose-polymer content, compared to higher sodium content and higher osmolality due to the use of glucose, might be of nutritional benefit in the oral rehydration of acute infantile diarrhea.

At the same dry-weight concentration, the osmolality increases with increasing dextrose equivalence of the saccharide 27. Compared on a weight basis, the osmolality of maltodextrins is significantly lower than that of disaccharide sugars 28. El-Mougi et al 29 studied the use of maltodextrins in oral rehydration solutions and observed that the osmolality of a solution containing 50 g/L maltodextrin with a dextrose equivalent of 11–14 still had a slightly lower osmolality than a solution containing only 20 g/L glucose (227 mmol/L vs. 311 mmol/L, respectively).

Sports Rehydration Drinks

A low beverage osmolality supports gastric emptying rate and helps reduce gastrointestinal stress 30. Accordingly, aiming at a low beverage osmolality, maltodextrins are being used to replace sucrose or glucose in sport drinks. This is relevant since hypertonicity and related postingestion gastrointestinal distress symptoms are significant performance-limiting factors during running events such as marathons and triathlons exercise 31. Another effect of beverage hypertonicity is that it reduces water absorption rate. Vist and Maughan 30 evaluated the impact of carbohydrate load and osmolality on gastric emptying rate. In this respect, they compared drinks with markedly different osmolalities and caloric contents. Two concentrated drinks containing either 18.8% glucose (1300 mOsmol/kg) or 18.8% maltodextrins (237 msmol/kg) were consumed. The concentrated (188 g/L) maltodextrins emptied much faster (T1/2 = 64 + 8 min) than the corresponding concentrated isoenergetic glucose solution (HG, 1300 mosmol/kg, T1/2 = 130 + 18 min). The strong hyperosmolality induced by an equivalent amount of glucose but avoided by the use of maltodextrins appeared to have impacted significantly on gastric emptying rate. Recently, this area of research was reviewed by Shi and Passe 32. They concluded that water absorption in the human small intestine is influenced by osmolality, solute absorption, and the anatomical structures of gut segments 32.

Combining maltodextrins with a fructose supplying carbohydrate source may be beneficial when a high rate of carbohydrate supply is warranted. Shi et al 28 studied intestinal absorption of solutions containing either glucose or fructose combined with a glucose, either as free or directly transportable monosaccharides (glucose, fructose), bound as a disaccharide (sucrose), or as oligomers (maltodextrins). The authors showed that combining a glucose source with fructose resulted in better carbohydrate-water absorption rates, while using maltodextrins enabled osmolality to remain on the low side. The use of maltodextrins can play a significant role in this respect especially at carbohydrate concentration exceeding 40 g/l.

Sports Energy Drinks

Since there is a close relation between muscle fiber glycogen content and its ability to execute repeated high intensity contractions, either a reduced rate of glycogen breakdown or an increased glycogen content may help reduce fatigue and thus support performance capacity in field settings 33. Examining the effects of maltodextrins ingestion during exercise it was found that the ingestion of maltodextrin, like any other carbohydrate, decreases net glycogen breakdown during long-duration exercise while maintaining a high whole-body carbohydrate oxidation 34. Such responses appear to be similar for men and women 35.

One of the questions that has been answered recently concerned maximizing carbohydrate supply in periods of a high need, when absorption rate may be a limiting factor. It was shown that the synchronous intake of glucose + fructose favors a higher rate of carbohydrate absorption than glucose sources only. Accordingly, recent research has been done on the favorable ratio of glucose to fructose. Wallis et al. 36 studied the oxidation of combined ingestion of maltodextrins and fructose during exercise. They showed that with ingestion of substantial amounts of maltodextrin and fructose during cycling exercise, exogenous carbohydrate oxidation can reach peak values of approximately 1.5 g·min, and this is markedly higher than oxidation rates from ingesting maltodextrin alone.

Commercially available sports beverages generally consist of 6–10% concentrations of carbohydrates, of which high-glycaemic index (GI) carbohydrate sources such as maltodextrin are common constituents 37. Paradoxically, high-GI carbohydrates consumed within an hour of commencing a single bout of exercise may elicit rebound hypoglycemia 15–30 min into subsequent activity 38; a response for which the mechanisms, and performance consequences, are currently unclear 39. In a study aimed to examine the physiological and performance effects of high- and low-Glycemic Index (GI) carbohydrates consumed at two time-points before and during 120 min of simulated soccer-specific exercise 37. Blood glucose concentrations were better maintained throughout exercise and the magnitude of the exercise-induced rebound glycemic response was lowered in isomaltulose when compared to Maltodextrin. Furthermore, isomaltulose proved more effective in lowering the epinephrine response to prolonged exercise. Therefore, when limited opportunities exist to consume fluids during exercise, the consumption of low-GI isomaltulose before soccer-specific exercise may offer an alternative to the use of high-GI carbohydrates (e.g. maltodextrin) 37.

Sports Recovery Drinks

It has been shown that a combination of maltodextrins with protein and/or amino acids can promote enhanced glycogen recovery and stimulate muscle protein synthesis following an intense exercise protocol 40. Some observations suggest that effects on postexercise glycogen recovery and also muscle protein synthesis can be enhanced when a combination of different carbohydrates and protein is used 41. This observation is often used by the sports nutrition industry to promote carbohydrate–protein mixes for improving muscle strength, muscle power, and sports performance. However, results of studies into the effects of maltodextrins + protein on postglycogen recovery are mixed, with some showing positive effects and some showing no effect 42.

Applications Related to Oral Health

Frequent exposure of sugars to teeth is known to cause dental caries 43. This is a result of the fermentation of the sugars by microorganisms in dental plaque, leading to the formation of organic acids which in turn leads to the demineralization of enamel 44. Acid in drinks (as common in soft drinks and in juices) enhances this effect further 45.

For the last 10–15 years, food industry has increasingly been adding ‘new’ carbohydrates, such as maltodextrins and glucose syrups, to soft drinks instead of sucrose and fructose-glucose syrups 44. The effect of maltodextrins on oral health has been addressed in a number of studies 46. The general outcome of these studies has been first that maltodextrins are less potent in increasing acidity in the oral cavity compared to sucrose, and further that the rate of fermentation and acid formation increases with increasing dextrose equvalence. Al-Khatib et al 46 investigated the effect of three different maltodextrins on the pH of dental plaque in vivo in 10 adult volunteers using the plaque harvesting method. The three maltodextrins tested in this study were dextrose equvalent = 5.5, 14.0, and 18.5, made up as 10% solutions. Three commercially available maltodextrin-containing children’s drinks were also evaluated for their acidogenicity. 10% sucrose and 10% sorbitol solutions were used as positive and negative controls, respectively. The minimum pH achieved for dextrose equvalent = 5.5, 14.0, and 18.5 were 5.83 ± 0.30, 5.67 ± 0.24, and 5.71 ± 0.29, respectively, and were significantly higher compared with that for 10% sucrose (5.33 ± 0.17). The area under the curve was the least for dextrose equvalent = 5.5 (12.03 ± 4.64), followed by dextrose equvalent = 18.5 (13.13 ± 8.87) and dextrose equvalent = 14.0 (17.35 ± 6.43), but were all significantly smaller as compared with 10% sucrose (24.50 ± 8.64). It was concluded that, although a 10% maltodextrins solution was significantly less acidogenic than a 10% sucrose solution, both solution were impacting on tooth enamel.

Applications as Fat Replacer

Maltodextrins can be used as fat replacers due to their ability to form smooth, fat-like gels and their relatively high viscosity (depending on dextrose equvalent/the average number of monosaccharide units per molecule). Possible food categories for fat replacement via maltodextrins are low-fat salad dressings, spreads, margarines and butters, mayonnaise, and dairy products 47. Exchanging fat for maltodextrins, on a w/w basis, will reduce the energy content of the food, as maltodextrins contain less energy/g (resp. 16kJ vs. 38kJ). In this respect, it should be noted, however, that a replacement for fat will not necessarily lead to a reduction of food/energy intake 48.

One of the most important differences between maltodextrins and fats is the hydrophilic behavior of maltodextrins versus the lipophilic behavior of fats, properties that may affect the solubility of flavors and other compounds in a product. Recent findings suggest that the use of maltodextrins in high-energetic food products may help reduce the fat content up to 50%, thus reducing energy density without altering important properties and characteristics of these products 18. In practice, maltodextrins do not mimic all sensory properties of fat, making its use as fat replacer complex 18. Next to their fat-mimicking ability, research has shown that an additional benefit of the use of maltodextrins is their inhibition of the release of volatile odor compounds, making them, for example, suitable as fat-replacers in low-fat meat products 49.

Applications Related to Appetite Control

There is a strong correlation between the macronutrient composition of foods and differences in the way and intensity that foods induce satiety. In order of satiating potential the macronutrients are generally classified as follows: protein > carbohydrate > fat 50.

Maltodextrins, as a source of glucose, are suggested to enhance feelings of satiety. To test this hypothesis, Yeomans et al. 51 investigated the effects of consuming a soup with added maltodextrins on food intake, rated hunger, and fullness in 24 male volunteers. The soup was tested relative to a non-maltodextrin control soup, which was matched for sensory properties. Soup preloads were consumed 30 minutes before lunch and condition-order counterbalanced. Interestingly, the food intake at lunch was reduced significantly by 77 g (407 kJ) after the maltodextrin preload, and this reduced intake was associated with a significant reduction in eating rate but not in meal duration. Hunger ratings were significantly lower and fullness ratings significantly higher during the start of the meal after the maltodextrin preload when compared with the control 51. These results imply that the maltodextrin meal preloads can result in a reduced desire to eat, by mechanisms which remain to be clarified 52. However, several studies and a recent critical analysis of the literature revealed that the methodological set-up of satiety studies, using liquid meal pre-loads, has a significant influence on the outcomes of the studies 53. Accordingly, there is a lot of debate on the meaning of pre-load study results in relation to real life conditions.

Is maltodextrin bad?

In recent years, concerns have been raised about the increased use of refined carbohydrates, including isolated starches and maltodextrins, in food and beverage and its relation to increased obesity rates 54. One of the main reasons for concern is that, depending on the quantity consumed, refined carbohydrate sources can have a strong impact on the post-ingestion blood glucose, insulin, and lipid levels. Discernible changes in these markers have been linked to potential health risks, especially in vulnerable individuals such as diabetic patients 55. There is also report of maltodextrins in beer may be responsible for the phenomenon known as beer belly 56. In a rat experiment 57, ad libitum access (unlimited access) to maltodextrin produced at least as rapid weight gain as sucrose (sugar) and in rat experiment #2 a study to compare the impact of 10% sucrose with that of maltodextrin, retroperitoneal fat mass was greater in the two carbohydrate groups than in the control group (a control group maintained on standard chow and water alone). Moreover, in Experiment #3, impaired performance on a location recognition task was also found in both carbohydrate groups (sucrose and maltodextrin) after only 17 days on the diets. These results indicate that the harmful effects of excess sucrose consumption can also be produced by maltodextrin, another rapidly absorbed carbohydrate that does not contain fructose 57.

In the United States, maltodextrins are regulated under the Food and Drug Administration’s (FDA’s) Code of Federal Regulations (CFR) as a GRAS substance, meaning it is Generally Recognized As Safe 58 for use as an ingredient and a dietary fiber in milk and milk products; meat, poultry, fish and mixtures; dry beans, peas, other legumes, nuts and seeds; grain products; fruits and fruit products; vegetable products; fats, oils, and salad dressings, sugars, sweets, and beverages at levels ranging from 3.2 to 6.3 grams per serving.

The digestive end product of maltodextrins is glucose and glucose participates in many basic metabolic processes in your body. Maltodextrins are considered to be a good source of energy since glucose obtained from its digestion is readily absorbed in the small intestine and subsequently used in metabolism 59.

The rise in consumption of refined carbohydrate sources has been linked to an increased health risk 60. Although no causal relationship between the consumption of maltodextrins and negative health effects has been reported 61, this does not mean that overconsumption of foods containing maltodextrins will have no effect. The regular intake of calorie dense, low-fiber/protein foods or drinks with high levels of refined added carbohydrates, in particular soft drinks and sweet snacks, may easily induce a persistent positive energy balance resulting in weight gain, impaired insulin sensitivity as well as increased blood cholesterol and blood lipids 62, 63. Accordingly, consumers should consume in moderation and food and beverage producers should reduce the energy density of food and beverage while taking care for an appropriate nutrient, fiber, and protein level where possible.

References
  1. Takeiti C., Kieckbusch T., Collares-Queiroz F. Morphological and physicochemical characterization of commercial maltodextrins with different degrees of dextrose-equivalent. Int. J. Food Propert. 2010:411–425.
  2. BeMiller J. N., Whistler R. L. Starch: Chemistry and Technology. London: Academic Press; 2009.
  3. The wars of the carbohydrates, part 6: what a name! Whelan WJ. IUBMB Life. 2008 Aug; 60(8):555-6. https://www.ncbi.nlm.nih.gov/pubmed/18543287/
  4. Physiological and metabolic properties of a digestion-resistant maltodextrin, classified as type 3 retrograded resistant starch. Brouns F, Arrigoni E, Langkilde AM, Verkooijen I, Fässler C, Andersson H, Kettlitz B, van Nieuwenhoven M, Philipsson H, Amado R. J Agric Food Chem. 2007 Feb 21; 55(4):1574-81. https://www.ncbi.nlm.nih.gov/pubmed/17253707/
  5. EC Regulation (EC) No 1169/2011 of the European Parliament and of the council of 25 October 2011 on the provision of food information to consumers. Off. J. Eur. Union. 2011:18–63.
  6. Altschul A. M. Low-calorie foods—a scientific status summary by the Institute of Food Technologists’ expert panel of food safety and nutrition. Food Techno. 1989:113.
  7. Stephen M. S., Philips G. O., Williams P. A. Food Polysaccharides and Their Applications. CRC Press; Boca Raton: 2006
  8. Coultate T. Food: The Chemistry of its Components. 2009
  9. On the molecular characteristics, compositional properties, and structural-functional mechanisms of maltodextrins: a review. Chronakis IS. Crit Rev Food Sci Nutr. 1998 Oct; 38(7):599-637.
  10. Fetzer W., Crosby E., Engel C., Kirst L. Effect of acid and heat on dextrose and dextrose polymers. Ind. Eng. Chem. 1953:1075–1083.
  11. Takeiti C., Kieckbusch T., Collares-Queiroz F. Morphological and physicochemical characterization of commercial maltodextrins with different degrees of dextrose-equivalent. Int. J. Food Propert. 2010:411–425
  12. Stevenson EJ, Watson A, Theis S, Holz A, Harper LD, Russell M. A comparison of isomaltulose versus maltodextrin ingestion during soccer-specific exercise. European Journal of Applied Physiology. 2017;117(11):2321-2333. doi:10.1007/s00421-017-3719-5. https://www.ncbi.nlm.nih.gov/pmc/articles/PMC5700989/
  13. Forbes L.E., Storey K.E., Fraser S.N., Spence J.C., Plotnikoff R.C., Raine K.D., Hanning R.M., McCargar L.J. Dietary patterns associated with glycemic index and glycemic load among Alberta adolescents. Appl. Physiol. Nutr. Metab. 2009;34:648–658. doi: 10.1139/H09-051
  14. Atkinson F.S., Foster-Powell K., Brand-Miller J.C. International tables of glycemic index and glycemic load values: 2008. Diabetes Care. 2008;31:2281–2283. doi: 10.2337/dc08-1239
  15. Salmeron J., Manson J.E., Stampfer M.J., Colditz G.A., Wing A.L., Willett W.C. Dietary fiber, glycemic load, and risk of non-insulin-dependent diabetes mellitus in women. JAMA. 1997;277:472–477. doi: 10.1001/jama.1997.03540300040031
  16. Sources of Gluten. Celiac Disease Foundation. https://celiac.org/live-gluten-free/glutenfreediet/sources-of-gluten/
  17. O’Brien-Nabors L. Alternative Sweeteners. Boca Raton, Florida, USA: CRC Press; 2011.
  18. Hadnađev M., Dokić L., Hadnađev T. D., Pajin B., Krstonošić V. The impact of maltodextrin-based fat mimetics on rheological and textural characteristics of edible vegetable fat. J. Texture Stud. 2011:404–411.
  19. Urashima T., Fukuda K., Messer M. Evolution of milk oligosaccharides and lactose: a hypothesis. Animal. 2011:369.
  20. Siddiqui Z., Osayande A. S. Selected disorders of malabsorption. Primary Care. 2011:395–414. vii.
  21. Maldonado J., Gil A., Narbona E., Molina J. A. Special formulas in infant nutrition: a review. Early Hum. Dev. 1998;(Supplement 1):S23–S32.
  22. Gregorio G. V., Gonzales M. L. M., Dans L. F., Martinez E. G. Cochrane review: Polymer-based oral rehydration solution for treating acute watery diarrhoea. Evid. Based Child Health: A Cochrane Rev. J. 2010:1612–1675.
  23. Cabre E., Gonzalez-Huix F., Abad-Lacruz A., Esteve M., Acero D., Fernandez-Bañares F., Xiol X., Gassull M. A. Effect of total enteral nutrition on the short-term outcome of severely malnourished cirrhotics. A randomized controlled trial. Gastroenterology. 1990:715–720.
  24. Pexe-Machado P. A., de Oliveira B. D., Dock-Nascimento D. B., de Aguilar-Nascimento J. E. Shrinking preoperative fast time with maltodextrin and protein hydrolysate in gastrointestinal resections due to cancer. Nutrition. 2013:1054–1059.
  25. Dock-Nascimento D. B., de Aguilar-Nascimento J. E., Faria M. S. M., Caporossi C., Slhessarenko N., Waitzberg D. L. Evaluation of the effects of a preoperative 2-hour fast with maltodextrine and glutamine on insulin resistance, acute-phase response, nitrogen balance, and serum glutathione after laparoscopic cholecystectomy a controlled randomized trial. J. Parent. Enteral Nutr. 2012:43–52.
  26. Sandhu B. K., Jones B., Brook C., Silk D. Oral rehydration in acute infantile diarrhoea with a glucose-polymer electrolyte solution. Arch. Disease Childhood. 1982:152–154.
  27. Marchal L. M. 1999Towards a rational design of commercial maltodextrins: a mechanistic approach Trends in Food Science & Technology 10
  28. Shi X., Summers R. W., Schedl H. P., Flanagan S. W., Chang R., Gisolfi C. V. Effects of carbohydrate type and concentration and solution osmolality on water absorption. Med. Sci. Sports Exer. 1995:1607.
  29. El-Mougi M., Hendawi A., Koura H., Hegazi E., Fontaine O., Pierce N. Efficacy of standard glucose-based and reduced-osmolarity maltodextrin-based oral rehydration solutions: effect of sugar malabsorption. Bull. World Health Org. 1996:471.
  30. Vist G. E., Maughan R. J. The effect of osmolality and carbohydrate content on the rate of gastric emptying of liquids in man. J. Physiol. 1995:523–531.
  31. Delzenne N., Blundell J., Brouns F., Cunningham K., De Graaf K., Erkner A., Lluch A., Mars M., Peters H., Westerterp-Plantenga M. Gastrointestinal targets of appetite regulation in humans. Obes. Rev. 2010:234–250.
  32. Shi X., Passe D. H. Water and solute absorption from carbohydrate-electrolyte solutions in the human proximal small intestine: a review and statistical analysis. Int. J. Sport Nutr. Exer. Metabol. 2010:427–442.
  33. Brouns F. Essentials of Sports Nutrition. West-Sussex, UK: Wiley; 2003.
  34. Harger-Domitrovich S. G., McClaughry A. E., Gaskill S. E., Ruby B. C. Exogenous carbohydrate spares muscle glycogen in men and women during 10 h of exercise. Med. Sci. Sports Exer. 2007:2171.
  35. Wallis G. A., Dawson R., Achten J., Webber J., Jeukendrup A. E. Metabolic response to carbohydrate ingestion during exercise in males and females. American J. Physiol.-Endocrinol. Metabol. 2006:E708–E715.
  36. Wallis G. A., Rowlands D. S., Shaw C., Jentjens R., Jeukendrup A. E. Oxidation of combined ingestion of maltodextrins and fructose during exercise. Med. Sci. Sports Exerc. 2005:426–432.
  37. Stevenson EJ, Watson A, Theis S, Holz A, Harper LD, Russell M. A comparison of isomaltulose versus maltodextrin ingestion during soccer-specific exercise. European Journal of Applied Physiology. 2017;117(11):2321-2333. doi:10.1007/s00421-017-3719-5 https://www.ncbi.nlm.nih.gov/pmc/articles/PMC5700989/
  38. The influence of pre-exercise glucose ingestion on endurance running capacity. Chryssanthopoulos C, Hennessy LC, Williams C. Br J Sports Med. 1994 Jun; 28(2):105-9. https://www.ncbi.nlm.nih.gov/pmc/articles/PMC1332041/pdf/brjsmed00014-0035.pdf
  39. Effects of pre-exercise ingestion of trehalose, galactose and glucose on subsequent metabolism and cycling performance. Jentjens RL, Jeukendrup AE. Eur J Appl Physiol. 2003 Jan; 88(4-5):459-65. https://www.ncbi.nlm.nih.gov/pubmed/12527978/
  40. Kerksick C., Harvey T., Stout J., Campbell B., Wilborn C., Kreider R., Kalman D., Ziegenfuss T., Lopez H., Landis10 J. International Society of Sports Nutrition position stand: Nutrient timing. J. Int. Soc. Sports Nutr. 2008:17.
  41. Nakhostin-Roohi B., Khorshidi M. The effect of glutamine and maltodextrin acute supplementation on anaerobic power. Asian J. Sports Med. 2013
  42. Coletta A., Thompson D. L., Raynor H. A. The influence of commercially-available carbohydrate and carbohydrate-protein supplements on endurance running performance in recreational athletes during a field trial. J. Int. Soc. Sports Nutr. 2013:17.
  43. Anderson C., Curzon M., Van Loveren C., Tatsi C., Duggal M. Sucrose and dental caries: a review of the evidence. Obes. Rev. 2009:41–54.
  44. Tahmassebi J. F., Duggal M. S., Malik-Kotru G., Curzon M. E. Soft drinks and dental health: a review of the current literature. J. Dent. 2006:2–11.
  45. Cheng R., Yang H., Shao M., Hu T., Zhou X. Dental erosion and severe tooth decay related to soft drinks: a case report and literature review. J. Zhejiang Univ. Sci. B. 2009:395–399.
  46. Al-Khatib G. R., Duggal M. S., Toumba K. J. An evaluation of the acidogenic potential of maltodextrins in vivo. J. Dent. 2001:409–414.
  47. Sajilata M., Singhal R. S. Specialty starches for snack foods. Carbohydr. Polym. 2005:131–151.
  48. Stubbs J., Ferres S., Horgan G. Energy density of foods: effects on energy intake. Crit. Rev. Food Sci. Nutr. 2000:481–515
  49. Junsi M., Usawakesmanee W., Siripongvutikorn S. Effect of using starch on off-odors retention in tuna dark meat. Int. Food Res. J. 2012:709–714.
  50. Klaauw A. A., Keogh J. M., Henning E., Trowse V. M., Dhillo W. S., Ghatei M. A., Farooqi I. S. High protein intake stimulates postprandial GLP1 and PYY release. Obesity21(8):1602–1607 2013
  51. Yeomans M. R., Gray R. W., Conyers T. H. B. Maltodextrin preloads reduce food intake without altering the appetiser effect. Physiol. Behav. 1998:501–506.
  52. Booth D. A. Learnt reduction in the size of a meal. Measurement of the sensory-gastric inhibition from conditioned satiety. Appetite. 2009:745–749.
  53. Allison D. B. Liquid calories, energy compensation and weight: what we know and what we still need to learn. Brit. J. Nutr. 2013 111(3):384–386.
  54. Prevalence of obesity and trends in body mass index among US children and adolescents, 1999-2010. Ogden CL, Carroll MD, Kit BK, Flegal KM. JAMA. 2012 Feb 1; 307(5):483-90. https://jamanetwork.com/journals/jama/fullarticle/1104932
  55. Parker K., Salas M., Nwosu V. C. High fructose corn syrup: Production, uses and public health concerns. Biotechnol. Mol. Biol. Rev. 2010:71–78.
  56. Whelan, W. J. ( 2004) The wars of the carbohydrates, Part 3: Maltose. IUBMB Life 56, 641. https://doi.org/10.1080/15216540400022458
  57. Maltodextrin can produce similar metabolic and cognitive effects to those of sucrose in the rat. Appetite Volume 77, 1 June 2014, Pages 1-12. https://doi.org/10.1016/j.appet.2014.02.011
  58. GRAS Notices. https://www.accessdata.fda.gov/scripts/fdcc/index.cfm?set=GRASNotices&id=610
  59. Effect of total enteral nutrition on the short-term outcome of severely malnourished cirrhotics. A randomized controlled trial. Cabre E, Gonzalez-Huix F, Abad-Lacruz A, Esteve M, Acero D, Fernandez-Bañares F, Xiol X, Gassull MA. Gastroenterology. 1990 Mar; 98(3):715-20.
  60. Caloric sweetener consumption and dyslipidemia among US adults. Welsh JA, Sharma A, Abramson JL, Vaccarino V, Gillespie C, Vos MB. JAMA. 2010 Apr 21; 303(15):1490-7 https://www.ncbi.nlm.nih.gov/pmc/articles/PMC3045262/
  61. Hofman DL, van Buul VJ, Brouns FJPH. Nutrition, Health, and Regulatory Aspects of Digestible Maltodextrins. Critical Reviews in Food Science and Nutrition. 2016;56(12):2091-2100. doi:10.1080/10408398.2014.940415. https://www.ncbi.nlm.nih.gov/pmc/articles/PMC4940893/
  62. Fructose-induced hyperuricemia is associated with a decreased renal uric acid excretion in humans. Lecoultre V, Egli L, Theytaz F, Despland C, Schneiter P, Tappy L. Diabetes Care. 2013 Sep; 36(9):e149-50. https://www.ncbi.nlm.nih.gov/pmc/articles/PMC3747900/
  63. Public health: The toxic truth about sugar. Lustig RH, Schmidt LA, Brindis CD. Nature. 2012 Feb 1; 482(7383):27-9. https://www.ncbi.nlm.nih.gov/pubmed/22297952/
read more
Food Additives

Maltose

maltose sugar

What is maltose

Maltose or malt sugar is the least common disaccharide that is derived from hydrolysis by enzymes (α-amylase and β-amylase) of starch in nature. Maltose is present in germinating grain, in a small proportion in corn syrup, and forms on the partial hydrolysis of starch. Maltose has a sweet taste, but is only about 30-60% as sweet as sugar, depending on the concentration 1. A 10% solution of maltose is 35% as sweet as sucrose (table sugar) 2. Maltose is used as a sweetening agent and fermentable intermediate in brewing. There is no specific dietary requirements exist for maltose.

Maltose is a disaccharide formed from two units of glucose joined together with an glycosidic bond (see Figure 1 below). Maltose is broken down by the maltase enzyme, which catalyses the hydrolysis of the glycosidic bond, into two glucose molecules. Maltose is a reducing sugar 3 because the ring of one of the two glucose units can open to present a free aldehyde group; the other one cannot because of the nature of the glycosidic bond. The results of this study 4 indicate that the utilization of circulating maltose elicits similar metabolic effects as glucose. The change in serum maltose after infusion was not accompanied by a significant elevation of glucose, suggesting that extracellular hydrolysis of maltose to glucose is minimal. Since human serum contains almost no maltose activity 5, it is conceivable that maltose enters tissue cells intact and is subsequently metabolized.

Beer is made from four basic building blocks: water, malted barley, and hops. Malting is a process of bringing grain to the point of its highest possible starch content by allowing it to begin to sprout roots and take the first step to becoming a photosynthesizing plant. At the point when the maximum starch content is reached, the seed growth is stopped by heating the grain to a temperature that stops growth but allows an important natural enzyme diastase to remain active. Barley, once “malted” is very high in the type of starches that an enzyme called diastase (found naturally on the surface of the grain, just under the husk) can convert starch quite easily into the disaccharide called maltose. Maltose sugar is then fermented or metabolized by the yeasts to create carbon dioxide and ethyl alcohol.

In humans, maltose is broken down by various maltase enzymes, providing two glucose molecules which can be further processed: either broken down to provide energy, or stored as glycogen. The lack of the sucrase-isomaltase enzyme in humans causes sucrose intolerance, but because there are four different maltase enzymes, complete maltose intolerance is extremely rare 6.

Congenital sucrase-isomaltase deficiency is a disorder that affects a person’s ability to digest certain sugars and it is characterized by the deficiency or absence of the enzymes sucrase and isomaltase. People with with congenital sucrase-isomaltase deficiency cannot break down the sugars sucrose and maltose and other compounds made from these sugar molecules (carbohydrates). Congenital sucrase-isomaltase deficiency usually becomes apparent after an infant is weaned and starts to consume fruits, juices, and grains. After ingestion of sucrose or maltose, an affected child will typically experience stomach cramps, bloating, excess gas production, and diarrhea. These digestive problems can lead to failure to gain weight and grow at the expected rate (failure to thrive) and malnutrition. Most affected children are better able to tolerate sucrose and maltose as they get older. The prevalence of congenital sucrase-isomaltase deficiency is estimated to be 1 in 5,000 people of European descent. This condition is much more prevalent in the native populations of Greenland, Alaska, and Canada, where as many as 1 in 20 people may be affected.

Affected infants develop symptoms soon after they first ingest sucrose, as found in modified milk formulas, fruits, or starches. Symptoms may include explosive, watery diarrhea resulting in abnormally low levels of body fluids (dehydration), abdominal swelling (distension), and/or abdominal discomfort. In addition, some affected infants may experience malnutrition, resulting from malabsorption of essential nutrients, and/or a delay in growth and weight gain (failure to thrive), resulting from nutritional deficiencies. In some cases, individuals may exhibit irritability; colic; abrasion and/or irritation (excoriation) of the skin on the buttocks as a result of prolonged diarrhea episodes; and/or vomiting. Symptoms of this disorder vary among affected individuals. Symptoms are usually more severe in infants and young children than in adults.

Symptoms of congenital sucrase-isomaltase deficiency may be absent in an affected infant who is breast-fed or who is on a lactose-only formula; however, as soon as sucrose is introduced into the diet through fruit juices, solid food, medications, and/or other sources, symptoms may rapidly develop. Intolerance to starch may disappear within the first few months or years of life while sucrose intolerance, responsible for most of the symptoms of this disorder, often improves as the affected child ages, exhibiting only occasional or mild symptoms in adulthood. In some cases, symptoms may not be manifested until the onset of puberty.

Symptoms exhibited in infants and young children are usually more pronounced than those of the affected adults because the diet of younger individuals often includes a higher carbohydrate intake. In addition, the time it takes for intestinal digestion is less in infants or young children. In some cases, the development of kidney stones (renal calculi) may be associated with congenital sucrase-isomaltase deficiency.

Treatment of congenital sucrase-isomaltase deficiency focuses on dietary management through a low-sucrose or sucrose-free diet. In addition, a low-starch or starch-free diet is advised in some cases, especially in the first few years of life. Some affected individuals may show signs of sucrose tolerance during the second decade of life, but many others may exhibit a life-long sucrose intolerance. Individuals affected with this disorder may benefit from ingesting fresh baker’s yeast, which exhibits sucrase activity, after sucrose ingestion. Researchers suggest that the yeast be taken on a full stomach as sucrase activity is much more effective when the gastric juices are diluted.

The orphan drug sacrosidase oral solution (Sucraid) has been approved by the FDA for the treatment of congenital sucrose isomaltose malabsorption. This oral solution is an enzyme replacement therapy that contains the enzyme sucrase (sacrosidase), obtained from baker’s yeast and glycerin. Sucraid has been found to relieve many of the symptoms associated with sucrose ingestion by individuals with this disorder. Sacrosidase oral solution is manufactured by QOL Medical, LLC.

Genetic counseling is recommended for affected individuals and their families. Other treatment is symptomatic and supportive. For example, fluid and electrolyte replacement after episodes of diarrhea may be indicated to stave off dehydration and/or other associated symptoms.

A team approach for infants with congenital sucrase-isomaltase deficiency may be of benefit and may include pediatricians, physicians who diagnose and treat disorders of the digestive tract (gastroenterologists), specialists who will assess and plan a diet that best achieves proper growth and development (nutritionists), special social support, and other medical services.

Figure 1. Maltose

maltoseFigure 2. Maltose sugar

maltose sugar

Is maltose a monosaccharide?

No. Maltose is a disaccharide formed from two units of glucose joined together with an glycosidic bond.

Is maltose a reducing sugar?

Yes, Maltose is a reducing sugar 3 because the ring of one of the two glucose units can open to present a free aldehyde group; the other one cannot because of the nature of the glycosidic bond.

Where is maltose found?

Maltose is a component of malt, a substance which is obtained in the process of allowing grain to soften in water and germinate. It is also present in highly variable quantities in partially hydrolysed starch products like maltodextrin, corn syrup and acid-thinned starch.

Not many traditional foods are naturally high in maltose. When starchy foods such as cereal grains, corn, potatoes, legumes, nuts and some fruits and vegetables are digested, maltose results. When you cook these foods, the maltose content increases. For example, raw sweet potatoes don’t have any maltose, but cooked sweet potatoes contain approximately 11 grams of maltose per cup. Maltose is also found in molasses, which is a sweet product that gives a distinct flavor to baked goods. There are also some malted beverages that are served as a hot chocolate-like product with milk, or as a malted milkshake.

Natural maltose foods (from highest maltose content to low)

  1. Sweet potato, cooked, baked in skin, with salt [Sweetpotato]. Maltose: 14590mg
  2. Sweet potato, cooked, boiled, without skin [Sweetpotato]. Maltose: 8791mg
  3. Sweet potato, cooked, boiled, without skin, with salt [Sweetpotato]. Maltose: 8791mg
  4. Sweet potato, cooked, baked in skin, without salt [Sweetpotato]. Maltose: 6933mg
  5. Prairie Turnips, boiled (Northern Plains Indians). Maltose: 5473mg
  6. Spelt, uncooked. Maltose: 3047mg
  7. Edamame, frozen, unprepared. Maltose: 2073mg
  8. Edamame, frozen, prepared. Maltose: 1557mg
  9. Broccoli, raw. Maltose: 1235mg
  10. Tomato products, canned, paste, with salt added. Maltose: 683mg
  11. Tomato products, canned, paste, without salt added. Maltose: 683mg
  12. Corn, sweet, yellow, cooked, boiled, drained, with salt. Maltose: 611mg
  13. Corn, sweet, yellow, cooked, boiled, drained, without salt. Maltose: 611mg
  14. Corn, sweet, yellow, canned, whole kernel, drained solids. Maltose: 543mg
  15. Corn, sweet, yellow, frozen, kernels, cut off cob, boiled, drained, with salt. Maltose: 430mg
  16. Corn, sweet, yellow, frozen, kernels on cob, cooked, boiled, drained, with salt. Maltose: 430mg
  17. Corn, sweet, yellow, frozen, kernels on cob, cooked, boiled, drained, without salt. Maltose: 430mg
  18. Peas, green, cooked, boiled, drained, with salt. Maltose: 429mg
  19. Peas, green, cooked, boiled, drained, without salt. Maltose: 429mg
  20. Corn, sweet, yellow, frozen, kernels on cob, unprepared. Maltose: 428mg
  21. Corn, sweet, yellow, frozen, kernels cut off cob, boiled, drained, without salt. Maltose: 420mg
  22. Peas, green, raw. Maltose: 420mg
  23. Corn, sweet, yellow, raw. Maltose: 419mg
  24. Corn, sweet, yellow, frozen, kernels cut off cob, unprepared. Maltose: 386mg
  25. Corn, sweet, yellow, canned, vacuum pack, no salt added. Maltose: 329mg
  26. Corn, sweet, yellow, canned, vacuum pack, regular pack. Maltose: 329mg
  27. Corn, sweet, yellow, canned, brine pack, regular pack, solids and liquids. Maltose: 313mg
  28. Corn, sweet, yellow, canned, no salt added, solids and liquids. Maltose: 313mg
  29. Corn, sweet, yellow, canned, cream style, no salt added. Maltose: 306mg
  30. Corn, sweet, yellow, canned, cream style, regular pack. Maltose: 306mg
  31. Potatoes, mashed, dehydrated, flakes without milk, dry form. Maltose: 282mg
  32. Peas, green, canned, no salt added, solids and liquids. Maltose: 264mg
  33. Peas, green, canned, regular pack, solids and liquids. Maltose: 264mg
  34. Peas, green, canned, no salt added, drained solids. Maltose: 261mg
  35. Peas, green, frozen, cooked, boiled, drained, with salt. Maltose: 256mg
  36. Peas, green, frozen, cooked, boiled, drained, without salt. Maltose: 256mg
  37. Peas, green, frozen, unprepared. Maltose: 208mg
  38. Cucumber, with peel, raw. Maltose: 133mg
  39. Potatoes, mashed, dehydrated, prepared from flakes without milk, whole milk and butter added. Maltose: 124mg
  40. Peas, green (includes baby and lesuer types), canned, drained soilds, unprepared. Maltose: 116mg
  41. Cabbage, raw. Maltose: 80mg
  42. Spinach souffle. Maltose: 35mg
  43. Potato pancakes. Maltose: 22mg
References
  1. Belitz, H.-D.; Grosch, Werner; Schieberle, Peter (2009-01-15). Food Chemistry. Springer Science & Business Media. p. 863. ISBN 9783540699330
  2. Spillane, W. J. (2006-07-17). Optimizing Sweet Taste in Foods. Woodhead Publishing. p. 271. ISBN 9781845691646.
  3. Fruton, Joseph S (1999). Proteins, Enzymes, Genes: The Interplay of Chemistry and Biology. Chelsea, Michigan: Yale University Press. p. 144. ISBN 0300153597
  4. The Metabolism of Circulating Maltose in Man. The Journal of Clinical Investigation Volume 50, 1971. https://www.ncbi.nlm.nih.gov/pmc/articles/PMC292018/pdf/jcinvest00194-0034.pdf
  5. Weser, E., and M. H. Sleisenger. 1967. Metabolism of circulating disaccharides in man and the rat. J. Clin. Invest. 46: 499.
  6. Whelan, W. J.; Cameron, Margaret P. (2009-09-16). Control of Glycogen Metabolism. John Wiley & Sons. p. 60. ISBN 9780470716885.
read more
Food Additives

Titanium dioxide

titanium dioxide

What is titanium dioxide

Titanium dioxide (TiO2) can also be called titanium oxide or titania. Titanium (Ti) is the ninth most abundant element in the earth’s crust and Titanium never appears in a metallic state in nature. Titanium dioxide (TiO2), an odorless powder with a molecular weight of 79.9 g/mol, also known as Ti(IV) oxide, constitutes the naturally occurring oxide 1. Titanium dioxide minerals contain impurities such as iron, chromium, vanadium or zirconium that confer a spectrum of different colors. Manufactured titanium dioxide is, instead, a white powder commonly used as a pigment in ceramics, paints, coatings, plastics and paper due to its high refractive index. Pure titanium dioxide assembles in three crystal structures, i.e., anatase, rutile (with tetragonal coordination of Ti atoms) and brookite (with rhombohedral coordination of Ti atoms), but only anatase/rutile or mixtures of these two polymorphs are employed in food 2.

Food-grade titanium dioxide (TiO2) is manufactured from titanium minerals by either a sulfuric acid-based process, which can yield anatase, rutile or a mixture of both polymorphs depending on the reaction conditions, or a chlorine-based process yielding only the rutile form 3. Specifications for food use include a minimum purity of 99.0%, thus allowing some contamination with arsenic, cadmium and mercury (up to 1 mg/kg), antimony (up to 2 mg/kg) or lead (up to 10 mg/kg) 3. Also, food-grade titanium dioxide (TiO2) may be coated with a small proportion (no more than 2% in total) of alumina and silica to enhance technological properties, for example to improve dispersion in host matrices 4. All titanium dioxide particles are insoluble in water, organic solvents, hydrochloric acid and dilute sulfuric acid. They are highly stable to heat and remain unaffected by food processing. Also, titanium dioxide particles are not or only minimally degraded or dissolved under conditions, including low pH, which mimic the gastrointestinal milieu. Such indigestible particles, once released from the food matrix during their gastrointestinal transit, reach the intestinal mucosa raising the question of whether they might be prone to absorption and systemic distribution.

Titanium dioxide (TiO2) is a food color authorized as a food additive in the European Union (E 171). It was previously evaluated by the Scientific Committee on Food in 1975 and 1977, by the Joint FAO/WHO Expert Committee of Food Additives (JECFA) in 1969 5. The food additive titanium dioxide (E 171) is a white to slightly colored powder and it is insoluble in water and in organic solvents 5.

Key facts

  • Titanium dioxide (E 171) as a food additive is safe 5
  • Although titanium dioxide is generally regarded as a nontoxic mild lung irritant, some laboratory studies have reported lung adenomas in rats exposed to high levels of titanium dioxide. Limited data on health effects among humans exist. The International Agency for Research on Cancer 6 concluded that there is inadequate evidence from epidemiological studies to assess whether titanium dioxide dust causes cancer in humans, but that there is sufficient evidence for carcinogenicity in experimental animals, based on the induction of respiratory tract tumors in rats after prolonged titanium dioxide (TiO2) inhalation. Therefore, International Agency for Research on Cancer classified titanium dioxide as a Group 2B carcinogen 7.

The European Food Safety Authority Panel noted that, according to the data provided by interested parties and from the literature, titanium dioxide (E 171) as a food additive would not be considered as a nanomaterial according to the European Union Recommendation on the definition of a nanomaterial (i.e. ‘a natural, incidental or manufactured material containing particles, in an unbound state or as an aggregate or as an agglomerate and where, for 50% or more of the particles in the number size distribution, one or more external dimensions is in the size range 1–100 nano meter’).

Figure 1. Titanium dioxide

titanium dioxide

The European Food Safety Authority Panel was aware of the extensive database on titanium dioxide nanomaterials, however, most of these data were not considered relevant to the evaluation of titanium dioxide as the food additive (E 171). Therefore, the European Food Safety Authority Panel considered the titanium dioxide nanomaterials data could not be directly applied to the evaluation of titanium dioxide as food additive 5.

From the available data on absorption, distribution and excretion, the European Food Safety Authority Panel concluded that 5:

  • the absorption of orally administered titanium dioxide is extremely low;
  • the bioavailability of titanium dioxide (measured either as particles or as titanium) is low;
  • the bioavailability measured as titanium appeared to be independent of particle size;
  • the vast majority of an oral dose of titanium dioxide is eliminated unchanged in the feces;
  • a small amount (maximum of 0.1%) of orally ingested titanium dioxide was absorbed by the gut‐associated lymphoid tissue (GALT) and subsequently distributed to various organs and elimination rates from these organs were variable.

The European Food Safety Authority Panel further concluded that there were significant and highly variable background levels of titanium in animals and humans, which presented challenges in the analysis at the low levels of titanium uptake reported and could complicate interpretation of the reported findings.

The European Food Safety Authority Panel concluded that, based on the available genotoxicity database and the European Food Safety Authority Panel’s evaluation of the data on absorption, distribution and excretion of micro‐ and nanosized titanium dioxide particles, orally ingested titanium dioxide particles (micro‐ and nanosized) are unlikely to represent a genotoxic hazard in vivo.

The European Food Safety Authority Panel noted that possible adverse effects in the reproductive system were identified in some studies conducted with material which was either non‐food‐grade or inadequately characterized nanomaterial (i.e. not E 171). There were no such indications in the available, albeit limited, database on reproductive endpoints for the food additive (E 171). The European Food Safety Authority Panel was unable to reach a definitive conclusion on this endpoint due to the lack of an extended 90‐day study as in the submission of food additives 8 or a multigeneration or extended‐one generation reproduction toxicity study with the food additive (E 171). Therefore, the European Food Safety Authority Panel did not establish an acceptable daily intake (ADI). Acceptable daily intake (ADI) is a measure of the amount of a specific substance (originally applied for a food additive, later also for a residue of a veterinary drug or pesticide) in food or drinking water that can be ingested orally on a daily basis over a lifetime without an appreciable health risk 9.

From a carcinogenicity study with titanium dioxide in mice and in rats, the European Food Safety Authority Panel chose the lowest no observable adverse effect level (NOAEL) reported which was 2,250 mg titanium dioxide/kg body weight per day for males from the rat study, the highest dose tested in this species and sex.

For the safety assessment of titanium dioxide used as a food additive, based on information reported in the examined literature and information supplied following calls for data taking into account the following considerations:

  • the food additive E 171 mainly consists of microsized titanium dioxide particles, with a nanosized (< 100 nm) fraction less than 3.2% by mass;
  • the absorption of orally administered titanium dioxide particles (micro‐ and nanosized) in the gastrointestinal tract is negligible, estimated at most as 0.02–0.1% of the administered dose;
  • no difference is observed in the absorption, distribution and excretion of orally administered micro‐ and nanosized titanium dioxide particles;
  • no adverse effect resulting from the eventual accumulation of the absorbed particles is expected based on the results of long‐term studies which did not highlight any toxicity up to the highest administered dose;
  • the uncertainties in the toxicological database arising from limitations in the available reproductive toxicity studies;

The European Food Safety Authority Panel considered that an acceptable daily intake (ADI) should not be established, and that a margin of safety approach would be appropriate 8.

To assess the dietary exposure to titanium dioxide (E 171) from its use as a food additive, the exposure was calculated based on: maximum levels of data provided to European Food Safety Authority (defined as the maximum level exposure assessment scenario) and reported use levels (defined as the refined exposure assessment scenario) as provided by industry and the Member States.

Based on the available dataset, the European Food Safety Authority Panel calculated two refined exposure estimates based on different assumptions: a brand‐loyal consumer scenario, in which it is assumed that the population is exposed over a long period of time to the food additive present at the maximum reported use/analytical levels for one food category and to a mean reported use/analytical level for the remaining food categories; and a non‐brand‐loyal scenario, in which it is assumed that the population is exposed over a long period of time to the food additive present at the mean reported use/analytical levels in all relevant food categories.

For the maximum level exposure assessment scenario, at the mean, the exposure estimates ranged from 0.4 mg/kg body weight per day for infants and the elderly to 10.4 mg/kg body weight per day for children. At the 95th percentile, exposure estimates ranged from 1.2 mg/kg body weight per day for the elderly to 32.4 mg/kg body weight per day for children.

In the case of titanium dioxide, the European Food Safety Authority Panel did not identify brand loyalty to a specific food category and therefore the European Food Safety Authority Panel considered that the non‐brand‐loyal scenario covering the general population was the more appropriate and realistic scenario for risk characterization because it is assumed that the population would probably be exposed long term to food additives present at the mean reported use/analytical levels in processed food.

The European Food Safety Authority Panel noted that the lowest margin of safety calculated from the no observable adverse effect level (NOAEL) of 2,250 mg titanium dioxide/kg body weight per day identified in the available toxicological data and exposure data obtained from the reported use/analytical levels of titanium dioxide (E 171) considered in this opinion is above 100. In the Guidance for submission of food additives 8, the European Food Safety Authority Panel considered that, for non‐genotoxic and non‐carcinogenic compounds ‘a margin of safety of 100 or more between a NOAEL or benchmark dose level (BMDL) and the anticipated exposure would be sufficient to account for uncertainty factors for extrapolating between individuals and species’. Consequently, the European Food Safety Authority Panel considered that on the database currently available and the considerations on the absorption of titanium dioxide the margins of safety calculated from the NOAEL of 2,250 mg titanium dioxide/kg body weight per day identified in the toxicological data available and exposure data obtained from the reported use/analytical levels of titanium dioxide (E 171) considered in this opinion would not be of concern.

The European Food Safety Authority Panel concluded that once definitive and reliable data on the reproductive toxicity of E 171 were available, the full dataset would enable the European Food Safety Authority Panel to establish a health‐based guidance value of an acceptable daily intake (ADI).

Is titanium dioxide safe to eat

The re‐evaluation of titanium dioxide as a food additive (E 171) was completed by European Food Safety Authority in June 2016 and a scientific opinion was published in September 2016 5. In that opinion, European Food Safety Authority concluded, on the basis of the available evidence, that titanium dioxide (E 171) when used as a food additive does not raise a concern with respect to genotoxicity and that it is not carcinogenic after oral administration. However, several data gaps were also identified by European Food Safety Authority in the opinion. These warranted a follow‐up by the European Commission and new scientific evidence is being generated by interested parties in order to address the uncertainties highlighted by European Food Safety Authority in its scientific opinion.

From the available data on absorption, distribution and excretion, the European Food Safety Authority Panel on Food Additives and Nutrient Sources added to Food concluded in June 2016 that the absorption of orally administered titanium dioxide (TiO2) is extremely low and the low bioavailability of titanium dioxide (TiO2) appears to be independent of particle size 5. The European Food Safety Authority Panel concluded that the use of titanium dioxide (TiO2) as a food additive does not raise a genotoxic concern 5. From a carcinogenicity study with titanium dioxide (TiO2) in mice and in rats, the European Food Safety Authority Panel chose the lowest no observed adverse effects levels (NOAEL) which was 2,250 mg TiO2/kg body weight per day for males from the rat study, the highest dose tested in this species and sex. The European Food Safety Authority Panel noted that possible adverse effects in the reproductive system were identified in some studies conducted with material which was either non‐food‐grade or inadequately characterised nanomaterial (i.e. not E 171). There were no such indications in the available, albeit limited, database on reproductive endpoints for the food additive (E 171). The European Food Safety Authority Panel was unable to reach a definitive conclusion on this endpoint due to the lack of an extended 90‐day study or a multigeneration or extended‐one generation reproduction toxicity study with the food additive of titanium dioxide (TiO2, E 171). Therefore, the European Food Safety Authority Panel did not establish an acceptable daily intake (ADI). The European Food Safety Authority Panel considered that, on the database currently available and the considerations on the absorption of TiO2, the margins of safety calculated from the no observed adverse effects levels (NOAEL) of 2,250 mg TiO2/kg body weight per day identified in the toxicological data available and exposure data obtained from the reported use/analytical levels of TiO2 (E 171) would not be of concern 5. The European Food Safety Authority Panel concluded that once definitive and reliable data on the reproductive toxicity of E 171 were available, the full dataset would enable the European Food Safety Authority Panel to establish a health‐based guidance value of an acceptable daily intake (ADI).

On 22 March 2018, the European Commission, requested European Food Safety Authority to provide a scientific opinion in relation to four new animal and test tube studies by Heringa et al., 2016 10; Bettini et al., 2017 11; Guo et al., 2017 12 and Proquin et al., 2017 13, published after the scientific opinion in 2016 (see above), on the potential toxicity of titanium dioxide used as a food additive (E 171). In particular, European Food Safety Authority is requested to carry out a scientific evaluation of those studies and to indicate whether they would merit re‐opening the existing opinion of European Food Safety Authority related to the safety of titanium dioxide (E 171) as a food additive.

The European Food Safety Authority Panel has assessed the four publications as requested in the last mandate from the European Commission and made specific comments on each individual studies which have been considered in the context of the conclusions of the European Food Safety Authority opinion of 2016 5.

  • Overall, based on the data provided in the Bettini et al. 11 publication, and the negative results of the carcinogenicity studies in mice and rats performed by National Cancer Institute 14, the European Food Safety Authority Panel considered that the new findings were not sufficient to raise a concern on the potential initiation or promotion properties of titanium dioxide (E 171) on colon cancer.
  • Overall, the European Food Safety Authority Panel considered that the results reported in the Proquin et al. 13 study may be useful for an evaluation of the hazard of nano-titanium dioxide (nano-TiO2) under the specific conditions of the study protocol, including the cell model used and the conditions of culture. However, the Panel also considered that the relevance of the results for risk assessment of the food additive E 171 has not been established. The European Food Safety Authority Panel considered that these ongoing in vivo transcriptomics studies could be evaluated when completed, and if deemed necessary, the overall database reassessed considering the entire literature available at that time.
  • Regarding the Guo et al. 12 study, the European Food Safety Authority Panel noted that the study was performed with engineered nano-titanium dioxide (nano-TiO2) and not with titanium dioxide as a food additive and it was difficult to extrapolate these results to the in vivo situation.
  • Regarding the Heringa et al. 10 study, the European Food Safety Authority Panel considered that the aforementioned evaluations and considerations indicated that there was significant uncertainty in the assessment by Heringa et al. 10 and noted that there was not a weight of evidence analysis of the whole database on E 171. The European Food Safety Authority Panel considered that the assessment was consistent with a hazard from nano-titanium dioxide (nano-TiO2) when dosed as in the selected studies but the relevance to nanoparticles in a food matrix could not be assessed. The European Food Safety Authority Panel concluded that the additional studies called for in its 2016 opinion should provide a more robust basis for addressing the reported effects in reproductive organs in the studies used by Heringa et al. 10.

In summary

Based on the evaluation of the four studies concerning the potential adverse health effects of titanium dioxide the European Food Safety Authority Panel considered that:

  • the results of the Bettini et al. 11 study did not provide enough justification for a new carcinogenicity study, but, should additional useful mechanistic information become available, this could be reconsidered in future;
  • the new in vitro findings in the study by Proquin et al. 13 did not modify the conclusion on the genotoxicity of titanium dioxide as stated in the 2016 European Food Safety Authority opinion 5 on the safety of titanium dioxide (E 171) when used as a food additive;
  • the effects of engineered nano-titanium dioxide (nano-TiO2) particles reported by the Guo et al. 12 study were of uncertain biological significance and therefore of limited relevance for the risk assessment of the food additive titanium dioxide (E 171);
  • there was significant uncertainty in the risk assessment performed by Heringa et al. 10, which did not include a weight of evidence analysis of the whole database;
  • the four studies evaluated, highlighted some concerns but with uncertainties, therefore their relevance for the risk assessment was considered limited and further research would be needed to decrease the level of uncertainties.

More research exploring the possible effects observed in three of the four studies could address their applicability to the risk assessment of the food additive titanium dioxide (E 171) under realistic conditions of use.

Altogether, the European Food Safety Authority Panel concluded that the outcome of the four studies did not merit re‐opening the existing 2016 opinion of European Food Safety Authority related to the safety of titanium dioxide (E 171) as a food additive.

The European Food Safety Authority Panel recommended that:

  • in order to substantiate the observations in the Bettini et al. (2017), biomarkers for putative preneoplastic lesions in the colon as additional parameters should be examined in the extended one‐generation reproductive toxicity study recommended by European Food Safety Authority 5;
  • further studies on nano-TiO2 should include administration in a food matrix.

What is nano titanium dioxide?

The “nano” form of this substance (nano-TiO2) refers to particles that are less than 100 nanometers in size. One nanometer is one billionth of a meter. Due to their small size and unique properties, the physical, chemical, and biological behaviors of nanoparticles may differ from naturally occurring or non-nano materials. Nano-titanium dioxide is used in various consumer products as a ultra-violet (UV) blocking agent, whitening agent, and antibacterial agent. Some common consumer products that use nano-titanium dioxide include: sunscreen, creams, cosmetics, toothpaste, bacteria-free socks, swimsuits, paints and coatings, car wax, paper, and inks. Nano-titanium dioxide is also used as a food coloring (e.g. to whiten skim milk) and a drug-delivery system in certain medicines. Nano-titanium dioxide can also be used in air purification and water treatment facilities, plastic and packaging films, electronics, and to preserve wood and textile fibers.

Titanium dioxide is produced from iron titanate or titanium slag by digesting with sulfuric acid or from ores with a high titanium content by heating with coke and chlorine to form titanium tetrachloride, then oxidizing to titanium chloride 15. Workers that make or use nano-titanium dioxide may breathe in mists or have direct skin contact. The general population may also breathe in mists or have direct skin contact while using consumer products that contain nano-titanium dioxide, such as sunscreens or cosmetics. Exposure may also occur through the ingestion of drinking water, food, or drugs containing nano-titanium dioxide. Patients receiving injections containing nano-titanium dioxide can also be exposed. If titanium oxide nanoparticles are released to the environment they will not be broken down in air. Nanoparticles can remain in the air and travel long distances due to their small size and light weight. They may not move into air from moist soil and water surfaces. The particles may move slowly to quickly through soil, depending on the soil type. It is not known if titanium nanoparticles will be broken down by microorganisms. In water, they may be broken down by sunlight. water. Titanium oxide nanoparticles may build up in aquatic organisms.

Data on the potential for nano-titanium dioxide to produce toxic effects in humans were not available. Mild respiratory irritation has been observed in workers exposed to titanium dioxide, but no major health effects or cancers have been clearly associated with occupational exposure to titanium dioxide 16. Several national agencies are conducting research to determine if nanoparticles (including nano-titanium dioxide) pose a threat to exposed workers or consumers 16. Nano-titanium dioxide is not a skin or eye irritant in laboratory animals. Allergic skin reactions did not occur following direct skin contact. Damage to the lung and spleen and changes in brain chemical levels have been reported in laboratory animals that repeatedly breathed nano-titanium dioxide. Altered behavior and changes in brain chemical levels occurred in laboratory animals following repeated oral exposure. Mild kidney and liver damage were observed in laboratory animals exposed to oral or dermal levels of nano-titanium dioxide. Damage to the liver, kidneys, heart and brain, altered blood sugar and cholesterol levels, tremors, and sluggishness were seen in laboratory animals injected with nano-titanium dioxide. In all animal studies, levels of nano-titanium dioxide were much higher than expected human exposure. The potential for nano-titanium dioxide to cause infertility, abortion, or birth defects has not been assessed in laboratory animals. Altered brain development and impaired learning and memory have been observed in offspring of laboratory animals exposed to nano-titanium dioxide during pregnancy. The potential for nano-titanium dioxide to cause cancer in humans has not been assessed by the U.S. EPA IRIS program, the International Agency for Research on Cancer, or the U.S. National Toxicology Program 13th Report on Carcinogens 16. The International Agency for Research on Cancer has classified titanium dioxide as possibly carcinogenic to humans 7. The National Institute for Occupational Safety and Health has determined ultrafine titanium dioxide is a potential occupational carcinogen based insufficient evidence in humans and sufficient evidence in animals, but determined that data are insufficient to classify the carcinogenicity of fine titanium dioxide. Lung tumors were increased in rats following lifetime exposure to ultrafine or fine titanium dioxide in the air. It is not known if these findings apply to nano-titanium dioxide.

The International Agency for Research on Cancer 6 concluded that there is inadequate evidence from epidemiological studies to assess whether titanium dioxide dust causes cancer in humans, but that there is sufficient evidence for carcinogenicity in experimental animals, based on the induction of respiratory tract tumors in rats after prolonged inhalation. Therefore, International Agency for Research on Cancer classified titanium dioxide as a Group 2B carcinogen 7.

What is titanium dioxide used for?

Titanium dioxide (TiO2) have been used in the food sector for more than 50 years as a pigment to enhance the white color and opacity of foods like coffee creamer, sauces, spreads, pastries, candies and edible ices 17.

Also, titanium dioxide confers brightness to toothpaste and is added to enhance the flavor of non-white foods (processed fish, fruits, meat, vegetables, breakfast cereals, fermented soybean, soups and mustard) and to clear beverages (beer, cider and wine) 18, 19.

Currently, the annual consumption volume of titanium dioxide particles reaches four million tons, which makes it the most widely used pigment globally 20. In the United States, the Food and Drug Administration allows up to 1% by weight of titanium dioxide particles as a food colorant 21. In the European Union (EU), titanium dioxide is an authorized food additive (listed as E 171) at quantum satis, meaning that no maximum level is imposed as long as the additive is used in accordance with good manufacturing practice, i.e., at a level not higher than necessary to achieve the intended scope 22. A comparison of use levels reported by the food industry show that the highest titanium dioxide concentrations are expected in chewing gum (up to 16,000 mg/kg), food supplements delivered in a solid form (up to 12,000 mg/kg), processed nuts (up to 7000 mg/kg) and ready-to-use salads and sandwich spreads (up to 3000 mg/kg) 23. Titanium dioxide particles can, therefore, be viewed as a paradigmatic case for the safety assessment of inorganic particles employed as food additive and comprising a nano-scale fraction.

Titanium dioxide sunscreen

Sunscreens are used to provide protection against adverse effects of ultraviolet (UV)B (290–320 nm) and UVA (320–400 nm) radiation 24. According to the United States Food and Drug Administration, the protection factor against UVA should be at least one-third of the overall sun protection factor. Titanium dioxide (TiO2) and zinc oxide (ZnO) minerals are frequently employed in sunscreens as inorganic physical sun blockers 25. Advantages offered by sunscreens based on inorganic compounds comprise absence of skin irritation and sensitization, inertness of the ingredients, limited skin penetration, and a broad spectrum protection 26. As Titanium dioxide (TiO2) is more effective in UVB and zinc oxide in the UVA range, the combination of these particles assures a broad-band UV protection.

The natural opaqueness of these microsized sunscreen components is eliminated without reducing their UV blocking efficacy by utilizing nanosized zinc oxide (ZnO) and titanium dioxide particles 27. Since the surface area to volume ratio of particles increases as the particle diameter decreases, nanoparticles, may be more (bio)reactive than normal bulk materials. That is why the safety of cosmetic products containing nanoparticles, in particular the sunscreens, has been frequently discussed 28. Sunscreens are ultimately aimed as UV protection, and the introduction of nanoparticles in this product should not cause more trouble than sun exposure itself. Recent reports and reviews on safety aspects of nanoparticle sunscreens mainly focus on various kinds of toxicological and skin penetration studies 29. However, safety also concerns the physicochemical properties of sunscreen ingredients to be taken up by skin in both the absence and presence of light. A more physicochemical approach could lead to new nanoparticle formulations displaying an accurate balance between safety and effectiveness. However, investigations that address the subject of nanoparticle sunscreen safety from a physicochemical point of view are scarce.

In noncommercial research of sunscreens that contain nanoparticles, the subject of safety mainly concerns skin penetration studies. Microsized titanium dioxide and zinc oxide have been used as particulate sunscreen ingredients (average size approximately 0.1–10.0 μm) for more than 15 years 30. Various microsized anatase and rutile titanium dioxide and wurtzite zinc oxide particles, coated and uncoated, have been utilized. The UV attenuation results from both reflection and scattering of UV radiation and visible light (clarifying the opaqueness of these sunscreen formulations) and from UV absorption. UV attenuation properties of these two particles are complementary; titanium dioxide being primarily a UVB absorbing compound, while zinc oxide is more efficient in UVA absorption. Apart from size-related optical particle properties, the ability of particles to attenuate UV radiation is determined by the surrounding medium.The replacement of microsized titanium dioxide and zinc oxide particles by nanoparticles ensures the cosmetically desired sunscreen transparency, but at the expense of broad UVA protection. Skin exposure to the nanoparticle sunscreens leads to incorporation of titanium dioxide and zinc oxide nanoparticles into the deepest stratum corneum layers and in the hair follicles that may serve as long-term reservoirs. Within skin, nanoparticle aggregation, particle–skin and skin–particle-light physicochemical interactions influence the overall UV attenuation efficacy, a complex process that is still poorly understood.

Titanium dioxide side effects

Although titanium dioxide is generally regarded as a nontoxic mild pulmonary irritant, some laboratory studies have reported lung adenomas in rats exposed to high levels of titanium dioxide. Limited data on health effects among humans exist. A retrospective cohort mortality study was conducted among 4241 titanium dioxide workers who were employed for at least 6 months, on or after January 1, 1960, at four titanium dioxide plants in the United States. Exposure categories, defined by plant, job title, and calendar years in the job, were created to examine mortality patterns in those jobs where the potential for titanium dioxide exposure is greatest. Standardized mortality ratios and their 95% confidence intervals were calculated to compare the mortality pattern of the workers with the general background population. Standardized Mortality Ratio is a ratio between the observed number of deaths in an study population and the number of deaths would be expected, based on the age- and sex-specific rates in a standard population and the age and sex distribution of the study population. If the ratio of observed:expected deaths is greater than 1.0, there is said to be “excess deaths” in the study population 31. Relative risks were estimated and trend tests were conducted to examine risk of disease among different exposure level groups in internal analyses. Workers experienced a significantly low overall mortality. No significantly increased standardized mortality ratios were found for any specific cause of death. Deaths from lung cancer were as expected, and standardized mortality ratios for this cancer did not increase with increasing titanium dioxide levels. Workers in jobs with greatest titanium dioxide exposure had significantly fewer than expected total deaths. Internal analyses revealed no significant trends or exposure-risk associations for total cancers, lung cancer, or other causes of death 32. Results from that study indicate that the exposures at these United States plants are not associated with increases in the risk of death from cancer or other diseases. Moreover, workers with likely higher levels of titanium dioxide exposure had similar mortality patterns to those with less exposure, as internal analyses among workers revealed no increase in mortality by level of titanium dioxide exposure.

To assess the risk of lung cancer mortality related to occupational exposure to titanium dioxide, a mortality follow-up study of 15,017 workers (14,331 men) employed in 11 factories producing titanium dioxide in Europe was performed 33. Exposure to titanium dioxide dust was reconstructed for each occupational title; exposure estimates were linked with the occupational history. Observed mortality was compared with national rates, and internal comparisons were based on multivariate Cox regression analysis. The cohort contributed 371,067 person-years of observation (3.3% were lost to follow-up and 0.7% emigrated). 2652 cohort members died during the follow-up, yielding standardized mortality ratios of 0.87 among men and 0.58 among women. Standardized Mortality Ratio is a ratio between the observed number of deaths in an study population and the number of deaths would be expected, based on the age- and sex-specific rates in a standard population and the age and sex distribution of the study population. If the ratio of observed:expected deaths is greater than 1.0, there is said to be “excess deaths” in the study population 31. Among men, the Standardized Mortality Ratio of lung cancer was significantly increased; however, mortality from lung cancer did not increase with duration of employment or estimated cumulative exposure to titanium dioxide dust 33. Data on smoking were available for over one third of cohort members. In three countries, the prevalence of smokers was higher among cohort members compared to the national populations. The results of the study do not suggest a carcinogenic effect of titanium dioxide dust on the human lung 33.

A total of 1,576 employees exposed to titanium dioxide were observed from 1956 through 1985 for cancer and chronic respiratory disease incidence, and from 1935 through 1983 for mortality 34. A cross sectional sample of 398 employees was evaluated for chest roentgenogram abnormalities. Cohort analyses suggest that the risks of developing lung cancer and other fatal respiratory diseases were no higher for titanium dioxide exposed employees than for the referent groups. Nested case control analysis found no statistically significant associations between titanium dioxide exposure and risk of lung cancer, chronic respiratory disease, and chest roentgenogram abnormalities. No cases of pulmonary fibrosis were observed among titanium dioxide exposed employees.

To investigate titanium dioxide exposure level in the finished product workshop, and its short-term cardiopulmonary effects, based on exposure assessment, seven workers were recruited into the panel. Personal titanium dioxide exposure information, cardiopulmonary function, and the particle size distribution data were collected during working days 35. Linear mixed effect model was used to examine the association between titanium dioxide exposure and cardiopulmonary function changes. The weight percentage of titanium dioxide particles more than 10 um, 1 to 10 um, and less than 1 um in the total dust was 14.5%, 69.5%, and 16%, respectively. Linear mixed effect model analysis showed that 1 mg/m³ increase in daily personal titanium dioxide exposure was associated with the decline in maximum voluntary ventilation, peak expiratory flow, maximum mid-expiratory flow, and 75% of maximum expiratory flow. The study provided new evidence for health effects of occupational inhalable titanium dioxide exposure, which suggests setting up new occupational exposure standards for fine titanium dioxide.

A study of 67 subjects in a small titanium oxide paint factory in Nigeria showed 50-54% frequency for airway symptoms, 20-40% for neurological symptoms, and 10-27% for other symptoms 36. The symptoms were well correlated with exposure and pulmonary function tests. The directly exposed subjects had likelihood odds ratios of 5 to 17 of presenting symptoms compared to controls. The pulmonary function test deficit, relative to the expected value, was significantly higher for those with airway symptoms than for those of other symptom categories. There were 28 (42%) cases of restrictive lung impairment. Exposure to cotton dust had confounding influence on the pulmonary function test of subjects previously exposed. Smoking rate was very low. These findings indicate the need for worker protection in a manufacturing plant in Nigeria 36.

References
  1. Theissmann R, Kluwig M, Koch T. A reproducible number-based sizing method for pigment-grade titanium dioxide. Beilstein J Nanotechnol. 2014;5:1815–1822. doi: 10.3762/bjnano.5.192
  2. Commission Regulation (EU) No 231/2012 of 9 March 2012 laying down specifications for food additives listed in Annexes II and III to Regulation (EC) No 1333/2008 of the European Parliament and of the Council
  3. Winkler HC, Notter T, Meyer U, Naegeli H. Critical review of the safety assessment of titanium dioxide additives in food. Journal of Nanobiotechnology. 2018;16:51. doi:10.1186/s12951-018-0376-8 https://www.ncbi.nlm.nih.gov/pmc/articles/PMC5984422/
  4. JECFA . Compendium of food additive specifications. Geneva: World Health Organization; 2012.
  5. EFSA ANS Panel (EFSA Panel on Food Additives and Nutrient Sources added to Food), 2016. Scientific Opinion on the re‐evaluation of titanium dioxide (E 171) as a food additive. EFSA Journal 2016;14(9):4545, 83 pp. https://efsa.onlinelibrary.wiley.com/doi/full/10.2903/j.efsa.2016.4545
  6. Baan R, Straif K, Grosse Y, Secretan B, El Ghissassi F, Cogliano V, W. H. O. International Agency for Research on Cancer Monograph Working Group Carcinogenicity of carbon black, titanium dioxide, and talc. Lancet Oncol. 2006;7:295–296. doi:10.1016/S1470-2045(06)70651-9
  7. IARC Working Group on the Evaluation of Carcinogenic Risks to humans: carbon black, titanium dioxide, and talc. IARC Monogr Eval Carcinog Risks Hum. 2010;93:1 https://www.ncbi.nlm.nih.gov/books/NBK326527/
  8. EFSA ANS Panel (EFSA Panel on Food Additives and Nutrient Sources added to Food), 2012. Guidance for submission for food additive evaluations. EFSA Journal 2012;10(7):2760, 60 pp. doi:10.2903/j.efsa.2012.2760
  9. Acceptable daily intake. https://en.wikipedia.org/wiki/Acceptable_daily_intake
  10. Heringa MB, Geraets L, vanEijkeren JCH, Vandebriel RJ, deJong W and Oomen AG, 2016. Risk assessment of titanium dioxide nanoparticles via oral exposure, including toxicokinetic considerations. Nanotoxicology, 10.
  11. Bettini S, Boutet‐Robinet E, Cartier C, Coméra C, Gaultier E, Dupuy J, Naud N, Taché S, Grysan P, Reguer S, Thieriet N, Réfrégiers M, Thiaudière D, Cravedi J‐P, Carrière M, Audinot J‐N, Pierre FH, Guzylack‐Piriou L and Houdeau E, 2017. Food‐grade TiO2 impairs intestinal and systemic immune homeostasis, initiates preneoplastic lesions and promotes aberrant crypt development in the rat colon. Scientific Reports, 7, 40373.
  12. Guo Z, Martucci N, Moreno‐Olivas F, Tako E and Mahler G, 2017. Titanium dioxide nanoparticle ingestion alters nutrient absorption in an in vitro model of the small intestine. NanoImpact, 5, 70–82, janvier 2017.
  13. Proquin H, Rodriguez‐Ibarra C, Moonen CG, Urrutia‐Ortega IM, Briede JJ, de Kok TM, van Loveren H and Chirino Y, 2017. Titanium dioxide food additive (E 171) induces ROS formation and genotoxicity: contribution of micro and nano‐sized fractions. Mutagenesis, 32, 139–149.
  14. National Cancer Institute. 1979. Bioassay of titanium dioxide for possible carcinogenicity. Carcinogenesis Technical Report Series No 97. Bethesda (Maryland): U.S. Department of Health, Education, and Welfare, Public Health Service, National Institutes of Health.
  15. Titanium Dioxide (TiO2) https://monographs.iarc.fr/wp-content/uploads/2018/06/TR42-4.pdf
  16. TITANIUM OXIDE NANOPARTICLES. https://toxnet.nlm.nih.gov/cgi-bin/sis/search2/f?./temp/~1D6aQd:2
  17. Winkler HC, Notter T, Meyer U, Naegeli H. Critical review of the safety assessment of titanium dioxide additives in food. Journal of Nanobiotechnology. 2018;16:51. doi:10.1186/s12951-018-0376-8. https://www.ncbi.nlm.nih.gov/pmc/articles/PMC5984422/
  18. Peters RJB, van Bemmel G, Herrera-Rivera Z, Helsper HPFG, Marvin HJP, Weigel S, Tromp PC, Oomen AG, Rietveld AG, Bouwmeester H. Characterization of titanium dioxide nanoparticles in food products: analytical methods to define nanoparticles. J Agric Food Chem. 2014;62:6285–6293. doi: 10.1021/jf5011885
  19. Yang Y, Doudrick K, Bi XY, Hristovski K, Herckes P, Westerhoff P, Kaegi R. Characterization of food-grade titanium dioxide: the presence of nanosized particles. Environ Sci Technol. 2014;48:6391–6400. doi: 10.1021/es500436x
  20. Ortlieb M. White giant or white dwarf?: Particle size distribution measurements of TiO2. GIT Lab J Europe. 2010;14:42–43.
  21. Code of Federal Regulations. Listing of color additives exempt from certification https://www.accessdata.fda.gov/scripts/cdrh/cfdocs/cfcfr/cfrsearch.cfm?fr=73.575
  22. Regulation (EC) No 1333/2008 of the European Parliament and of the Council of 16 December 2008 on food additives. https://eur-lex.europa.eu/eli/reg/2008/1333/2014-04-14
  23. EFSA ANS Panel (EFSA Panel on Food Additives and Nutrient Sources added to Food) Re-evaluation of titanium dioxide (E 171) as a food additive. EFSA J. 2016;14(9):4545.
  24. Light therapy (with UVA-1) for SLE patients: is it a good or bad idea? Pavel S. Rheumatology (Oxford). 2006 Jun; 45(6):653-5.
  25. Smijs TG, Pavel S. Titanium dioxide and zinc oxide nanoparticles in sunscreens: focus on their safety and effectiveness. Nanotechnology, Science and Applications. 2011;4:95-112. doi:10.2147/NSA.S19419. https://www.ncbi.nlm.nih.gov/pmc/articles/PMC3781714/
  26. Sunscreens–what’s important to know. Antoniou C, Kosmadaki MG, Stratigos AJ, Katsambas AD. J Eur Acad Dermatol Venereol. 2008 Sep; 22(9):1110-8.
  27. Nohynek GJ, Dufour EK, Roberts MS. Nanotechnology, cosmetics and the skin: is there a health risk? Skin Pharmacol Physiol. 2008;21:136–149
  28. Newman MD, Stotland M, Ellis JI. The safety of nanosized particles in titanium dioxide- and zinc oxide-based sunscreens. J Am Acad Dermatol. 2009;61:685–692
  29. Schilling K, Bradford B, Castelli D, et al. Human safety review of “nano” titanium dioxide and zinc oxide. Photochem Photobiol Sci. 2010;9:495–509
  30. Gasparro FP, Mitchnick M, Nash JF. A review of sunscreen safety and efficacy. Photochem Photobiol. 1998;68:243–256
  31. Standardized Mortality Ratio. https://ibis.health.state.nm.us/resource/SMR_ISR.html
  32. Fryzek JP et al; J Occup Environ Med 45 (4): 400-9, 2003
  33. Boffetta P et al; Cancer Causes Control 15 (7): 697-706,2004 https://link.springer.com/article/10.1023%2FB%3ACACO.0000036188.23970.22
  34. Chen JL, Fayerweather WE; J Occup Med 30 (12): 937-42, 1988 https://www.ncbi.nlm.nih.gov/pubmed/3230444
  35. Zhen S et al; J Occup Environ Med 54 (11): 1389-94, 2012 https://www.ncbi.nlm.nih.gov/pubmed/23059552
  36. Oleru UG; Am J Ind Med 12 (2): 173-80; 1987 https://www.ncbi.nlm.nih.gov/pubmed/3661570
read more
1 2
Page 1 of 2
Health Jade